The following is a problem set that will allow you to explore the various monitoring datasets that are used at Kilauea volcano. I am more interested in you being able to get a grasp of what instrumentation is deployed, what it measures, why it is important, and how the various measurements work together to give scientists a picture of the overall state of the volcano. I am less concerned with you being able to define each bump and wiggle that you might see. So think big picture when you look at the tilt, rsam, and gps data.
Kilauea Volcanism Problem Set
Directions
The goal of this problem set is for you to:
- read a report detailing recent eruptive activity at Kilauea volcano.
- predict hypothetical instrument responses to certain volcanic activities
- calculate the rate of magma movement based on measured seismicity
- use tilt, GPS, and RSAM data to describe an eruptive event at Kilauea.
Part 1, reading and questions
Read this paper, available in our Canvas space. This paper is a report of some sustained eruptive activity that occurred on Kilauea and its East Rift Zone during the summer of 2007. The activity was recorded by a wide variety of geological, geophysical, and geochemical monitoring instruments, the details of which are discussed in the paper. If you are unfamiliar with any or all of the types of instrumentation described, this paper may seem dense. My advice when reading is to try to focus on the space-time sequence of events, rather than the specifics of the instrumentation. In addition, you may want to go back one page in this lesson to refresh your memory of what each type of instrument measures. Perusing my follow-up questions first will help focus your reading.
Poland, M., A. Miklius, T. Orr, J. Sutton, C. Thornber, and D. Wilson, 2008. New Episodes of Volcanism at Kilauea Volcano, Hawaii, Eos 89, 37-38.
Answer the following questions. Append them to the same document you started for the eruptions problem set that dealt with the VOGRIPA database.
Questions:
- Look at Figure 2 of Poland et al., 2008. Find the summit caldera. Find the three instruments UWE, UWEV, and AHUP. UWE is a tiltmeter. UWEV and AHUP are GPS stations. If the summit were inflating with magma, would you expect UWEV and AHUP to get closer together or farther apart? Why? If the summit were inflating, in what direction would UWE tilt? Why?
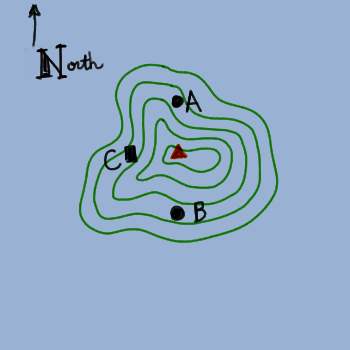
- This question is just hypothetical! It is not directly related to the paper you read. Draw a sketch of the expected signal during a hypothetical summit caldera inflation and subsequent eruption. The blue sketch below shows the hypothetical caldera for this problem. A and B are both GPS stations and C is a tiltmeter. The triangle is the caldera summit. On the blank axes, time is on the x axis and distance is on the y axis for the GPS signal. Time is on the x axis and angle is on the y axis for tilt. The vertical dotted lines mark the beginning of caldera inflation and the beginning of the eruption. To make your drawing, you can use the simple drawing tools associated with your favorite word processing program, or just draw it by hand, take a picture of it, and insert it into your document. I am not looking for correct units, this is just a sketch.
- Calculate magma flow speed based on earthquake locations given in the bottom panel of Figure 3B of Poland et al., 2008. Speed should be calculated over the time period spanned by the episodes labeled T1 - T5. Note the scale bar of 1 km given in the lower corner of the plot. When you write your answer to this question, please lead me through your logic. You will have to make some choices about how to estimate times and distances, and I want to hear your explanation of how you chose to do this.
Part 2, analyze and interpret real data from the 2018 eruption at Kilauea
The Hawaiian Volcano Observatory continuously monitors both the Kilauea summit and the Pu'u O'o vent to the east with a variety of geophysical instrumentation. Their Deformation Data page explains how to interpret deformation plots in light of what the volcano is doing.
There was an eruption that began in May 2018. I want you to use GPS, tilt and seismic data to describe it. This is part of the real fun of using real scientific data that hasn't been sanitized for "educational purposes"! Post to the Questions discussion board if you get stuck!
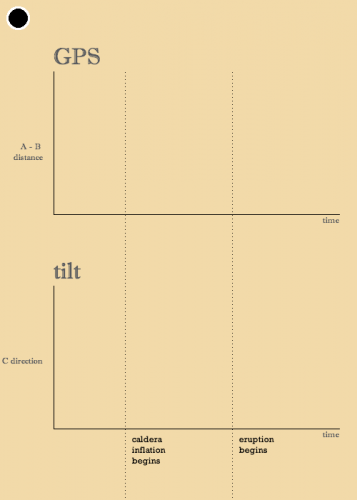
Below is a map of instrument locations. Use it to answer questions 1 and 2. For more detailed maps, refer to the maps on the previous page.
- The tilt stations are UWE and POC. Where are these two stations relative to the summit and the Pu'u O'o vent? If the magma chamber under the summit were inflating, describe what each tiltmeter would be doing.
- The GPS data from Pu'u O'o is plotted as the distance between the two stations PUOC and JCUZ. Where are those two stations in relation to the Pu'u' O'o vent? Would they be getting farther apart, closer together, or staying the same distance apart if the magma chamber under Pu'u O'o were inflating?
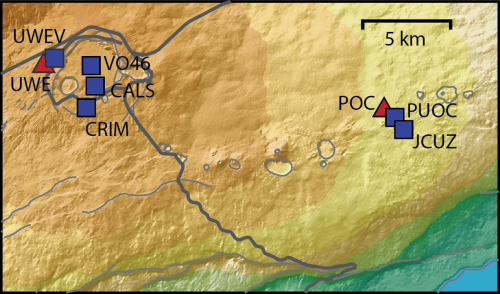
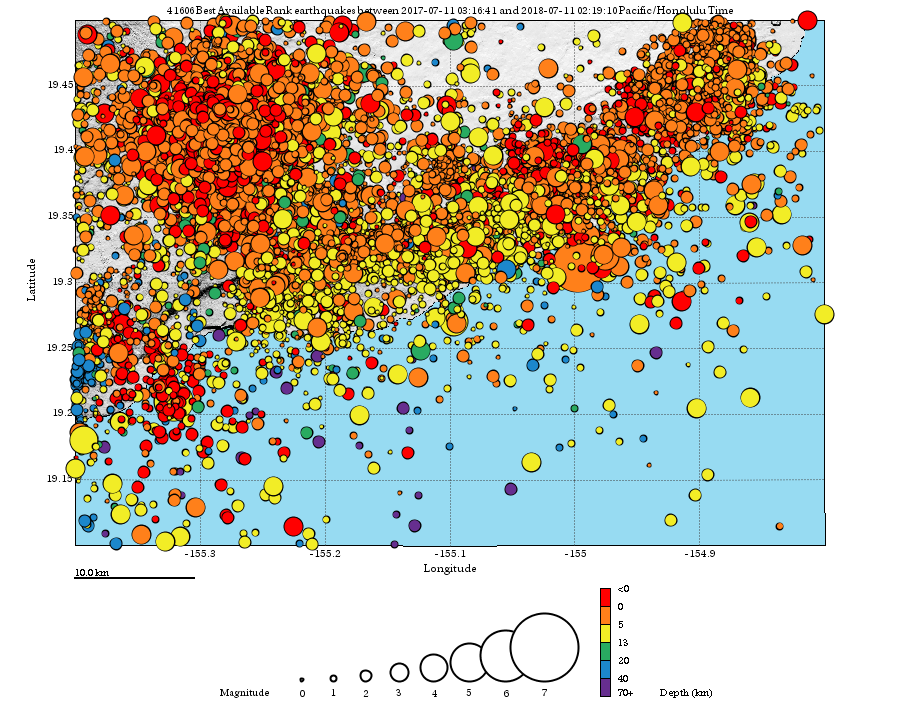 Map of earthquakes near Kilauea from July 2017-July 2018USGS
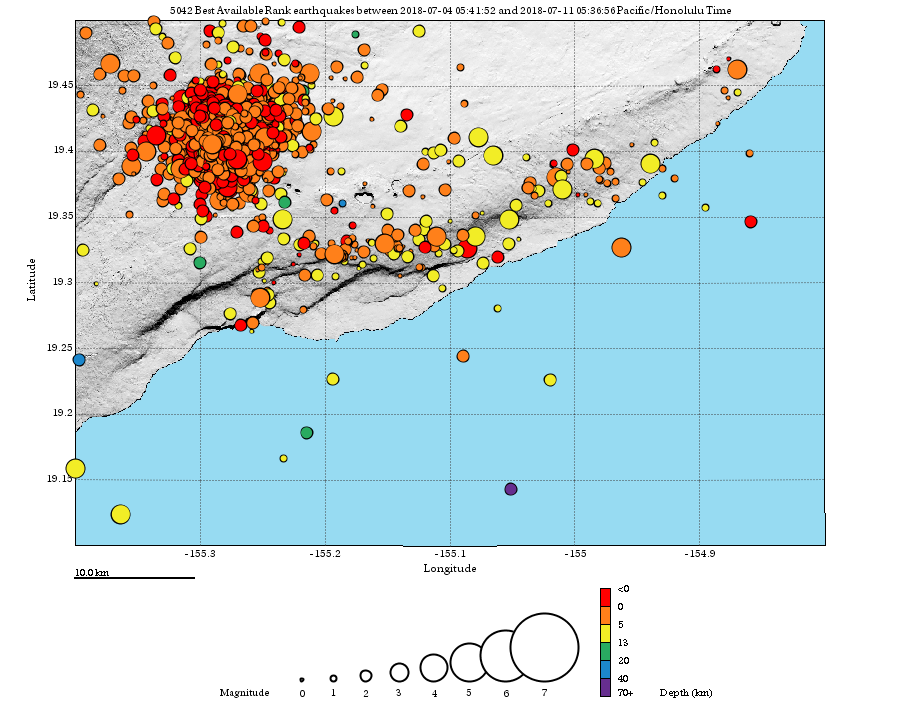 Map of earthquakes near Kilauea from July 4 - July 11 2018USGS
 - Look at the maps of earthquake locations above. The top map is a year's worth of locations, and the bottom is just for a single week in July 2018. Describe in a few sentences the differences and similarities between them. Obviously there are a lot more earthquakes over a year as opposed to a week, but can you see any changes in where earthquakes tend to locate?
 Earthquake counts per week at Kilauea from July 2017 - July 2018USGS
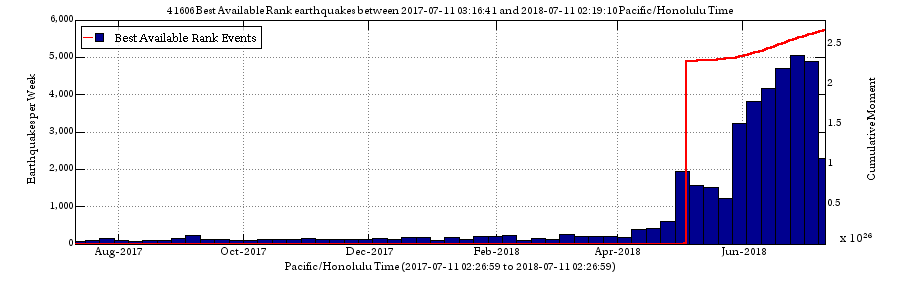
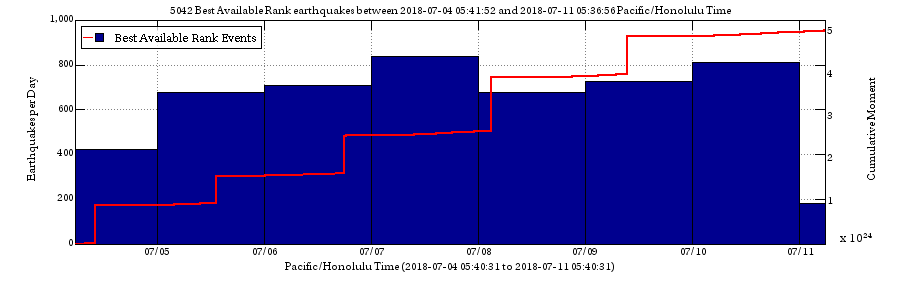 Earthquake counts per day at Kilauea from July 4, 2018 - July 11, 2018USGS
 - The two plots above show earthquake counts (blue bars) and cumulative moment (red lines) for a year (July 2017-July 2018) and for a single week in July 2018. When during the year-long interval did the seismicity per day begin to increase? Look at the plot of amount of seismicity over the week-long interval and determine whether seismicity has increased, decreased, or stayed about same with regard to the peak seismicity over the year-long interval. Pay attention to the y axis scale because the year-long plot is counts per week, whereas the week-long plot is in counts per day.
- There was a magnitude 6.9 on May 4 that is the single biggest jump in the red line on the top plot of cumulative moment release. Find it on the seismic locations map and tell me its approximate location (lat, lon). Hint: it's orange, and it isn't shown on the week-long seismic locations map because it happened before that week.
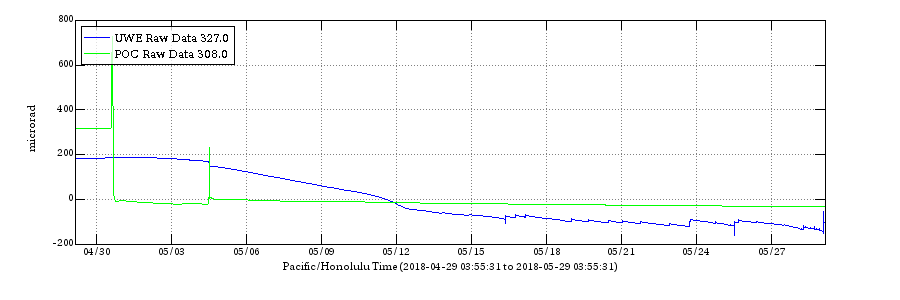 Kilauea summit and Pu'u O'o tilt from April - May 2018USGS
 - Now let's take a look at the tilt data. What time period does the plot above cover? Go back and read your own answer to question 1 in this problem set and use it to describe what is probably going on underneath each instrument over this time period. For example, is the magma chamber inflating or deflating? Is there steady behavior or little jumps that indicate unrest at the volcano?
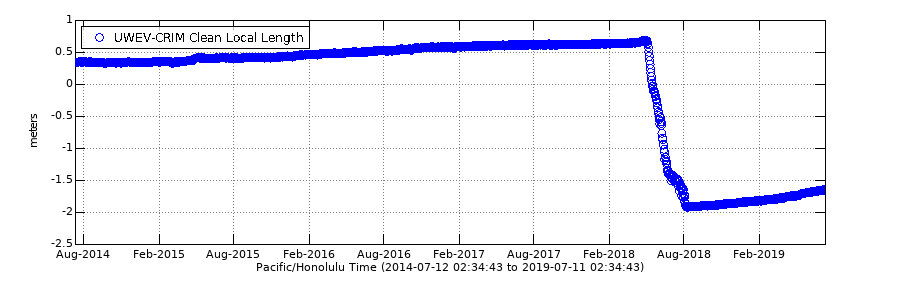 Length change across Kilauea summit recorded by GPSUSGS
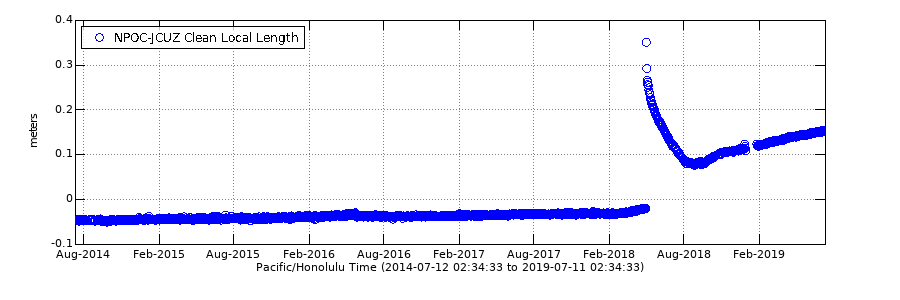 Length change across Pu'u O'o vent recorded by GPSUSGS
 - Onto the GPS data! What is the approximate rate of change of the distance between CRIM and UWEV between August 2014 and August 2017. What I am asking you for is a velocity. Are the two stations getting closer together or farther apart, and how fast is this happening? Pay attention to the units.
- What is the amount of change between CRIM and UWEV from approximately May 2018 to August 2018?
- Describe what is happening between CRIM and UWEV post August 2018.
- Describe what happens between NPOC and JCUZ (NPOC is co-located with POC on the map) between August 2014 and February 2019. How is the GPS data different at the summit as opposed to Pu'u O'o regarding the 2018 eruption?
- When did the 2018 eruption end? Check out the current alert status at Kilauea to find out.
Submitting your work
Upload the document containing both your earlier work from VOGRIPA and the work you just did with Kilauea to the eruptions problem set assignment in Canvas by the due date specified on the first page of this lesson.
Grading criteria
I will use my general grading rubric for problem sets to grade this activity.