The sudden movements on faults that produce earthquakes are recorded by seismometers, but we know that all the plates on the surface of the Earth are in constant motion. Over the past ten or fifteen years, global positioning system satellite data has become an invaluable tool for measuring plate motion and strain accumulation across faults. This data is gathered by installing geodetic markers in the ground. Scientists then use GPS receivers at the sites of the markers to find out their exact locations from satellites. Over time, the position of the markers shift as the plate they are affixed to moves. The markers also move relative to each other; for example, markers on opposite sides of a fault may move closer together or further apart or be offset laterally as the years go by. This motion can be used to infer the strain rate in the crust. After several years of repeated measurements, the motion of the markers over the measurement time period is assessed. At active plate boundaries, such as along the San Andreas Fault on the West Coast of the United States, geodetic surveys have been used in concert with detailed records of seismicity to estimate stress buildup on faults and to predict seismic hazard. For example, a suite of geodetic markers may be placed around a fault of interest. After many measurements, the motion of the markers relative to each other can confirm the sense of motion on the fault, how fast the plates on either side of the fault are moving, and whether the fault itself is creeping or locked.
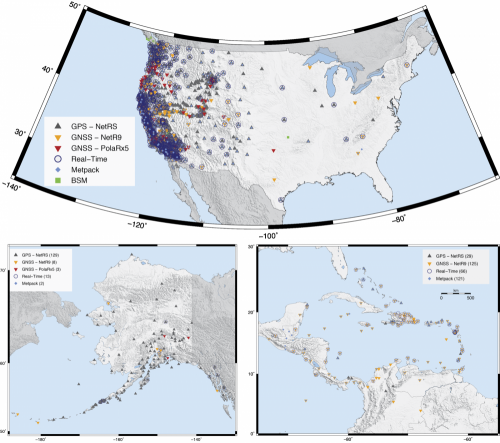
The Plate Boundary Observatory was a geodetic observatory designed to study the three-dimensional strain field resulting from deformation across the active boundary zone between the Pacific and North American plates in the western United States. The observatory consisted of arrays of Global Positioning System (GPS) receivers and Strainmeters (see map below for the locations of currently installed PBO instruments) which were be used to deduce the strain field on timescales of days to decades and geologic and paleoseismic investigations to examine the strain field over longer time scales.
The PBO was combined with some other networks in Central and South America in 2018 and is now called NOTA, Network of the Americas. You can read more about it UNAVCO's website.
What does GPS time series data look like?
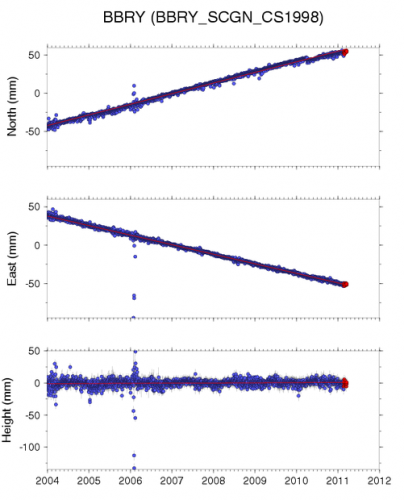
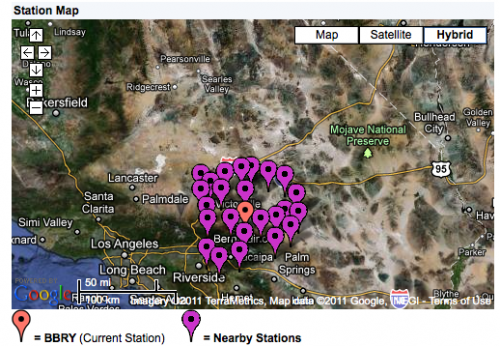
Let's walk through the signals recorded by a typical PBO geodetic station. I chose a station at random in Big Bear City, California, called BBRY. The map below shows a snapshot of the location of BBRY (the orange one) as well as a bunch of nearby stations (the purple ones).
Typically, GPS stations record their position based on communicating with a satellite once per day or so. Below are plots of the three components of time series data recorded by BBRY since 2004. All three plots have time on the x axis. The top plot shows position in the north-south direction, the middle plot shows position in the east-west direction, and the bottom plot shows vertical position. When I look at these plots, I see that since 2004, BBRY has been moving steadily to the northwest and its vertical position is basically constant. How do I read this from the plots? Let's check it out together (pencast). You may also want to check out UNAVCO's reference guide for reading GPS time series plots.