Lesson 6: Volcanic Eruptions
Overview
Lesson 6 will take us one week to complete. This lesson is about volcanic eruptions.
What will we learn in Lesson 6?
By the end of Lesson 6, you should be able to:
- Compare the size of historical eruptions in terms of explosivity and volume of ejected material.
- List the types of material ejected from volcanoes during eruptions.
- Correlate typical volcanic products with certain tectonic regimes.
- Explain the life cycle of a caldera-forming volcano.
- Debunk some commonly held myths concerning volcanoes and volcanic eruptions.
- Interact with the real-time, volcano-monitoring datasets provided by the Volcanoes Exploration Program (hosted by the USGS).
What is due for Lesson 6?
The chart below provides an overview of the requirements for Lesson 6. For assignment details, refer to the lesson page noted.
Lesson 6 will take us one week to complete. 15 - 21 Jul 2020.
| Requirement | Submitted for Grading? | Due Date |
|---|---|---|
| Reading Assignment: "Witness accounts of the catastrophic event of August 1986 at Lake Nyos (Cameroon)" | No | 21 Jul 2020 |
| Eruptions problem set | Yes - Turn it in to the "eruptions problem set" assignment in Canvas. | 21 Jul 2020 |
| Teaching and Learning II | Yes - This will be part of your discussion grade for the course. Participate in the Canvas discussion called "Teaching/Learning 2" | multiple participation spanning 15 - 21 Jul 2020 |
Questions?
If you have any questions, please post them to our Questions? Discussion Forum (not e-mail). I will check that discussion forum daily to respond. While you are there, feel free to post your own responses if you, too, are able to help out a classmate.
Where Does Volcanic Activity Occur?
Myth: Most of the Earth's igneous rocks are produced at the "Ring of Fire."
Fact: 70% of the Earth's surface is ocean floor, which is made of basalt, an igneous rock produced at mid-ocean ridges. The ridges are the most volcanically active features on the planet.
Plate boundary volcanism
Volcanic activity occurs at two types of plate boundaries: mid-ocean ridges and subduction zones. At mid-ocean ridges, basaltic eruptions produce new sea-floor crust. These underwater eruptions don't produce big mountainous volcanoes, which is why they are often overlooked as the most volcanically active features on Earth. Commonly, basalt is erupted at mid-ocean ridges as blob-shaped "pillows." These pillows form when basalt is suddenly quenched as it comes into contact with sea water. If you cut a pillow in half, you'll find a glassy rind around the outside, where the lava cooled so fast that it couldn't form any crystals. Inside the pillow will be a crystalline matrix of cooled basaltic lava.
Watch this!
Here's a short video clip taken from the Alvin, a submersible oceanographic vehicle, as scientists tried to collect some pillow basalts underwater in the Gulf of Alaska.
At subduction zones, volcanoes are created on the overriding plate as melt from the subducting plate rises up through the mantle and crust. See the map below.
Think about this...
Recall that there are three types of plate boundaries: convergent, divergent, and transform. Volcanism occurs at convergent boundaries (subduction zones) and at divergent boundaries (mid-ocean ridges, continental rifts), but not commonly at transform boundaries. Why not?
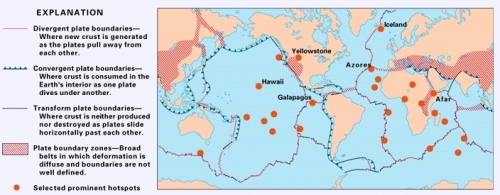
Hot spots (or not)
Hot spot volcanoes occur somewhat randomly around the globe. Their relationship (or lack of one) to the plate tectonic cycle is still being debated. The map below shows several hot spots, but not all the existing ones. In fact, there are over 100 hot spots that have been active sometime during the last 10 million years or so. Notice on the map below that out of the 25 hot spots shown, about 10 occur on top of a mid-ocean ridge. Whether this is a coincidence or not is a current topic of debate among scientists.
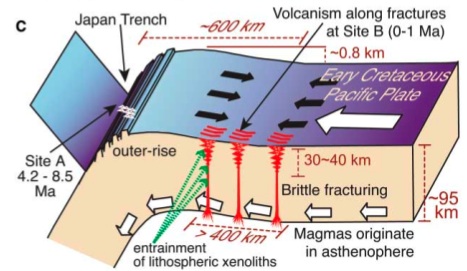
Mantle plumes (hot jets of material that well up from deep in the mantle at a speed of centimeters per year) were proposed as the source of hot-spot volcanoes at about the time of the plate tectonics revolution. Until recently, the prevailing wisdom held that hot spots have a deep source (perhaps as deep as the core-mantle boundary) and that they are nearly stationary with respect to the plates. Geologists, therefore, have used hot spots as an absolute reference frame from which to derive plate motions, and they have studied the geochemical signatures of the lava that has erupted at hot-spot volcanoes as a way to learn something about the composition of the lower mantle. Recent observations of some small young sea mounts east of Japan have initiated a vigorous debate about whether the standard plume model needs to be revised, or maybe even thrown out completely. This particular chain of seamounts occurs away from a plate boundary and the melt is probably coming from a source deeper than 100 km, but researchers who studied the geochemical signature of the lava concluded that the melt cannot have a very deep source, such as the lower mantle or core-mantle boundary. Their hypothesis is that a crack in the plate allowed some partial melt that was present in the upper mantle to rise to the surface and form the sea-mount volcanoes. The schematic diagram below shows their model, which they call "petit-spot" volcanism.
How to Melt a Rock
Myth: The plates are floating on an ocean of liquid magma.
Fact: There is not a giant reservoir of molten rock just hanging out beneath the crust, waiting to spurt to the surface at any available weak spot. The mantle is solid rock. (Remember the lesson about the Earth's interior earlier in this course: If the mantle were a liquid, earthquake S waves couldn't travel through it.)
So where does that lava come from? How do rocks melt? At surface pressures, all you have to do to melt a solid is to heat it up to its melting point. It is true that the temperature rises as you go deeper and deeper into the Earth (15 - 20°C / km is the typical geothermal gradient). However, pressure is also rising as you descend into the Earth, and increased pressure inhibits melting. There are three basic ways that rocks melt to form the lavas that erupt from volcanoes: decompression, addition of volatiles, and conduction. Let's explore each of these in turn.
Decompression
Decompression melting occurs at mid-ocean ridges. When two plates move apart, they create a space that can be filled by hot rock that rises buoyantly from below. As long as this hot rock rises faster than the temperature can cool off, the rock can melt because the pressure is decreasing as the rock gets closer to the surface. See pencast sketch of decompression melting at a midocean ridge! [2]
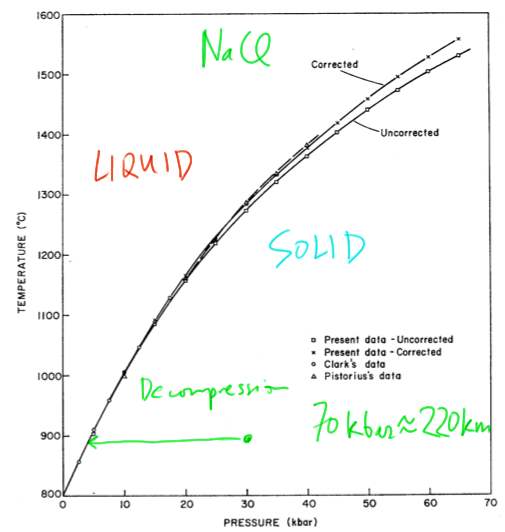
Let's visualize what decompression melting looks like as a plot in Pressure-Temperature space [3]!
You can construct Pressure-Temperature plots to show melting curves for all kinds of substances, not just lava at a mid-ocean ridge. For example, the plot below shows data for table salt. Note that these scientists put temperature on the y axis, and pressure on the x axis. We did it the other way around (and had pressure increasing downwards on the y axis) because we wanted pressure to be analogous to depth in the Earth in our plot.
Volatiles
Rocks melt at a lower temperature in the presence of volatiles such as water and carbon dioxide. How do you get water underneath a volcano? The most common way to do it is to send it down a subduction zone. When a subducting plate sinks under the overriding plate, the water-saturated upper part of the lithosphere goes down, too. As the cold slab sinks, water is forced out and percolates upward into the overlaying hot, dry mantle rock. This sudden addition of water lowers the melting point of that mantle rock, and it begins to melt. See my pencast of this process [4].
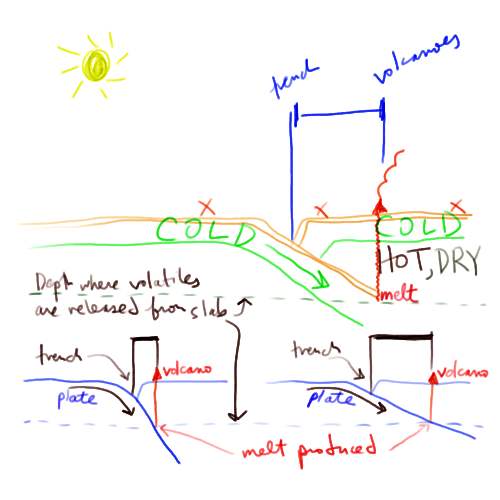
Volatile-driven melting happens at all subduction zones. The melt is generally formed at the point when the slab gets to a certain depth (the depth at which the pressure becomes high enough to force out the water). Pencast of a plot in Pressure-Temperature space for volatile-driven melting! [5] Therefore, you can figure out the angle of subduction (i.e., how steeply the subducting plate is sinking) based on how far the subduction zone volcanoes are inboard of the trench. If the volcanoes are close to the trench, it means the slab is subducting steeply, and if the volcanoes are far away from the trench, it means that the slab is subducting at a shallow angle.
Try this!
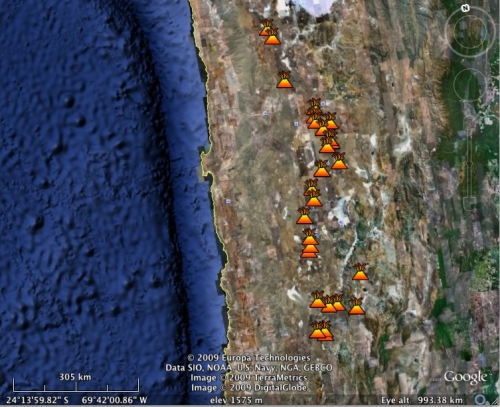
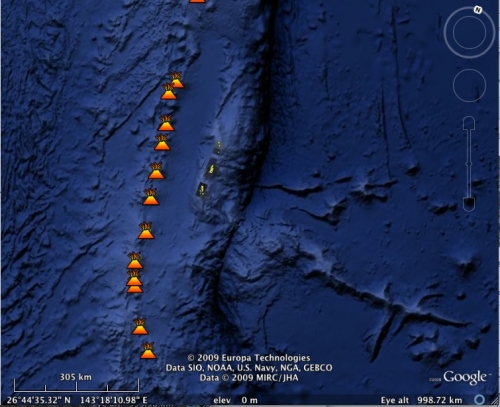
Below are two maps at the same scale showing two different subduction zones. On the top is a subduction zone in the central Andes in South America. The trench is the dark nearly north-south line offshore. The slab is subducting from west to east. On the bottom is a subduction zone south of Japan in the western Pacific Ocean. This slab is subducting from east to west. Note the positions of the trenches with respect to the volcanic arcs associated with each one (the volcanoes are shown by the hokey little orange volcano symbols). Which plate is subducting at a steep angle and which one is subducting at a shallow angle?
Conduction
The third way to melt a rock is by conduction. Conduction is the simplest way to transfer heat. At the atomic scale, hotter particles vibrate more. When they come into contact with other nearby particles, some of that vibrational heat energy is transferred to those nearby particles, heating them up. At the macroscopic scale, when rocks melt by either decompression or by addition of volatiles, the more buoyant melt rises toward Earth's surface. When this rising melt comes into contact with solid lithospheric rock on its path upward, it can transfer enough heat to the surrounding rock to melt it. This often happens in subduction zones as the initial melt created at the slab/mantle boundary travels upward into the rock of the overriding plate.
Different Kinds of Eruptions
Myth: When a volcano erupts, that means lava is coming out of it.
Fact: The statement above is misleading because it is true some of the time but not all of the time. One absolute fact is that lava is never the only product of eruption. And, some eruptions involve no lava at all. There can be a great variety of material ejected from a volcano during an eruption; the most likely ones in addition to lava are ash and gas.
Volcanic products at Kilauea (and some other volcanoes, too)
The discussion below won't be an exhaustive list, but it will give you an idea of the variety of volcanic emissions routinely monitored, collected, and studied by volcanologists. Let's break it down into liquids, gases, and solids because those classifications are easy to grasp, and you will see all of these later on when you work on the problem set concerning volcano monitoring at Kilauea. I have constructed this discussion to use Kilauea's products as the main example.
Liquids: Lava
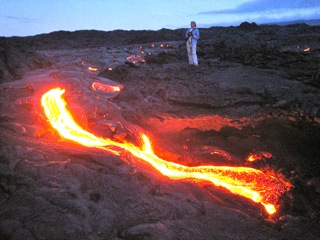
The typical cartoon-style drawing of a volcano is of a mountain with orange lava running down the sides of it. In fact, this mental image isn't really wrong, but it only works for certain types of volcanoes. Lava is the catch-all term for molten rock that extrudes from the Earth and cools at the surface. It can vary in temperature, viscosity, and mineralogic composition depending on the tectonic regime of the particular volcano. Different classifications are given to lavas based on their texture, which tells us about the cooling history of the rock and the amount of silica they contain (which, as you'll recall from the previous lesson, is the primary distinction between different lavas mineralogically).
- Mid-ocean ridges produce basaltic lava, which cools to form the sea-floor.
- Shield volcanoes, such as the Hawaiian Island volcanoes and other ocean island volcanoes, also produce primarily basaltic lava during their eruption. Remember from the previous lesson that basaltic lava has a high melting temperature, a low viscosity, and a low silica content.
- Subduction zone volcanoes often go through a life cycle that involves extruding lava that contains higher and higher concentrations of silica as geologic time goes by. Lava with a high silica content is rhyolite. Rhyolite has a lower melting temperature than basalt, and a higher viscosity. We will discuss the influence of lava mineralogy on volcano morphology a little later on in this lesson.
Gases: Steam, carbon dioxide and sulfur dioxide
Ninety-nine percent of the gas molecules emitted during a volcanic eruption at Kilauea volcano are water vapor (H2O), carbon dioxide (CO2), and sulfur dioxide (SO2). The remaining one percent is made up of hydrogen sulfide (H2S), carbon monoxide (CO), hydrogen chloride (HCl), hydrogen fluoride (HF), and a few others. At Kilauea, gas is monitored daily by scientists who go out and collect the data. The way they do it is to attach an ultraviolet spectrometer to the side of a vehicle and then they drive the vehicle back and forth under the plume. The main thing they are interested in is sulfur dioxide because that gas is really the most noxious. It is the main contributor to "vog" (volcanic smog), it can produce acid rain, and too much exposure to sulfur dioxide has been known to aggravate pre-existing respiratory conditions, such as asthma.
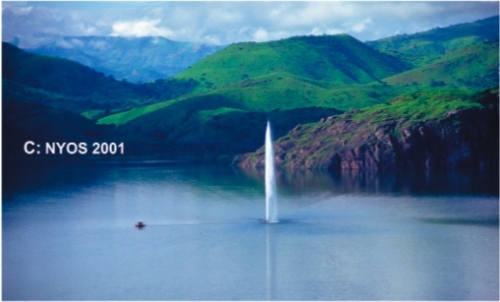
Can an eruption be only gas with no lava at all? Yes, in August 1986, a sudden outgassing of CO2 from Lake Nyos in Cameroon, killed over 1,500 people and hundreds of animals in the valleys surrounding the lake. Lake Nyos is a lake that formed in the caldera of a volcano. If you have seen Crater Lake in Oregon, that is also a lake that filled a collapsed caldera. As CO2 was emitted from Lake Nyos, it flowed down the sides of the mountain, displacing the normal air because CO2 is heavier than regular air, which is mostly nitrogen, N2, with some oxygen, O2, thrown in. (Recall from basic chemistry that CO2 has an atomic weight of 6+8+8 = 22, whereas N2 has an atomic weight of 7+7=14 and O2has an atomic weight of 8+8=16). Carbon dioxide is not poisonous, but if you are breathing it instead of air, you will suffocate quickly. The effect of this outgassing was to quietly put out all the cooking fires and suffocate all the people and animals in the valleys around the mountain. Scientists have disagreed about the exact cause of the sudden eruption of CO2. One camp believes that there was a lot of CO2 dissolved in the bottom water of the lake, and something triggered a sudden overturning of the lake's water, bringing the CO2 to the surface. Others hypothesize that the CO2 was a volcanic outgassing from the seemingly dormant caldera. At present there are efforts underway to keep the bottom of the lake free of too much CO2 in case the first explanation is correct. In your reading assignment below, you will read a paper in which a team tries to use witness testimony from survivors to figure out which explanation is correct.
Reading Assignment
This article is located in our Canvas space:
- Le Guern, F., E. Shanklin and S. Tebor (1992). Witness accounts of the catastrophic event of August 1986 at Lake Nyos (Cameroon) Journal of Volcanology and Geothermal Research, 51, pp. 171-184.
This article is another good example of a multidisciplinary collaboration. The three authors are a volcanologist, an anthropologist, and a Peace Corps worker. They collaborated to piece together interviews from survivors and witnesses of the CO2 eruption at Lake Nyos that killed over 1,500 people in the valleys surrounding the lake. This effort involved translation and also geologic interpretation of the accounts of the interviewees to get a better idea about what happened at Lake Nyos and whether this could happen again.
As you read, contemplate the following questions:
- What two possible causes of the CO2 degassing event are discussed? What is the difference between them and how do the authors propose to distinguish between the two possibilities?
- How did these researchers use the witness testimony as a way to inform scientific thinking?
- At present, there are ongoing efforts to keep Lake Nyos degassed. Based on the conclusions of this paper, will this endeavor reduce the likelihood of future CO2 eruptions, or not?
Solids: tephra
The solids that come out of Kilauea are mineralogically identical to the lava because it's all coming from the same place, made of the same stuff. However, volcanologists differentiate between molten rock that flowed out --lava-- and solid rock that was thrown out, or cooled as it flew through the air, called tephra. You don't have to be an eyewitness to the eruption to tell the difference between what came out as a solid and what came out as a liquid. You can tell by looking at the texture of the rock after it has cooled. For example, a specific class of tephra, called reticulite, is basically the basaltic version of pumice. You can tell it was thrown out in a high-speed froth because it cooled while trapping the evidence of gas bubbles within it. See photo below.
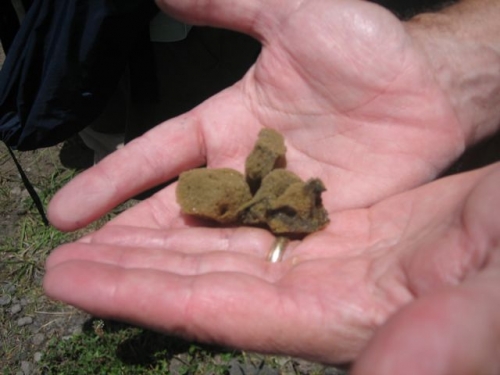
Reticulite (photo above) looks like a sponge and at the sample size above feels nearly weightless in your hand. Does it float like pumice does?
Click here to find out if reticulite does or does not float like pumice does.
In fact, reticulite does not float the way pumice usually does. The reason pumice floats is that its structure is full of mostly unconnected void spaces. The "unconnected" part is the key. If the water can't get into the void space very easily, it can't saturate the rock and the rock won't sink.
Reticulite has such an open structure that water easily permeates the rock, so it will sink.
Volcanic products at other volcanoes
The proportion of solids, liquids, and gases that volcanoes emit depends on mineralogy and the plumbing system. Mineralogy can generally be tied to the tectonic setting of the volcano. In your problem set you will have a chance to compare the products of a variety of volcanoes and discuss these products in terms of tectonic regime. In addition to the general "Kilauea-specific products" discussed above, here is a mostly non-Kilauea volcanic product to know:
Ash and other pyroclastic items
Myth: Volcanic ash is just like the ash that comes from burning wood or paper, except there's more of it.
Fact: Unlike the soft, pulpy, dissolvable ash that fires produce, volcanic ash is solid rock. Volcanic ash fragments can be quite tiny. That's why they can be dispersed a great distance (thousands of kilometers!) through the air and look just like a regular cloud.
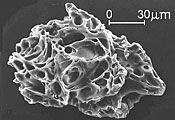
Note the jagged morphology in the photomicrograph of an ash particle from the 1980 Mt. St. Helens eruption. You can also observe the evidence of what were once gas bubbles trapped in the rock.
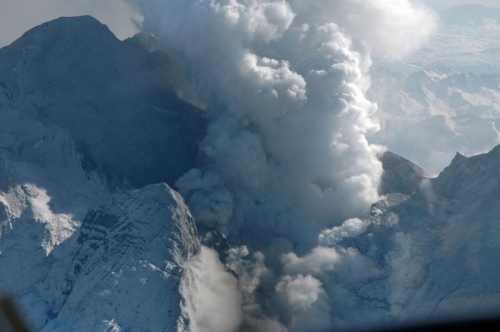
Volcanic ash is formed when volcanoes erupt explosively. When volatiles, such as water vapor or carbon dioxide, are trapped in magma, they want to bubble out and escape. If the lava is too viscous for the bubbles to rise to the surface and escape, the gas pressure inside the magma builds up until the gas bubbles explode, sending magma shrapnel out of the volcano, flying through the air as it cools into tiny ash fragments. During an eruption, as the magma is explosively ejected, pressure is decreased on deeper magma, causing it to quickly rise and follow the same explosive path. Other pyroclastic materials that erupt from volcanoes include blocks (big ones—these can be house-sized), bombs (medium ones—these can be football-sized), and lapilli (small ones—these are pebble-sized). These items are basically classified by size. Given their particle sizes, they don't stay airborne or travel particularly long distances from the immediate area of the volcano. Below is a recent (2009) photo of Redoubt volcano. Note the height of the ash cloud rising from the volcano and think about the fact that although it looks just like a nice puffy cloud, it is actually composed of nasty sharp little pieces of solid rock.
How Big is Big? (Volcanoes)
Myth: Stratovolcanoes (like Mt. St. Helens and Vesuvius) are huge, but shield volcanoes (like the Hawaiian islands), with their gentle slopes, are pretty much flat and not very big.
Fact: Shield volcanoes do indeed have gentle slopes, but these are the hugest volcanoes on Earth.
Shield Volcanoes
"Shield" volcanoes are so named because their shape is reminiscent of a shield lying on the ground with its convex side pointing up. Their widths are much broader than their heights and they have gentle slopes. (Side note here: Don't confuse shield volcanoes with continental shields, which are also named for their shield-like shape. The two don't have anything in common except for their morphology. Continental shields, such as the Canadian shield, and the Kaapvaal craton in South Africa, represent the oldest still-intact blocks of crust from the early history of the Earth.)
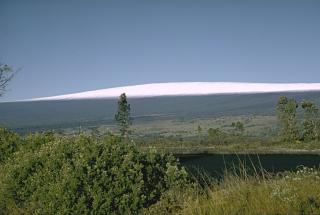
The most obvious examples of shield volcanoes are the Hawaiian Islands. See the photo of Mauna Loa shown here and note the shape of the mountain. The photo almost makes Mauna Loa look like a small, insignificant mountain, doesn't it? Actually, if you start measuring at the ocean floor, which is the real bottom of the mountain, Mauna Loa is 9 km tall, easily taller than Mt. Everest, and much wider. Only the top 4km rises above the water, though.
Shield volcanoes are formed by low-viscosity basaltic lava flows. Because basalt has such a low viscosity, it spreads out in thin sheets and can travel a long way before freezing. Gradually, after many repeated eruptions from a central fissure, a mountain will be formed—one that is much wider at its base than it is tall, but one that has the potential to be quite tall, depending on how long the magma source remains active.
Stratovolcanoes
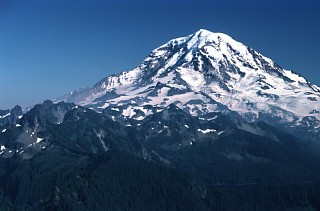
Stratovolcanoes are sometimes also called "composite" volcanoes. They most often form on the continental overriding plate in a subduction zone. The Cascade Range volcanoes are all stratovolcanoes, for example. If you asked a child to draw a volcano, the shape they are most likely to come up with is the conical, steep-sided shape of a stratovolcano. See the photo of Mt. Rainier shown here and compare it to the photo of Mauna Loa above. From the photo, Rainier looks like a bigger mountain than Mauna Loa. In fact, its actual elevation above sea level (4392 m) is higher than Mauna Loa's, but remember that the base of Mauna Loa is really about 5 km below sea level!
Stratovolcanoes are shaped the way they are because they are formed by alternating layers of lava and pyroclastic material, both of which have a higher viscosity, and thus a greater resistance to flow than the basalt-only shields. Stratovolcanoes are more likely to erupt explosively and emit ash and gas. Many subduction zone stratovolcanoes go through a life cycle spanning millions of years in which the composition of their magma changes over time. This change in the mineralogy of the magma leads to changes in the type of eruption and the morphology of volcano itself. At the beginning, mostly basaltic magma erupts. This is because basaltic magma is the original source of magma coming from the volatile-driven melting going on at the top of the subducting slab under the subduction zone. As this basaltic magma continues to be produced by more and more lithosphere going down the subduction zone, it begins to melt some of the overlaying continental crust by conduction. This new addition to the magma generally has a higher concentration of silica in it because continental crust is more enriched in silica than oceanic crust. The addition of silica lowers the melting point of the magma and also increases its viscosity. So, now the eruptions will be more explosive, involve ash and pyroclastic debris, and stratovolcanoes will form. Next, the magma chamber will be highly silicic, quite viscous, and can erupt in a huge caldera-forming event. Finally, whatever is left of the magma body slowly cools, forming little resurgent domes, hot springs, and at the end, great bodies of intrusive igneous rocks such as granites. Below is a cartoon sketch of this cycle.
Think about this!
Can you tell what part of the caldera cycle Mt. Rainier is in right now? Think back to the previous lesson. What part of the caldera cycle is La Primavera in right now? Is there any evidence from earlier stages of La Primavera's cycle in the geologic maps of Mexico that we looked at?
How Big is Big? (Eruptions) and Problem Set, part 1
Myth: The eruption of Mt. St. Helens in 1980 was enormous! Just huge!
Fact: The 1980 eruption of Mt. St. Helens wasn't even close to some of the biggest eruptions in human recorded history as measured by the volume of ejected material. Compared to some prehistoric eruptions, it was actually pretty small.
In the following problem set, you will use data from the VOGRIPA program, which is run by the British Geological Survey, to compare some past eruptions of various volcanoes. There are two main questions to ask when comparing eruptions:
- How much material was erupted? and
- How explosive was the eruption?
These, and others, are the questions you'll answer in this problem set.
Problem Set
Directions
NOTE:
For this assignment, you will need to record your work in a word processing document. I'm not giving you a worksheet this time. It is up to you to construct your own document.
Go to the main page of the Volcano Global Risk Identification and Analysis Project (VOGRIPA) [6]. Find information about the eruptions for the volcanoes listed below. You can find each of these volcanoes by using the SEARCH tab. When you click the SEARCH tab you will get taken to a new page. Just scroll down a little way down the page and type the name of the volcano in, don't change anything else, then press the Submit button. Some volcanoes in my list have lots of documented eruptions. I've given you the dates of the ones I want you to look at.
- Sierra la Primavera (95,000 BP)
- St Helens (1980)
- Kilauea (1790)
- Eyjafjallajökull (2010)
- Pinatubo (1991)
- Vesuvius (79)
- Krakatau (1883)
- Tambora (1812)
- Fernandina (1968)
- Redoubt (1989)
- Toba (74,000 BP)
Make some kind of a table to store useful information about these eruptions. Specifically you will want to know the type of volcano, the composition of the eruption, the eruption magnitude, and the bulk volume.
Answer these follow-up questions:
- Which eruption in this activity was the largest in terms of explosivity and which was the largest in terms of volume?
- Where does the 1980 eruption of Mt. St Helens rank among all the eruptions in this activity? How about the 79 AD Vesuvius eruption? Are you surprised by these results?
- Describe the correlation (if any) between the type of volcano and the magnitude of its eruptions.
- Which volcanoes in this activity are the most active in terms of the numbers of number of confirmed eruptions?
- You may have to look at a map for this one. Can you tell which volcanoes are hot spot volcanoes and which ones are subduction zone volcanoes? What are the clues besides looking at a map that will tell you.
- Discuss whether there is a relationship between type of lava, magnitude of eruption, and volume of eruption for the volcanoes in this exercise. Feel free to supplement with other volcanoes if it helps to make your point. Figure out how to make a plot that illustrates your point. I know that I'm asking you to compare three things: composition, magnitude, and volume, but spend some time thinking about how to visualize their relationship. Post to Questions if you are stuck. It also may help to refer back to lesson 5 in which we discussed the characteristics of different types of lava and their compositions and viscosities relative to each other.
Submitting your work (not yet -- there's a part 2)
Save your word processing document as either a Microsoft Word or PDF file in the following format:
L6_eruptions_AccessAccountID_LastName.doc (or .pdf).
For example, former Cardinals manager and hall of famer Red Schoendienst would name his file "L6_eruptions_afs2_schoendienst.doc"
Hang on to your document because you will need it for part 2 of this problem set.
Grading criteria
I will use my general grading rubric for problem sets [7] to grade this activity.
How Long does an Eruption Last?
Myth: Volcanoes are dormant for a very long time, suddenly erupt, and then become dormant again.
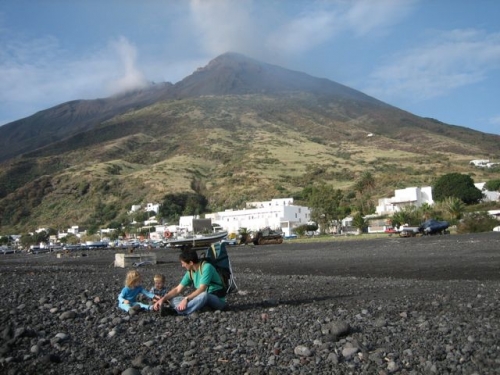
Fact: There are a wide variety of eruption lengths. Stromboli volcano off the coast of Italy has been erupting more or less continuously for over 2000 years! Other volcanoes have eruptions that last less than a day. According to the Smithsonian Institute's Global Volcanism Program, the median length of time for a single eruption is seven weeks.
There are two timescales of interest where erupting volcanoes are concerned:
- How long does a volcano stay active and what controls this? and
- How long does a single eruption last and what controls this?
The main factor controlling volcanic activity in an area is the timescale over which melt is produced. For example, in a subduction zone setting, volcanism goes on for as long as the subduction zone is active. Remember, from a couple of pages ago, the overall timescale for the lifetime of a caldera. Subduction is a process that generally lasts for millions of years. It shuts off when an entire plate has disappeared, or something causes the plate to change its direction so that it is no longer subducting. For an ocean island volcano, the timescale for activity is the lifetime of the mantle plume or other source of melt.
For a single eruption, the controlling factor is the volume of melt present in the magma chamber and the degree to which the magma chamber is over-pressurized. An eruption will usually last until the local melt has been depleted, or until the gas pressure inside the magma chamber falls to a level at which gas is no longer trying to escape. Certainly this is a fairly simplified overview. The internal plumbing of a volcano can be quite complicated, though recent monitoring efforts involving GPS, local seismometers, and tiltmeters are getting better and better at capturing the size, depth, and activity of magma chambers under active volcanoes.
Hawaiian Volcano Monitoring
The Volcanoes Exploration Program at Pu'u O'o
VEPP was a project funded by NASA [8], implemented by USGS [9], and supported by SOEST [10] at the University of Hawai‘i at Mānoa [11]. The project lasted for about 5 years from 2010-2015. The project goal was to make available a subset of volcano monitoring data from the Hawaiian Volcano Observatory [12] (HVO) for educational purposes. The Web site—with data streams from the Hawaiian Volcano Observatory [12]—provided a means for students to experience and interpret current volcano-monitoring data.
The blurb above was cribbed directly from the now-sunsetted Volcanoes Exploration Program at Pu'u O'o web site and explains the point of the project. Even though the project is over we are still able to use its data for the second part of the problem set in this lesson.
The data provided by the VEPP program comes from the Pu'u O'o vent, which is on the east flank of Kilauea, so it represents just a subset of the many monitoring activities of the Hawaiian Volcano Observatory. See the map below to find the location of Pu'u O'o. It is one of the vents in the East Rift zone, the source of most of Kilauea's recent lava flows.
Instrumention
There are a variety of different instruments installed around Pu'u O'o to track what the volcano is doing in real-time. The general purpose of these measurements is to alert the scientists who receive the data about whether an eruption is imminent. This goal is worthy enough, but there is also the overarching scientific goal of getting a better understanding of how the plumbing system of a volcano works in the short-term and in the long-term. Here is a list of the types of instruments that record the data we'll explore, and a brief description of each one.
Tiltmeters
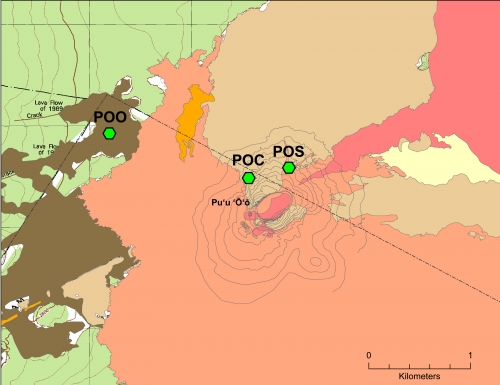
Tiltmeters are installed to measure any change in the angle of the ground with respect to horizontal. The goal is to make an observation of any bulge or inflation of the ground around a vent, which could be indicative of rising magma. Once an eruption has begun, tiltmeters can also measure deflation as the source of the eruption escapes from the ground. Below is a map of the three tiltmeters installed at Pu'u O'o. The Hawaiin Volcano Observatory (HVO) [13] web site also has some detailed information about tiltmeters and what their data look like.
GPS stations
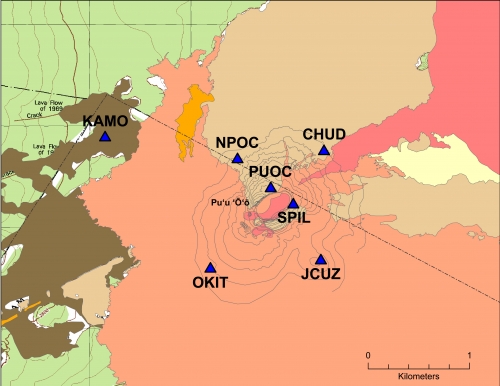
Pu'u O'o has a network of seven GPS stations (see map below) that continuously monitor the location of each station to within several millimeters by recording signals from orbiting satellites. You will recall from the New Madrid lesson in Earth 501, that GPS stations are routinely used to monitor the movement across faults and to confirm the magnitude and direction of plate motions inferred from magnetic sea-floor anomalies. At active volcanoes, GPS data is used to keep track of any surface deformation of the volcano. The HVO [13] website also has some more detailed i [14]nformation about GPS stations and some examples of data from them.
Seismometers
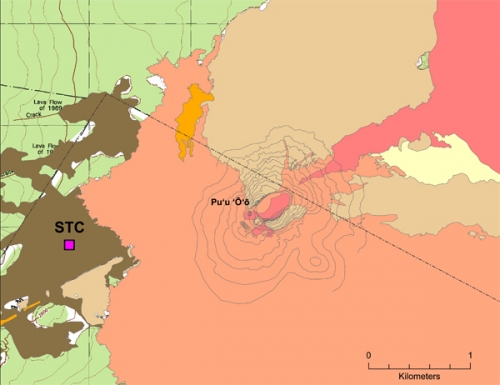
Pu'u O'u has two seismometers, located in the same place (see map below), but measuring different frequency bands. One of them is a "short-period" seismometer, which is sensitive to higher frequencies, such as the harmonic tremor that is often associated with the movement of magma at active volcanoes. The other seismometer is a "broadband" instrument, which is sensitive to a wider range of frequencies than the short-period instrument, and to generally lower frequencies. Broadband seismometers are installed all over the world to monitor ordinary earthquakes, but short-period seismometers are usually only for measuring what is going on in a small locality. If you want to see recent earthquakes recorded in Hawaii, you can check out HVO's seismicity map [15].
Webcams
Pu'u O'o has two webcams that each take a snapshot every few minutes. One of them is mounted on the north rim of the crater and looks southward into the crater. The other one is installed on the southeast flank of Pu'u O'o. It looks east across the currently active vent.
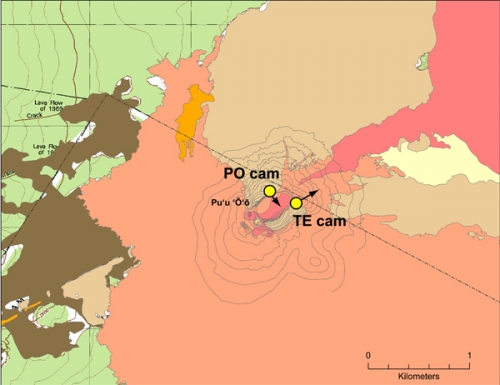
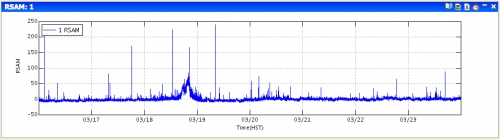
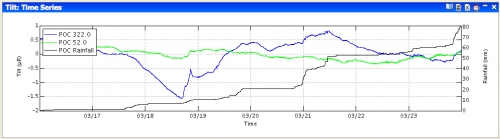
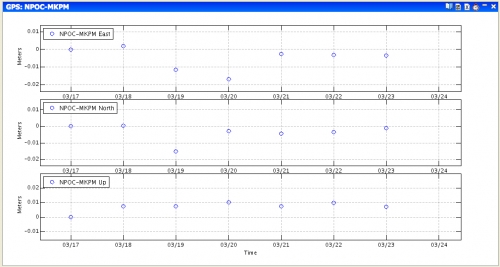
An example of an Inflation-Deflation event recorded at Pu'u O'o and how I made these plots
The three plots below show seismic (top), tilt (middle), and GPS (bottom) instrument records for 17-23 March 2009 at Pu'u O'o. I found this event by searching month-by-month using the software package the HVO scientists use, which used to be available to educators when the VEPP project was going on. I looked for distinctive jumps in the seismic amplitude data. Once I found one, I looked to see if it correlated with a tilt and GPS signal. The data depicted in these plots tell us about the behavior of the volcano's inner workings.
RSAM (seismic) data
Tilt data
GPS data
Eruptions problem set, part 2
The following is a problem set that will allow you to explore the various monitoring datasets that are used at Kilauea volcano. I am more interested in you being able to get a grasp of what instrumentation is deployed, what it measures, why it is important, and how the various measurements work together to give scientists a picture of the overall state of the volcano. I am less concerned with you being able to define each bump and wiggle that you might see. So think big picture when you look at the tilt, rsam, and gps data.
Kilauea Volcanism Problem Set
Directions
The goal of this problem set is for you to:
- read a report detailing recent eruptive activity at Kilauea volcano.
- predict hypothetical instrument responses to certain volcanic activities
- calculate the rate of magma movement based on measured seismicity
- use tilt, GPS, and RSAM data to describe an eruptive event at Kilauea.
Part 1, reading and questions
Read this paper, available in our Canvas space. This paper is a report of some sustained eruptive activity that occurred on Kilauea and its East Rift Zone during the summer of 2007. The activity was recorded by a wide variety of geological, geophysical, and geochemical monitoring instruments, the details of which are discussed in the paper. If you are unfamiliar with any or all of the types of instrumentation described, this paper may seem dense. My advice when reading is to try to focus on the space-time sequence of events, rather than the specifics of the instrumentation. In addition, you may want to go back one page in this lesson to refresh your memory of what each type of instrument measures. Perusing my follow-up questions first will help focus your reading.
Poland, M., A. Miklius, T. Orr, J. Sutton, C. Thornber, and D. Wilson, 2008. New Episodes of Volcanism at Kilauea Volcano, Hawaii, Eos 89, 37-38.
Answer the following questions. Append them to the same document you started for the eruptions problem set that dealt with the VOGRIPA database.
Questions:
- Look at Figure 2 of Poland et al., 2008. Find the summit caldera. Find the three instruments UWE, UWEV, and AHUP. UWE is a tiltmeter. UWEV and AHUP are GPS stations. If the summit were inflating with magma, would you expect UWEV and AHUP to get closer together or farther apart? Why? If the summit were inflating, in what direction would UWE tilt? Why?
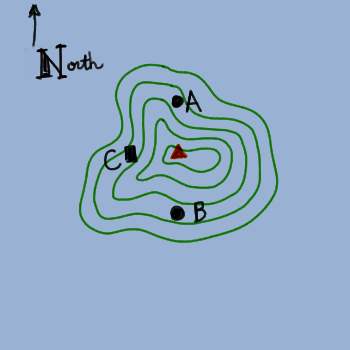
- This question is just hypothetical! It is not directly related to the paper you read. Draw a sketch of the expected signal during a hypothetical summit caldera inflation and subsequent eruption. The blue sketch below shows the hypothetical caldera for this problem. A and B are both GPS stations and C is a tiltmeter. The triangle is the caldera summit. On the blank axes, time is on the x axis and distance is on the y axis for the GPS signal. Time is on the x axis and angle is on the y axis for tilt. The vertical dotted lines mark the beginning of caldera inflation and the beginning of the eruption. To make your drawing, you can use the simple drawing tools associated with your favorite word processing program, or just draw it by hand, take a picture of it, and insert it into your document. I am not looking for correct units, this is just a sketch.
- Calculate magma flow speed based on earthquake locations given in the bottom panel of Figure 3B of Poland et al., 2008. Speed should be calculated over the time period spanned by the episodes labeled T1 - T5. Note the scale bar of 1 km given in the lower corner of the plot. When you write your answer to this question, please lead me through your logic. You will have to make some choices about how to estimate times and distances, and I want to hear your explanation of how you chose to do this.
Part 2, analyze and interpret real data from the 2018 eruption at Kilauea
The Hawaiian Volcano Observatory continuously monitors both the Kilauea summit and the Pu'u O'o vent to the east with a variety of geophysical instrumentation. Their Deformation Data [16]page explains how to interpret deformation plots in light of what the volcano is doing.
There was an eruption that began in May 2018. I want you to use GPS, tilt and seismic data to describe it. This is part of the real fun of using real scientific data that hasn't been sanitized for "educational purposes"! Post to the Questions discussion board if you get stuck!
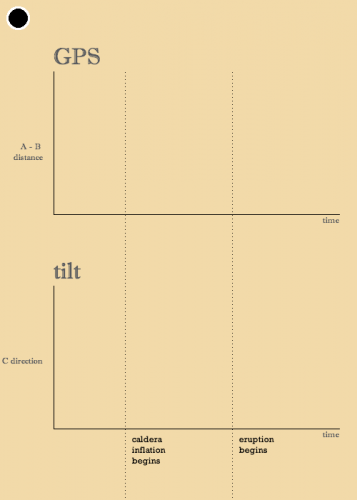
Below is a map of instrument locations. Use it to answer questions 1 and 2. For more detailed maps, refer to the maps on the previous page.
- The tilt stations are UWE and POC. Where are these two stations relative to the summit and the Pu'u O'o vent? If the magma chamber under the summit were inflating, describe what each tiltmeter would be doing.
- The GPS data from Pu'u O'o is plotted as the distance between the two stations PUOC and JCUZ. Where are those two stations in relation to the Pu'u' O'o vent? Would they be getting farther apart, closer together, or staying the same distance apart if the magma chamber under Pu'u O'o were inflating?
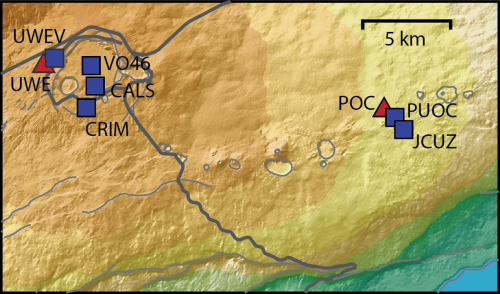
 Map of earthquakes near Kilauea from July 2017-July 2018USGS
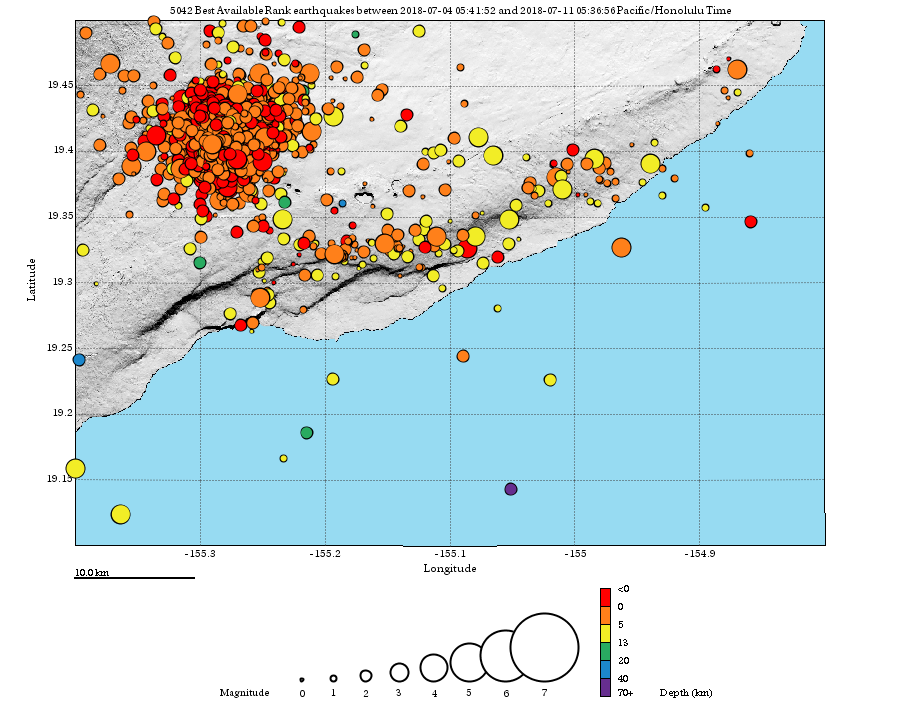 Map of earthquakes near Kilauea from July 4 - July 11 2018USGS
 - Look at the maps of earthquake locations above. The top map is a year's worth of locations, and the bottom is just for a single week in July 2018. Describe in a few sentences the differences and similarities between them. Obviously there are a lot more earthquakes over a year as opposed to a week, but can you see any changes in where earthquakes tend to locate?
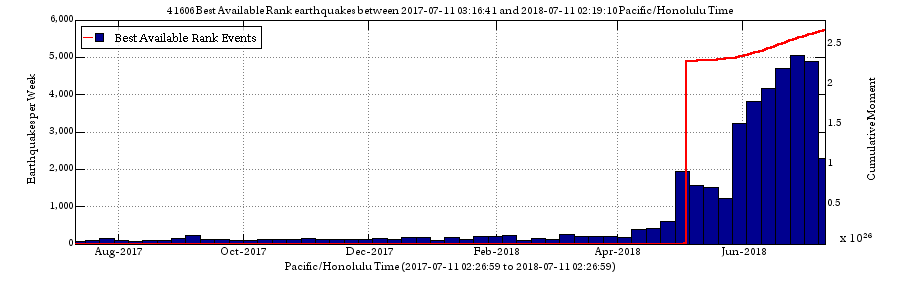 Earthquake counts per week at Kilauea from July 2017 - July 2018USGS
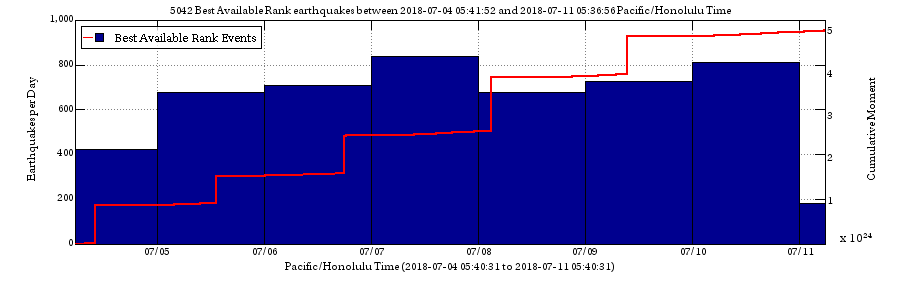 Earthquake counts per day at Kilauea from July 4, 2018 - July 11, 2018USGS
 - The two plots above show earthquake counts (blue bars) and cumulative moment (red lines) for a year (July 2017-July 2018) and for a single week in July 2018. When during the year-long interval did the seismicity per day begin to increase? Look at the plot of amount of seismicity over the week-long interval and determine whether seismicity has increased, decreased, or stayed about same with regard to the peak seismicity over the year-long interval. Pay attention to the y axis scale because the year-long plot is counts per week, whereas the week-long plot is in counts per day.
- There was a magnitude 6.9 on May 4 that is the single biggest jump in the red line on the top plot of cumulative moment release. Find it on the seismic locations map and tell me its approximate location (lat, lon). Hint: it's orange, and it isn't shown on the week-long seismic locations map because it happened before that week.
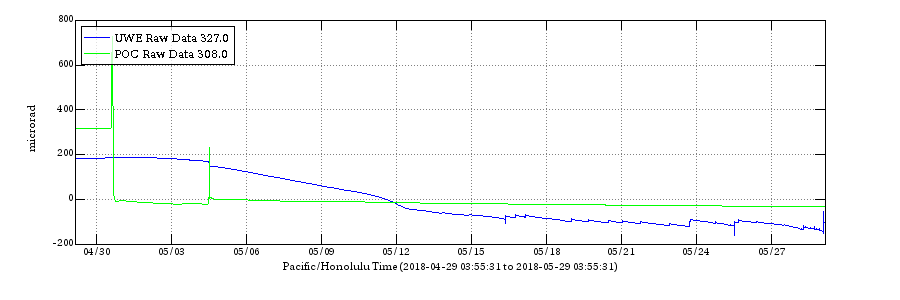 Kilauea summit and Pu'u O'o tilt from April - May 2018USGS
 - Now let's take a look at the tilt data. What time period does the plot above cover? Go back and read your own answer to question 1 in this problem set and use it to describe what is probably going on underneath each instrument over this time period. For example, is the magma chamber inflating or deflating? Is there steady behavior or little jumps that indicate unrest at the volcano?
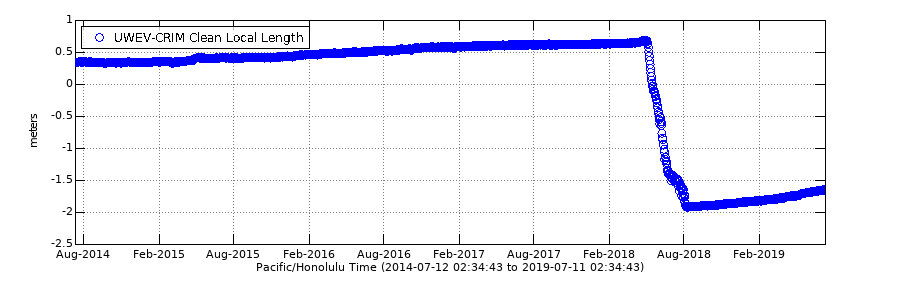 Length change across Kilauea summit recorded by GPSUSGS
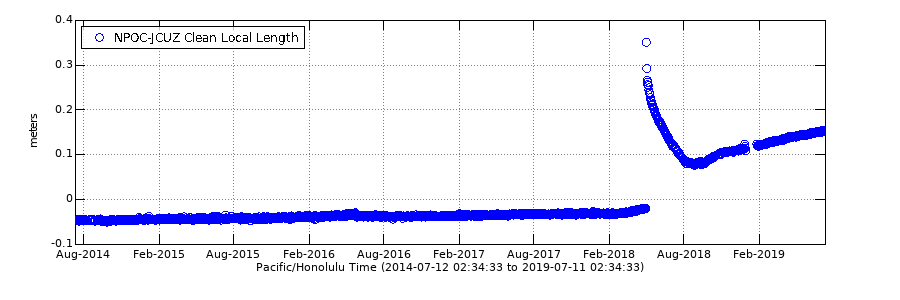 Length change across Pu'u O'o vent recorded by GPSUSGS
 - Onto the GPS data! What is the approximate rate of change of the distance between CRIM and UWEV between August 2014 and August 2017. What I am asking you for is a velocity. Are the two stations getting closer together or farther apart, and how fast is this happening? Pay attention to the units.
- What is the amount of change between CRIM and UWEV from approximately May 2018 to August 2018?
- Describe what is happening between CRIM and UWEV post August 2018.
- Describe what happens between NPOC and JCUZ (NPOC is co-located with POC on the map) between August 2014 and February 2019. How is the GPS data different at the summit as opposed to Pu'u O'o regarding the 2018 eruption?
- When did the 2018 eruption end? Check out the current alert status at Kilauea [17] to find out.
Submitting your work
Upload the document containing both your earlier work from VOGRIPA and the work you just did with Kilauea to the eruptions problem set assignment in Canvas by the due date specified on the first page of this lesson.
Grading criteria
I will use my general grading rubric for problem sets [18] to grade this activity.
Teaching and Learning II
For this activity, I want you to reflect on what we've covered in Lessons 5 and 6 and to consider how you might adapt these materials to your own classroom. Since this is a discussion activity, you will need to enter the discussion forum more than once in order to read and respond to others' postings. This discussion will take place over the week devoted to lesson 6.
Submitting your work
- Enter the Teaching and Learning II Discussion Forum.
- Post your ideas about how the materials we covered in the past two lessons might be adapted to your own classroom.
- Read postings by other EARTH 520 students.
- Respond to at least one other posting by asking for clarification, asking a follow-up question, expanding on what has already been said, etc.
Grading criteria
You will be graded on the quality of your participation. See the grading rubric [19] for the specifics about how this assignment will be graded.
Additional Resources and Bibliography
Additional Resources
Web sites
- Eruption of Stromboli Volcano from NASA's Visible Earth Project [20]
- USGS Volcano Hazards site [21]
- Alaska Volcano Observatory [22]
- Hawaiian Volcano Observatory [12]
- Yellowstone Volcano Observatory [23]
- Cascades Volcano Observatory [24]
- Volcano Resources for Educators (USGS) [25]
- Volcanic Gas Hazard Monitoring at Kilauea (National Park Service) [26]
- Encounters of aircraft with volcanic ash clouds: a compilation of known incidents, 1953-2009 [27]
- Global Volcanism Program of the Smithsonian Institute [28]
- World Organization of Volcanic Observatories [29]
Papers
- Kauahikaua, J. and M. Poland (2012). One Hundred Years of Volcano Monitoring in Hawaii, Eos 93, pp. 29-30.
Bibliography
Akella, J., Vaidya, S. N., & Kennedy, G. C. (1969). Melting of sodium chloride at pressures to 65 kbar, Phys. Rev., 185, pp.1135-1140.
Fisher, R.V., Heiken, G., & Hulen, Jeffrey B. (1997). Volcanoes: Crucibles of Change. Princeton University Press, p.317
Halbwachs, M., et al. (2004). Degassing the "Killer Lakes" Nyos and Monoun, Cameroon. Eos, 85, pp.281, 285.
Hirano, N., et al. (2006). Volcanism in Response to Plate Flexure. Science, 313, pp.1426-1428.
Tell us about it!
Have another reading or Web site on these topics that you have found useful? Share it in the Teaching/Learning discussion!
Summary and Final Tasks
In Lesson 6 we covered some topics about erupting volcanoes with an eye towards dispelling some common myths about them. I chose the particular myths in this lesson by asking my non-Earth-scientist friends what they thought about volcanoes.
Reminder - Complete all of the lesson tasks!
You have finished Lesson 6. Double-check the list of requirements on the Lesson 6 Overview page to make sure you have completed all of the activities listed there before beginning the next lesson.
Tell us about it!
If you have anything you'd like to comment on, or add to, the lesson materials, feel free to post your thoughts in our Teaching/Learning discussion. For example, are there other common misconceptions your students or other people you know have about volcanoes?