Calculate plate motion using GPS data
Determining plate motion: displacement
How far and in what direction did station BBRY move between since January 2004 and March 2011? This is a reasonable question to ask because it helps us determine strain rate in the crust.
The way to do it is:
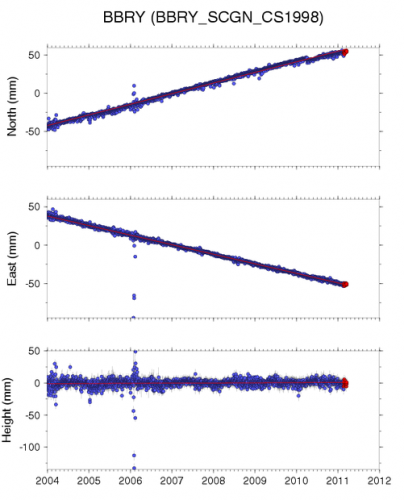
- Observe each of the three components of the time series data and measure the displacement for each one. In the time series plots, each blue dot is a verified measurement, the red dots are the most recent measurement that probably have not yet been checked for accuracy, and the red line is a linear best fit line (done by a computer program) to the data.
- Then, add the three components of motion.
That's all! But there's a small wrinkle. The motion is happening in three-dimensional space. We need to use vector addition to get the right answer. This sounds fancy, but we just need to remember the Pythagorean theorem. Maybe you've only used this theorem to find the hypotenuse of a right triangle, but it works nicely in three dimensions, too:
north2 + east2 + vertical2 = total2
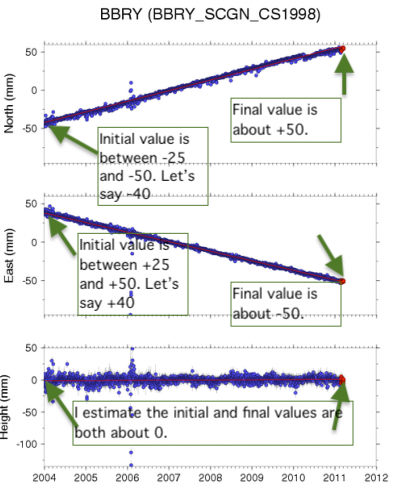
If you wanted greater accuracy, you should get the actual data for a station, instead of just visually estimating from a plot, but for our purposes here, estimation is going to be good enough. So let's do it. The north component has gone from -40mm to +50mm, for a total of 90mm north. The east component has gone from +40mm to -50mm for a total of 90mm west. (WEST! because negative East is West). The vertical component looks like it hasn't changed. Let's assume the vertical motion is zero, so neither up nor down over this time period.
We can use the Pythagorean theorem to get the answer:
902 + 902 +02 = total2
8100 + 8100 + 0 = total2
16200 = total2
sqrt(16200) = total
127.28mm northwest is my answer. I probably shouldn't keep two places past the decimal given how cavalier I was about my initial observations from the plot, so let's round to a whole number. BBRY moved about 128 mm northwest between January 2004 and March 2011.
Determining plate motion: velocity
What was the average velocity of BBRY between January 2004 and March 2011? We already have all the information we need to make this calculation.
velocity = distance / time
We know the distance because we just calculated that. What about time? Here's something fun about geodesy: The convention is to divide up a year into 10 equal parts instead of using months, or days. Months are all different lengths, so this way of doing things makes calculations easier. See how each year on the x axis has 10 little tick marks on the plot of BBRY that we've been looking at. What time span is covered by the data in the plot? It goes from the beginning of 2004 up to about the second tick mark after the beginning of 2011. So let's call that 8.2 years.
velocity = 128mm / 8.2 years
velocity = 15.61mm/year
Once again I don't think we should keep so many digits after the decimal. We can't justify that level of precision. Let's round and say BBRY has moved at a rate of about 16 mm/year northwest. Now we could look up what an "accepted value" is for how fast various plates move and compare our calculations to those. We'd need to look at a map and make sure we know which plate BBRY is sitting on.
This kind of calculation verifies the calculations you did back in Lesson 3 with Fred Vine's data from the 1960's, which is cool!!