Lesson Overview
The atmosphere is a complex portion of the Earth system that greatly influences Critical Zone processes. It should be clear to you now that a wide range of climate states have existed in Earth history that fall outside of the realm of human experience. Further, you now know that these climates of the past—paleoclimates—provide us with great insight into present-day atmospheric processes and that paleoclimatic variations led to changes in Critical Zone processes of the past.
In Lessons 3 and 4, you studied modern and ancient atmospheric processes at a planetary scale. In Lesson 5 you will further explore predictive modeling of future climate change and what our best scientists and computer models predict will happen to atmospheric carbon dioxide levels, temperature and precipitation, storms, and sea level in Earth's not-too-distant future
Watch these Videos!
To better understand some of the very basic general concepts of climate modeling, I will take advantage of the nearby presence of my colleague Dave Pollard, an internationally known paleoclimate modeler and co-author of the GENESIS global climate model (GCM). Dave's depth and breadth of knowledge of computer codes, GCMs and paleoclimate will be obvious as you watch the series of videos we created and will help you to better understand and digest the readings I have assigned in this lesson.
Video: Part 1: Meet Dave Pollard (02:50)
See Transcript: Meet Dave Pollard
TIM WHITE: Hello. Welcome to my office. Perhaps now when you're communicating with me you can imagine this is where I operate from. But we're really here today because a colleague and neighbor of mine, Dave Pollard, is a paleoclimatologic modeler, and so we're going to go over to Dave's office and have a little conversation with him.
Hey Dave.
DAVID POLLARD: Hi, Tim.
TIM: How you doing?
DAVID: Fine.
TIM: You have a couple minutes to have a chat?
DAVID: Sure. Come on in.
TIM: Thanks. So when did you start climate modeling?
DAVID: I first started the simple climate modeling in grad school. I did a simple couple glacier ice sheet model of the Pleistocene ice ages. And that's when it started.
TIM: And then your post doc?
DAVID: I did a post doc in Oregon State, and I worked on-- for the first time there-- on global climate models. The big, complex, global models that Larry Gates used then. Applied to the quaternary ice ages. I later worked for NCAR, which is in Boulder, Colorado. It stands for the National Center for Atmospheric Research. They do a lot of different things there. The division I worked in was called climate and global dynamics, which mainly developed community climate global climate model that people use a lot in the United States and internationally for paleoclimate and modern and future climate modeling.
TIM: And I suppose it was at that time you created or coded Genesis?
DAVID: While I was there, my group decided to develop a global climate model specifically aimed at the paleoclimate modeling community, and so we built GCM, which stands for Global Climate Model, or General Circulation Model, and we called it Genesis. And that was in the 1980s and 1990s, and quite a lot of paleoclimate modelers used it at that time. In the late 1990s, I moved to Penn State. There was a dynamic group here led by Eric Baron at the time doing a lot of paleoclimate modeling work, and I joined that. And since then, I've worked here on Genesis climate model and also a lot on ice sheet modeling, which maybe we'll talk about a little later.
Video: Part 2: Modelling Climates (05:25)
See Transcript: Modeling Climates
TIM WHITE: You've used the term climate modeling quite a bit in describing yourself, so maybe this is a good time to tell us-- from your perspective, what is climate modeling?
DAVID POLLARD, Sr. Research Associate, Earth and Environmental Systems Institute: Well, climate modeling, and in particular global climate models, are really large computer codes. They're quite like the codes that are used for weather forecasting by the National Weather Services. But they're simplified a little bit so that they can be run instead of over a few days where you're interested in really getting the weather right tomorrow in the next four or five days so that you can run them over 10 years if you like or 100 years to get a projection of the average climate. They still have all the storms and the weather events in them simplified a little bit so they're efficient enough to run for those long-time scales.
And the other thing that's different about them is that they have a lot of other components. They're coupled to other things that interact with the weather over that time scale like snow. The thickness of snow, the temperature and amount of moisture in the soil, oceans, the effect of vegetation. That sort of thing.
How Do Climate Models Work?
Some things you have to just prescribe from observations, but then a lot of it is in the physics of the equations themselves. The things you prescribe are the amounts of sunlight coming in at the top of the atmosphere, which is determined from the current orbit the seasonal cycle of the Earth around the sun. The amount of carbon dioxide and other gases in the atmosphere. The types of vegetation that distributed around the globe.
That sort of thing. And then, when you run the model, just about everything else that you can think of to do with the weather is predicted from the equations. Air speeds, temperatures, humidities, they're all in the physics.
Climate Models and Soil
TIM: Do soils play a role in the models?
DAVID: Yes. For global climate modeling, you generally have a model of the top few meters of soil, which includes most of the critical zone. Not ground water, but the upper soil layers, which includes the seasonal cycle of temperature going down to about a meter. And what these models predict in the physics is the soil temperature and the soil moisture. The amounts of water in the pores.
TIM: And what about surface water like lakes or rivers? Are they in the model?
DAVID: Usually not explicitly. You don't predict river flow, for instance. You're not going to get the speed of the Mississippi current, but what is predicted is the local runoff averaged over soil areas. And then what you can do from that is deduce the average river output integrated over the whole Mississippi basin, for instance. And lakes are just prescribed, usually.
TIM: What about ice?
DAVID: Well, there's the seasonal snow pack coming and going, how it melts in the spring and then forms in the fall and winter, is predicted from the amounts of snowfall falling from the atmosphere. And sea ice is also predicted, which is of interest recently, because of the rapidly receding cover in the Arctic, for instance. That's included in these climate models when they apply it to the future.
But the big ice sheets, like Greenland and Antarctica today, they're prescribed. Those time scales of the variations of thousands to tens of thousands of years and these global climate models can only be run realistically, with computer power that we have for decades or a few hundred years at most at a time. So you have to prescribe these long-term features like ice sheets.
Computer Power & Coupled Modelling
Coupled modeling, which I do quite a bit, where you use tricks, really, to run these global climate models only for a few decades and then couple them to separate models of the ice sheets where you can try and then run just the ice sheet model over thousands, ten thousands, or even millions of years to predict their variations in the past.
Video: Part 3: Modelling Modern & Ancient Climates (06:00)
See Transcript: Modelling Modern & Ancient Climates
TIM WHITE: You've told us a lot about climate modeling in general, and you've alluded to some of your work in paleoclimate modeling. And I wondered if you could perhaps tell us a little bit more about some of the differences between modeling ancient climates and modern climate.
DAVE POLLARD, Sr. Research Associate, Earth and Environmental Systems Institute: Sure. You actually use the same physical model, which is a good thing. You want to use exactly the same physics in the model, be it just the general circulation model, as works for the present. And just shift that and apply that to the past. But to do that, the main thing you have to do is to change the boundary conditions.
Then that means the layouts of the components as they varied very much, if you go far back, due to plate tectonics. The amounts of carbon dioxide in the atmosphere, which could be four times, eight times, or more if you go back to the Cretaceous, say, 100 million years ago. Then if you're interested in orbits, and Milankovitch orbital perturbations over the ice ages, for instance, you set different orbital parameters. The eccentricity, the precession, and obliquity of the Earth around the Sun.
So there's a handful of those things, about four or five changes to the external boundary conditions, that you impose on the GCM. And then you simply run it, just like you would for the present, except you're simulating the climate 100 million years ago, say.
How are Ancient Climate Models Relevant Today?
So do these paleoclimate simulations have any relevance to the future and to society's concerns? And I think the answer's definitely yes. We're about to enter, in the next few centuries to millennia, unprecedented increases in greenhouse gases, which are going to warm the climate tremendously.
Now, we can attempt to just model that with models based on the present day, but if we can go back in the past to when greenhouse gases were the same levels as we anticipate, two to three to four times what they are today, that gives us an analogy. And just a means of testing the models to see if they're doing the right job for the past. And then we'll have more confidence for them in the future.
For instance, the last time that greenhouse gases were three to four times present-day amounts was in the-- before about 40 million years ago. 100 million to 40 million years ago. And we can simulate those conditions and compare with paleoclimate data that we have for those periods and see if the models are doing a reasonable job.
Another example concerns parts of the present-day ice sheets, for instance, West Antarctica and also Greenland. And it's quite hard to model those. But we've coupled ice sheet and climate models to see if they are vulnerable if they're in danger of totally disintegrating, for instance, in the case of West Antarctica, in the next 1,000 years due to increases in ocean and air temperatures caused by humans. But we can look in the past to see if those parts of the ice sheets have collapsed or not. And when they have, what were the climates that caused that, and try to simulate those with our coupled models.
Another great thing about these models is helping to communicate to the public what's really going to happen. The three-dimensionality of them means that you can make nice graphics and animation, and also run them forward in time to produce movies. And that sort of visual has a big impact and potency for the public to really see what might happen.
For instance, we can run these ice sheet models and watch the ice sheets coming and going over tens of thousands of years and through ice age cycles. And also how they might recede in the future. And so that's a great way of communicating to the public much better than dry tables and thousands of just figures that you might think.
TIM: Well, this is great. Let's have a look at some examples of your work.
DAVE: OK.
Modeling the Ice Sheets
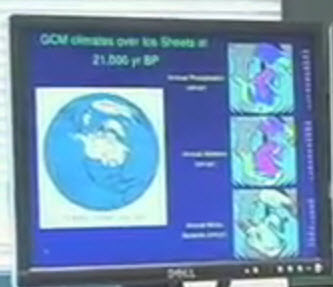
This shows work I've done coupling global climate models with ice sheet models. And this particular experiment was aimed at the last glacial maximum, 21,000 years ago-- really recently, geologic time, when ice sheets covered a lot of the known hemispheric continents, almost all of Canada, with kilometers thick ice sheets. And it's a real mystery why they came and why they went away again over very short geologic time periods.
And the purpose of this experiment was just to see if the global climate model could produce reasonable snowfall and snow melt patterns over these ice sheets. And that's what you need to do if you think about the long term evolution of them, because what is the net annual input of mass onto the surface versus the melt? That controls whether they recede or advance. So I use the global climate model with these boundary conditions to produce maps of snowfall, snow melt, and the net balance.
TIM: We've actually discussed this episode in the class. And during this time, part of Pennsylvania was covered with ice. But I'm curious, were you able to adequately model the ice sheet?
DAVE: Yes. These amounts of snowfall and snow melt are quite reasonable from what we can deduce about what they should be at the last glacial maximum, which is actually since the ice sheets were at their maximum, they weren't rapidly receding or growing. The net input of mass should be close to zero. And that's how it works out in these simulations.
But the atmosphere and climate system are more complex than we've considered thus far. Perhaps you gained some insight into this concept when considering the ancient climate-relevant deposits and the relationship between greenhouse paleosol and modern oxisol distributions. Therefore, we will consider, in more detail, the differences in climate between regions, specifically looking at predictions of regional climate change in the United States. You will think and write about how these predictions may affect the Critical Zone within a region.
Finally, we will close Lesson 5, and Unit 3, with some readings that link Earth's atmosphere to soil and provide predictions of changes in soil that we may expect as a result of climate change.
What will we learn about in Lesson 5?
- Regional climate change in the United States
- Links between the atmosphere and soil
- Predictions of changes to soil associated with climate change
- Future climate change
- Predictive models
- Atmospheric carbon dioxide content
- Temperature and precipitation
- Storminess
- Sea level
- Predictive models
What is due for Lesson 5?
Lesson 5 will take us one week to complete. As you work your way through these online materials for Lesson 5, you will encounter additional reading assignments and hands-on exercises and activities. The chart below provides an overview of the requirements for Lesson 5. For assignment details, refer to the lesson page noted.
Please refer to the Calendar in Canvas for specific time frames and due dates.
| ACTIVITY | LOCATION | SUBMISSION INFORMATION |
|---|---|---|
| Discussions on regional climate issues | page 3 | Participate in the Lesson 5 - Regional Climate team and class discussion forums in Canvas |
| Short (2-page) paper on links to the Critical Zone | page 4 | Post to the Lesson 5 - Links to the Critical Zone dropbox in Canvas |
| Discussion - Teaching and Learning About Atmosphere and Climate | page 5 | Participate in the Unit 3 - Teaching and Learning About Atmosphere and Climate discussion forum in Canvas |
Questions?
If you have any questions, please post them to our Questions? discussion forum (not e-mail), located under the Discussions tab in Canvas. I will check that discussion forum daily to respond. While you are there, feel free to post your own responses if you, too, are able to help out a classmate.