Earth 530 Course Outline
Unit 1, Lesson 1: The Critical Zone
Lesson 1 Introduction
Did you complete the Course Orientation?
Before you begin this course, make sure you have completed the Course Orientation.
You are just beginning Unit 1 of the course. This unit consists of a single lesson, Lesson 1, which will introduce you to some core concepts we will build on throughout the rest of the course.
Origins of the "Critical Zone" course
When I returned to Penn State in 2003, I immediately began to interact with the director of EESI, Sue Brantley. Sue and I quickly realized that we had common interests in the rates of soil formation (Sue) and ancient soil processes (me), so I began to work with her on a national-scale initiative, at the time organized as the Weathering Systems Science Consortium. This initiative evolved through a series of National Science Foundation (NSF)-sponsored workshops and meetings into what became the Critical Zone Exploration Network (CZEN). Since that time, the NSF has funded a network of Critical Zone Observatories (CZO), of which Sue is the principal investigator on one (Shale Hills), and a CZO National Office that I have coordinated and directed for a decade. This Critical Zone course that you are enrolled in evolved from these efforts and you will read reports and scientific manuscripts that were developed through these initiatives.
As you will learn in more detail, the Critical Zone refers to the thin outer veneer of Earth's continents between the top of the vegetation canopy down to the bottom of the fresh groundwater zone —in effect, the zone where most of terrestrial life as we know it thrives, including humanity. Consider a single entity capable of nurturing life, supporting agriculture, cleansing water, buffering atmospheric gas levels, to name a few processes, and you will have considered the Critical Zone. It is this zone, or system, critical to the maintenance of healthy life on Earth, that we will learn about during this course.
Historically, very little transdisciplinary and integrative science has been accomplished in the Critical Zone, primarily because no national-level funding enabled such studies. However, the U.S. National Science Foundation corrected that oversight through the creation and funding of a Critical Zone Observatory (CZO) program in 2007. The CZO program will be terminated in November 2020 but has been replaced by the Critical-Zone Collaborative Network (CZNet), an evolving network of thematic clusters and a coordinating hub that the greater CZ community eagerly watches as it now evolves. Thus you have entered an emerging realm of science, truly a frontier, in which new concepts will be advanced and new discoveries will be made as we progress through this course.
Watch this!
Penn Staters have been fortunate to have the Shale Hills Critical Zone Observatory near the main campus. Take a look at the video clip of my visit to Shale Hills. The video is somewhat outdated since the CZO program expanded to 9 observatories and has subsequently been terminated, but the video is still informative.
Video: The Shale Hills Critical Zone with Tim White (06:23)
[MUSIC PLAYING]
DR. TIM WHITE: Welcome to the Shale Hills research watershed. We've driven about 25 minutes southwest of Penn State's main campus, to one of the universities recreational areas called Stone Valley. We're at the beginning of the course, and the reason we've come here is because the Shale Hills watershed is one of three critical zone observatories that was recently funded by the National Science Foundation, to focus on interdisciplinary science in the critical zone. Let's take a short walk up into the drainage and consider some of the details of critical zone science.
[MUSIC PLAYING]
Defining the Critical Zone
We've walked about 100 yards up the drainage, and stopped here so that I can remind you what the critical zone is. We define the critical zone as, the thin veneer at Earth's surface that spans from the top of the vegetation canopy, all the way down through the soils, and bedrock, and surface water, and into the groundwater that freely circulates beneath the surface deep below our feet. This metal well casing beside me penetrates 80 feet into the subsurface and provides us with direct access to that groundwater, the base of the critical zone. Now I'd like to demonstrate to you the truly interdisciplinary nature of critical zone science, by showing you some of the different instruments that are deployed here.
[MUSIC PLAYING]
Soil Science & Geochemistry in the Critical Zone
Soil scientists in our group make detailed descriptions of the soils and the depth of the underlying coherent bedrock. And here you can see a soil pit that's been done for that purpose. The soil scientists also use a variety of instruments to study the soil pore waters, and the moisture and temperature content of the soils throughout the seasons. And we'll show you some instrumentation that's used for that purpose next. Recall that I mentioned the interdisciplinary nature of critical zone science. These PVC tubes that you see before me, allow the geochemists in our group to access and sample pore waters contained within the soils. And it's the study of the chemistry, and chemical processes that occur here, that allow us to understand the chemistry of the critical zone at this site. And we'll refer more to this in our water unit later in the semester. This solar-powered data logger provides continuous recording capability for the various soil moisture, and soil temperature probes, that are deployed throughout the basin. This data is being collected as we speak, and analyzed by graduate students back at the main campus.
[MUSIC PLAYING]
Erosion in the Critical Zone
Geologists and geomorphologists in our group are interested in the various processes of erosion that occur within this watershed. Imagine that 10,000 years ago, a thick and vast ice sheet existed just 40 miles from here. And so this entire basin was frozen solid, and very little erosion occurred at that time. Since then though, the landscape has thawed and erosion has occurred. And so it's the processes of erosion that have occurred since that thawing that we're interested in. One of these processes is called tree throw. And here you can see this root ball behind me from this recently fallen tree. And it's this process of churning the soil and exposing it to rainfall and erosion, that were interested in. And we'll return to thinking about processes like this during our landform unit later in the semester.
[MUSIC PLAYING]
Studying the Tree Canopy in the Critical Zone
In the near future, foresters and plant pathologists within our research group will erect scaffolding to provide them access to the upper levels of the canopy behind me. And these studies will focus on understanding the various fluxes of nutrients from the soils into the vegetation, as well as root-specific processes in the subsurface within the critical zone. We'll refer more to these processes in our biota unit much later in the semester.
[MUSIC PLAYING]
Hydrology in the Critical Zone
The hydrologists and civil engineers in our group use data collected here at this weir dam to understand seasonal variations in surface water flow, eventually for the purposes of modeling the hydrology of this basin. Notice the angle of the structure and the notch. These are very precisely made for the purposes of accurately recording the height or stage of the stream, and the flow of the stream at this point. Well, that completes our introduction to the Shale Hills research watershed. Remember that this is one of three recently established critical zone observatories in the United States, built specifically for the purposes of studying the critical zone. And we'll return to think in detail about many of the processes I've briefly introduce to you today, later and throughout the semester.
[MUSIC PLAYING]
Check this out...
For information on the other nine NSF-funded Critical Zone Observatories, visit Critical Zone Observatory [2]. While there be sure to view the 7-minute Introductory video. [3]It, too, is somewhat outdated but provides additional introductory information on the now-terminal Critical Zone Observatory program.
Questions?
If you have any questions, please post them to our Questions? discussion forum (not e-mail), located under the Discussions tab in Canvas. I will check that discussion forum daily to respond. While you are there, feel free to post your own responses if you, too, are able to help out a classmate.
Lesson Overview
In this first lesson, you work through a broad introduction to the Critical Zone, which will include the history and development of the Critical Zone concept. You will find that I have assigned a report from a National Science Foundation (NSF)-sponsored workshop on the Critical Zone and sections from a National Research Council (NRC) book cited in the Critical Zone workshop report. Not only do I want you to understand the term Critical Zone, but I also want you to understand the most basic processes that occur in the zone and to appreciate why it is important to understand the Critical Zone. Furthermore, I want you to read and understand the role that the NSF and NRC play in developing and supporting scientific endeavors in our country — think about how their programs might help your own teaching!
What will we learn about in Lesson 1?
- Definition of the Critical Zone--what is it?
- The importance of the Critical Zone--why should we care?
- Outstanding questions in Critical Zone science regarding:
- ecosystem nourishment
- soil and water resources
- chemical and physical weathering
- gas and particulate fluxes to the atmosphere
- human (and other) perturbations
Learning Objectives
By the end of this lesson you should be able to:
- define the Critical Zone and the importance of it to humanity
- list some anthropogenic impacts on the zone
- explain the four frontiers or driving questions of Critical Zone science — that an effort to organize an integrated national research effort has begun and that this course is organized to introduce you to the basic science that is applied to answer the driving questions.
What is due for Lesson 1?
Lesson 1 will take us one week to complete. As you work your way through these online materials for Lesson 1, you will encounter additional reading assignments and hands-on exercises and activities. The chart below provides an overview of the requirements for Lesson 1. For assignment details, refer to the lesson page noted.
Please refer to the Calendar in Canvas for specific time frames and due dates.
| ACTIVITY | LOCATION | SUBMISSION INFORMATION |
|---|---|---|
| Semester Project Identifying your project region and topic | page 4 | Post to the Lesson 1 - Semester Project Proposal dropbox in Canvas |
Questions?
If you have any questions, please post them to our Questions? discussion forum (not e-mail), located under the Discussions tab in Canvas. I will check that discussion forum daily to respond. While you are there, feel free to post your own responses if you, too, are able to help out a classmate.
Introduction to Critical Zone Science
The Critical Zone encompasses the external or near-surface Earth extending from the top of the vegetation canopy down to and including the zone of freely circulating fresh groundwater. Complex biogeochemical processes combine here to transform rock and biomass into the central component of the Critical Zone—soil. The Zone sustains nearly all terrestrial life including humanity, nonetheless, ever-increasing negative impacts of human society on the Critical Zone continue. Will we allow these impacts to continue unabated, and if so how will our impacts affect humankind and the rest of nature?
The degraded state of Earth's surface has been well documented for example in the United Nations Environment Programme's Millenium Ecosystem Assessment report (2005), [4]and One Planet Many People: Atlas of Our Changing Environment (2005); the Intergovernmental Panel on Climate Change Fifth Assessment Report (2013), and more recent versions [5]; The Penguin State of the World Atlas: Ninth Edition (2012); and, The Atlas of Global Conservation: Changes, Challenges, and Opportunities to Make a Difference (ed., J.L. Molnar, 2010). Hooke et al (Land Transformations by Humans: A review; GSA Today, 2012, v. 22, no. 12, 4-10) summed up some of the topics and tone of these reports concluding that humans have modified more than half of Earth's land surface, that the current rate of land transformation is unsustainable, and that "changes that human activities have wrought on Earth's life support system have worried many people". To many scientists and citizens, these threats to an essential component, i.e. the Critical Zone, of our life support system, have reached an acute level, yet the science of understanding and managing these threats mostly remains embedded within individual disciplines, and the science has largely remained qualitative - there has never been a more important time for a truly international and interdisciplinary approach to accelerate our understanding of Critical Zone processes and how to intervene positively to mitigate threats and sustain and enhance Critical Zone function. All life on Earth relies on humanity embracing balance and sustainability on a global scale.
In this lesson, you will be introduced to Critical Zone science. To accomplish this you will read "The Critical Zone: Earth's Near-surface Environment" and "Frontiers in Exploration of the Critical Zone: Report of a workshop sponsored by the National Science Foundation (NSF)." I stress that this is an introduction. While I want you to grasp key concepts from the readings, I do not want you to fret over every detail — we have plenty of time for that throughout the remainder of the semester. For now, I want you to understand that Critical Zone science truly is multi- and inter-disciplinary — Critical Zone processes are represented by coupled physical, biological and chemical processes — and that an array of scientific expertise is needed to understand the Critical Zone: geology, soil science, biology, ecology, geochemistry, geomorphology, hydrology, to name a few.
Reading Assignment
Read the following selections:
- Committee on Basic Research Opportunities in the Earth Sciences. (2001). The Critical Zone: Earth's Near-surface Environment [6]. In Basic Research Opportunities in Earth Science (pp. 35–45). Washington, D.C.: National Academy Press.
- Please pay particular attention to Figure 2.1.
- Brantley, S., White, T., White, A., Sparks, D., Richter, D., Pregitzer, K., et al. (2006). Frontiers in exploration of the Critical Zone [7]. In Frontiers in exploration of the Critical Zone: Report of a workshop sponsored by the National Science Foundation (NSF) (pp. 1–30). Newark, DE.
- Please pay particular attention to Figures 4–7, 10, 11 and 13, and Table 1.
Note
These readings are also available through Library Reserves.
Browse:
- The U.S. Critical Zone Observatory Web site [8]
- The Critical Zone Exploration Network Web site [9]
- Read the "About CZEN" section.
- Check out and browse the final report [10] from a 2011 meeting of international CZ scientists if you care to learn about the evolution of scientific inquiry at CZOs.
- The National Science Foundation Web site [11]
- Click on "About" and read through this brief introduction to the NSF, following the MORE links for greater detail.
- Please pay particular attention to the "Classroom Resources [12]" section (www.nsf.gov/news/classroom/ [12]). I want you to understand how basic scientific research is funded in the United States and how this research is made available for teachers like yourselves.
- The National Research Council Web site [13]
- Browse the section on the Earth and Life Studies Division (DELS)
- Under DELS, read the "About us" section, including "Who we are and what we do" Also view "Our Boards". You may find information that is useful to you during this class and in your classrooms.
Semester Project Overview
In this course, a semester project is assigned in order to:
- allow you to develop a learning module that can be introduced into your classroom;
- provide you with an exercise in active learning; and
- provide me with one means of evaluating your level of scholarship in this course.
To me, point 1 above is the most important. I sincerely hope that you will engage this opportunity along with my expertise and your energy and creativity to develop a tool for teaching Critical Zone science in your classroom(s). The project is somewhat loosely defined, to be developed through communication between me and each of you, but you will research and study a site or process that exemplifies some aspect of Critical Zone science. Ideally, your project will focus on a locale within your teaching region so that a field trip could be designed if that is appropriate in your school district—with luck a suitable site may exist on your school property! In the end, you will develop and present a ten-page, referenced report and lesson plan for 30% of your final course grade. My philosophy is that if you sincerely and wholeheartedly engage points 1 and 2 above, my evaluation will be easy for me and great for you.
This week you will begin communication with me about your semester project. By the end of Week 3, you will have finalized the region and topic of your project. You should view this communication process as evolutionary, that is, we will probably not converge on a topic in one e-mail or phone conversation. Please adhere to the due dates associated with this project: communicate with me regarding potential project topics during week 1, refine the topic during week 2, finalize topic by week 3. Remember the evolutionary nature of topic development. As with other communications, if you wait until the last minute to discuss the semester project with me, I may not be able to respond to you in a time frame that allows you to adequately consider my comments and meet the deadline.
I've included some examples of well-considered and developed semester projects from some past semesters in which the course was offered and taught (see below under Attachments and a link). The first, by Laurie Syphard, presents a lesson plan that uses data from one of the National Science Foundation's Critical Zone Observatories to lead high school students through a hands-on learning exercise. Laurie is a 2012 graduate of the M.Ed. in Earth Sciences program and has been able to integrate some of the content that is covered in Earth 530 into her work as a freelance science curriculum developer. The second example, by John Smith, is also a lesson plan that in this case uses information you will learn to access during this course - to develop site studies that culminate in a field trip. John graduated from the M.Ed program in August 2013 and has indicated that he left this course with a greater understanding of the Critical Zone, which he intends to share with his students. Third, is an example completed by Adam Renick, a school teacher in San Diego - Adam used his semester project to organize his subsequent program-required "capstone" project: a virtual field trip to Torrey Pines State Park, the site of his semester project study. Click here to see the results of Adam's capstone [14], admittedly several steps beyond what I expect for your semester project, but an excellent example of what can be accomplished during this course to implement in your school curriculum. Feel free to view and study them, but please do not try to reuse them for your project!
Activity
Directions
Identify your semester project region and topic for your semester project. The region you identify for your semester project will be straightforward: it should lie within a bus ride of your school so that you can realistically consider implementing site visits into your school's curriculum if that seems appropriate. Alternatively, you could study some aspect of Critical Zone science at a nearby site in which you collect data, observations, and photographs that could be presented in your classroom. You will want to develop a topic and site that can engage your students in thinking about Critical Zone science as you will understand it after Lesson 1. If you have some specific expertise or area of interest, you may want to skip ahead to a lesson that engages that expertise/interest to guide your thinking on the semester project. In any case, we will need to discuss the specific site and topic, and you must receive my permission to proceed.
Submitting Your Work
- Go to Lesson 1 - Semester Project Proposal dropbox in Canvas by the due date indicated on our Canvas calendar.
- Use the "Message" field provided there to explain your proposed semester project region and topic. If you prefer, you may attach a document containing your proposal by using the "Attachments" link in that dropbox. Be prepared to discuss your choice with me by e-mail.
Note
Attachments (optional) must be in Word (.doc) or PDF (.pdf) format so I can open them. In addition, documents must be double-spaced and typed in 12 point Times Roman font.
Grading Criteria
The identification of your semester project topic in a timely fashion will reflect on your grade for the project. If you adhere to the schedule, you will have begun the path toward an eventual "A." In other words, you will not have negatively affected your grade. If, however, you ignore the schedule, your grade will be adversely affected: 5% lower grade on the semester project for each day you are late.
| Attachment | Size |
|---|---|
| 156.25 KB | |
| 797.54 KB |
Summary and Final Tasks
Reminder—Review the Lesson 1 Overview
You have reached the end of Lesson 1! Double-check the list of requirements on the Lesson 1 Overview page to make sure you have completed all of the activities listed there.
Tell us about it!
If you have anything you'd like to comment on or add to, the lesson materials, feel free to share your thoughts with Tim.
Unit 2, Lesson 2: Soil
Lesson 2 Introduction

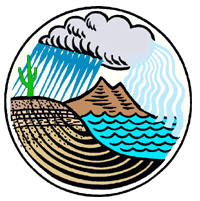
As introduced in Lesson 1, Critical Zone processes are represented by coupled physical, biological, and chemical processes that involve study by experts in geology, soil science, biology, ecology, geochemistry, geomorphology, and hydrology, to name a few of the relevant sciences. While these various disciplines are equally important for understanding the Critical Zone, they are linked by the presence of soil, considered by many to be the central component of the Critical Zone. This concept is perhaps best illustrated by the SoilCritZone logo shown here: a four-leaf clover-like emblem of yellow (at top, representing atmosphere), green (right, biosphere), blue (left, hydrosphere), and brown (bottom, lithosphere) arcs surrounding the acronym SoilCritZone; the design of the logo symbolizes how soil and the Critical Zone exist within the overlapping region between the four arcs or "spheres." The spheres closely overlap with the state factors of soil formation you will be introduced to later in this lesson: parent material, climate, topography, biota, and age.
Many of you may consider soil to be the mud you played in as a child, the material into which you plant your garden or the dirt you scrape off the bottom of your shoes or wipe from your dog's muddy feet. To most of humanity, soil may even seem to be a nuisance—the word itself has various meanings depending on the usage: as a verb, soil means to make dirty; to disgrace or tarnish; to corrupt or defile; or to dirty with excrement (Free Online Dictionary [17]).
To begin to focus your attention on the positive aspects of soil, please consider the following four definitions. Soil is:
- the upper layer of Earth that may be dug or plowed and in which plants grow; and, the superficial unconsolidated and usually weathered part of the mantle of a planet and especially of the Earth (Merriam-Webster).
- that Earth material which has been so modified and acted upon by physical, chemical, and biological agents that it will support upright rooted plants. The term as used by engineers includes, in addition to the above, all regolith (American Geological Institute Dictionary of Geologic terms).
- (i) the unconsolidated mineral or organic material on the immediate surface of the Earth that serves as a natural medium for the growth of land plants. (ii) The unconsolidated mineral or organic matter on the surface of the Earth that has been subjected to and shows effects of genetic and environmental factors of: climate (including water and temperature effects), and macro- and microorganisms, conditioned by relief, acting on parent material over a period of time. A product-soil differs from the material from which it is derived in many physical, chemical, biological, and morphological properties and characteristics (Soil Science Society of America Glossary).
- the naturally occurring, unconsolidated or loose covering of broken rock particles and decaying organic matter (humus) on the surface of the Earth, capable of supporting life. In simple terms, soil has three components: solid, liquid, and gas. The solid phase is a mixture of mineral and organic matter. Soil particles pack loosely, forming a soil structure filled with voids. The solid phase occupies about half of the soil volume. The remaining void space contains water (liquid) and air (gas). Soil is also known as earth: it is the substance from which our planet takes its name (Wikipedia).
Though the four definitions share common attributes, they do differ. For example, agronomists and most soil scientists focus their studies of soil on the rooted zone, or rhizosphere (approximately to depths of one meter), while the geologist's perspective is much broader and deeper, encompassing the full thickness of material down to the original parent material (shallow to depths up to one hundred meters or more). Nonetheless, most scientists agree that soil is a complex biomaterial that promotes the growth of terrestrial organisms, that it is crucial to life on Earth, and that it is the product of material derived from weathering of parent material, decomposing plant matter, and atmospheric deposition. Furthermore, as soil resources are finite, humanity should view them as non-sustainable and learn to care for and sustain these important resources. For these reasons, we will now turn our attention in Lesson 2 to the study of soil, the "heart" of the Critical Zone.
Reading Assignment
Browse the following Web site to learn how a consortium of university and government agencies from the European Union focused on Critical Zone studies in Europe and d information to guide the development of better government policies to sustain soil resources.
Want to learn more?
(Optional) Visit the U.S. Department of Agriculture Soil Resource Management [19] research program's Web site to learn about soil conservation and management, nutrient management, soil water and biology, and other soil-related research in the U.S.
Also, check Soil Education [20] for a wide range of important information regarding soils, including various media that can be introduced into your classrooms.
The Smithsonian's National Museum of Natural History has recognized the societal importance of soil by creating an exhibit that opened in Summer 2008. To learn more about this exhibit, see Dig It! The Secrets of Soil [21]. Be sure to view the new curator-led tour of the exhibit.
Finally, you may also be interested in this beautiful informative brochure [22] created by the Swiss National Science Foundation, in part to observe the 2015 International Year of Soils.
Lesson Overview
In this lesson, we will focus on soil, the "heart" of the Critical Zone. I am not concerned that you memorize various definitions for soil—instead, I want you to learn that soil consists of mineral and organic matter derived from a variety of sources and that it is vitally important to sustaining life on Earth, including human society. To do this we will examine the basic processes involved in soil formation (the so-called state factors of soil formation), simple scientific approaches to studying and classifying soils, and the global distribution of different types of soils (soil orders). You will learn that soils are not randomly distributed on our planet, but instead, occupy space determined by the overlapping domains of the state factors of soil formation. Ultimately, soil records the overlap of atmospheric, lithospheric, hydrologic, and biologic processes, the innermost workings of the Critical Zone. Finally, you will consider the distribution of soils near your workplace and the implications of the distribution to understanding Critical Zone processes and land use at the site. You will accomplish this by using an online resource that you may want to introduce into your own classroom. In a later lesson, we will apply this knowledge of present-day soils to learn about ancient soils (paleosols) and their importance for understanding Earth history and perhaps Earth's future.
What will we learn about in Lesson 2?
- What is soil? How does it form? How is soil studied and classified?
- The importance of soil—why should we care?
- How is soil geographically distributed?
- What are the threats to soil?
- How are soils mapped and how can you determine soil types in any region of the United States?
Learning Objectives
By the end of this lesson you should be able to:
- describe soil as a societally relevant mineral and biotic entity
- list the five state factors of soil formation and basic information regarding the importance of each
- discuss how soils are described and classified into twelve soil orders and how those soil orders are geographically distributed
- list five of the major threats to healthy soils
- explain the use of information from the Web Soil Survey and how it can be applied to land-use planning and decision making
What is due for Lesson 2?
Lesson 2 will take us one week to complete. As you work your way through these online materials for Lesson 2, you will encounter additional reading assignments and hands-on exercises and activities. The chart below provides an overview of the requirements for Lesson 2. For assignment details, refer to the lesson page noted.
Please refer to the Calendar in Canvas for specific time frames and due dates.
| ACTIVITY | LOCATION | SUBMISSION INFORMATION |
|---|---|---|
| Answer questions about soil erosion | page 3 | Upload your responses to the Lesson 2 - Soil Erosion dropbox in Canvas |
| Answer questions about soil orders | page 6 | Upload your responses to the Lesson 2 - Soil Orders dropbox in Canvas |
| Short report on the Web Soil Survey | page 7 | Upload your report to the Lesson 2 - Soil Survey dropbox in Canvas |
| Discussion—Teaching and Learning About Soil | page 9 | Participate in the Unit 2 - Teaching and Learning About Soil discussion forum in Canvas |
Questions?
If you have any questions, please post them to our Questions? discussion forum (not e-mail), located under the Discussions tab in Canvas. I will check that discussion forum daily to respond. While you are there, feel free to post your own responses if you, too, are able to help out a classmate.
Soil Erosion
Much of Earth's surface is covered by unconsolidated debris overlying hard, unaltered rock. This unconsolidated layer is called regolith. The regolith may have formed in place immediately above unaltered rock, or may have been transported by various physical processes we will discuss in Unit 4. Soil is derived from the physical, chemical, and biological alteration of regolith.
At the simplest level, the presence or absence of soil can be considered as dependent upon whether alteration of regolith (soil formation) occurs faster than soil erosion. Soil erosion occurs naturally but is widely recognized to have been greatly increased by human activities in the Critical Zone—both the natural and human-influenced (or anthropogenic) rates of soil erosion have been well studied and measured.
Activity
Note
For this assignment, you will need to record your work on a word processing document. Your work must be submitted in Word (.doc) or PDF (.pdf) format so I can open it. In addition, documents must be double-spaced and typed in 12 point Times Roman font.
Directions
- Go to the Soil Erosion Site [24] and spend no more than an hour learning about soil erosion and the relevance to humanity. Do not concern yourself with those portions of the site that are under construction; we will consider erosion in a broader sense in Unit 4.
- As you review the site, briefly (no more than one page) respond in writing to the following questions on the implications of soil erosion to Critical Zone science:
- What aspects of the Critical Zone, outside of soil itself, are impacted by soil erosion?
- Are the impacts beneficial or deleterious?
- Save your document as either a Microsoft Word or PDF file in the following format:
L2_soilerosion_AccessAccountID_LastName.doc (or .pdf).
For example, student Elvis Aaron Presley's file would be named "L2_soilerosion_eap1_presley.doc"—this naming convention is important, as it will help me make sure I match each submission up with the right student!
Submitting your work
Upload your paper to the "Lesson 2 - Soil Erosion" dropbox (see the lesson folder under the Modules tab) by the due date indicated on our Canvas calendar.
Grading Criteria
You will be graded on the quality of your writing. You should not simply write responses to the questions and submit them to me. Instead, plan on writing a short stand-alone paragraph (or page or whatever you decide is necessary considering any constraints I might have placed on you) so that anyone can read what you've written and understood it. You should strive to be specific and complete in responding to the questions. Your answers should be analytic, thoughtful, insightful, and should provide connections between ideas. The writing should be tight and crisp with varied sentence structure and a serious, professional tone.
State Factors of Soil Formation
Soil formation, or pedogenesis, typically happens over long periods of time. The so-called "mineral" component of soil is formed from the weathering, or decomposition, of rocks and minerals. There are two types of weathering: physical and chemical. Physical weathering involves the breakdown of rocks into smaller particles through direct contact with atmospheric heat, moisture, and pressure. The effects of various chemical processes (e.g., atmospheric or biologic) on the size and composition of minerals and rock is known as chemical weathering. Weathering processes will be further explored in our landforms unit.
The rates of soil formation have not been as well characterized as soil erosion rates. This creates an interesting conundrum for scientists and land-use planners interested in the impacts of soil erosion. Though we know there are sites on Earth where soil is eroding at an unsustainable rate, do sites exist where soil is forming at a rate that equals or exceeds the rate of soil erosion? If so, soil erosion may not be an important consideration for these sites when considering land-use issues. Therefore, accurate determinations of soil formation rates under varying conditions are a key question in Critical Zone science.
Soil formation is controlled by five variables in nature. Those variables are:
- parent material
- climate
- topography
- biota
- time
In addition, most scientists also recognize that humanity, having influenced much of the Critical Zone, represents a sixth factor in soil formation. The varying distribution of these variables in soil formation (also known as the state factors) on Earth's surface, and therefore the differing distribution of physical, chemical, and biological processes dependent upon the distribution and interplay of the state factors, plays a role in soil formation and the development of different types of soil.
Reading Assignment
Before we progress to learn about the different soil types and their distribution on Earth, I want you to first understand the state factors of soil formation. Please read the following text chapter, which is available through Library Resources:
- Brady, N. C., and R. R. Weil (2002). Formation of Soils from Parent Materials. In The Nature and Properties of Soils (13th ed., pp. 39–64). Upper Saddle River, N.J.: Prentice-Hall.
As you read this, keep in mind that I'd like you to leave this reading assignment able to list the state factors of soil formation. You should also understand the basics of the role each state factor plays in soil formation. Begin to think about the varying distribution of the state factors on a landscape-versus-global scale. Do you think patterns exist in the distribution of the state factors? If so, do these patterns carry over to observable patterns in the distribution of the soil orders?
Soil Description and Classification
Watch This!
- Part 1: [25] Introduction to Soil Study and Soil Properties (4:20 min.). See Part 1 Transcript [26]
- Part 2: [27] Soil Horizons, Boundaries, & Transitions (5:30 min.). See Part 2 Transcript [28]
- Part 3: [29] Assessing Soil Color & Texture (6:25 min.). See Part 3 Transcript [30]
- Part 4: [31] Assessing Moisture & More about Horizons (7:40 min.) See Part 4 Transcript [32]
Reading Assignment
Soils are characterized in the field in natural exposures, in dug soil pits, or in places where augers can be used to bore holes and obtain samples from the subsurface. Typically soils are described on the basis of the presence of soil horizons and the character of the boundaries between horizons, the texture of the soil based on the size of the soil constituents, the color of the soil material, the structure of the soil, the presence of organic matter and roots, and the hydraulic conductivity. Other relevant characteristics include the geomorphic (landscape) location of the soil (including slope, elevation, aspect), and soil parent material. These characteristics are in turn used to classify soils—we will discuss the classification of soils to the order level, that is twelve soil orders. Before we do, follow each of the links below to learn more about soil sampling and characterization.
You will notice that there is a substantial overlap between the first Weblink shown below and the following four Weblinks. I would like you to visit all of these Web sites but spend no more than two hours total reviewing this information.
- Soil Characterization Protocols [33]
- Soil Horizon [34]
- Soil Texture [35]
- Soil Color [36]
- Soil Structure [37]
Soil Surveys and Maps and Land-Use Planning
Different soil types are variably distributed across Earth's continents, dependent upon the varying relative influence of the state factors of soil formation. These varying soil types are recognized by the characteristics you studied when considering soil description and classification. The various soil types are mappable units; that is, they exist as coherent bodies of similar soil material which eventually merge laterally with other soil types, bedrock, or unaltered sediment. The process by which the distribution of the different soil types are mapped in the field is called soil surveying or soil mapping [38].
The term "soil survey" is also used to describe the published results of soil mapping efforts. Typically these published reports include information about slope, permeability, and drainage characteristics, to name a few and are therefore very important reference manuals in land-use planning and decision making. In the United States, we are fortunate to have a Federal agency which oversees soil mapping, currently named the Natural Resources Conservation Service (NRCS).
Activity
Note
For this assignment, you will need to record your work on a word processing document. Your work must be submitted in Word (.doc) or PDF (.pdf) format so I can open it. In addition, documents must be double-spaced and typed in 12 point Times Roman font.
Directions
- Visit the Natural Resources Conservation Service (NRCS) [39]Web site and learn about the various purposes of the National Cooperative Soil Survey.
- Visit the NRCS Web Soil Survey [40] Web site to better understand the availability of soil maps for your region.
- Assess the soil types on your school property or some other nearby accessible site:
- Follow the three simple steps at Web Soil Survey to locate a study site and obtain a soil map of the site.
- Download the soil map and legend for inclusion in a short report to me.
- Address the following questions in your report:
- What is the dominant soil type at your study site?
- Are there any characteristics of this soil that affect land use and is the effect positive or negative?
- Does your state soil exist at the study site? If not, locate the closest site where your state soil is mapped.
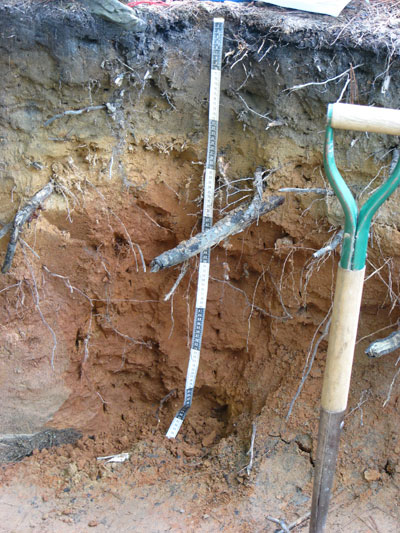
- Are there any soil exposures on your school property or nearby? (This will require a walk!) If so, what soil type is exposed? If not, where is the closest soil exposure to your study site? Include a photograph of the soil exposure.
- Briefly describe the importance of the state factors in the formation of the dominant soil at your study site. Compare/contrast your study soil to your state soil.
- Save your report as either a Microsoft Word or PDF file in the following format:
L2_soilsurvey_AccessAccountID_LastName.doc (or .pdf).
For example, student Elvis Aaron Presley's file would be named "L2_soilsurvey_eap1_presley.doc"—this naming convention is important, as it will help me make sure I match each submission up with the right student!
Submitting your work
- Submit your report to the Lesson 2 - Soil Survey dropbox in Canvas by the due date indicated on our Canvas calendar. (See the Modules tab in Canvas for the Dropbox).
Grading criteria
You will be graded on the quality of your writing. You should not simply write responses to the questions and submit them to me. Instead plan on writing a short stand-alone paragraph (or page or whatever you decide is necessary considering any constraints I might have placed on you) so that anyone can read what you've written and understood it. You should strive to be specific and complete in responding to the questions. Your answers should be analytic, thoughtful and insightful, and should provide an insightful connection between ideas. The writing should be tight and crisp with varied sentence structure and a serious, professional tone.
Soil Orders
Activity
Directions
A wide range of soil classification schemes has been developed by various nations primarily interested in the agricultural aspects of their native soils. Again, you should not spend much more than two hours reviewing this information.
Note
For this assignment, you will need to record your work on a word processing document. Your work must be submitted in Word (.doc) or PDF (.pdf) format so I can open it. In addition, documents must be double-spaced and typed in 12 point Times Roman font.- To get a sense of the range of soil classification schemes, go to soil classification [41] and be sure to scroll down and read "See Also" - many more systems exist but this presents a few of those that are more widely accepted and used.
- Once you have a sense for the wide range in classification schemes, review "The Twelve Soil Orders Soil Taxonomy [42]".
- Spend time working through the description for each soil order and view some of the examples of each. Pay particular attention to the latitudinal distribution of each soil order.
- Answer the following questions. You may find the following resource to be helpful: (PBS Learning Media website [43]).
- Do you observe any generalized pattern to the distribution of any of the soil orders?
- If so, can you attribute the distribution to any understanding you may have of the state factors of soil formation?
- Can you draw any conclusions regarding the relative importance of any of the state factors of soil formation from your observations?
Note
"Teacher's Domain" is a free resource, but you must register with them in order to view more than seven resources. Since we'll point to that resource throughout this course, you may want to take a moment to go ahead and register with them now.
- Save your document as either a Microsoft Word or PDF file in the following format:
L2_soilorders_AccessAccountID_LastName.doc (or .pdf).
For example, student Elvis Aaron Presley's file would be named "L2_soilorders_eap1_presley.doc"—this naming convention is important, as it will help me make sure I match each submission up with the right student!
Submitting your work
Upload your paper to the "Lesson 2 - Soil Orders" dropbox in Canvas (under the Modules tab) by the due date indicated on our Canvas calendar.Grading criteria
You will be graded on the quality of your writing. You should not simply write responses to the questions and submit them to me. Instead plan on writing a short stand-alone paragraph (or page or whatever you decide is necessary considering any constraints I might have placed on you) so that anyone can read what you've written and understood it. You should strive to be specific and complete in responding to the questions. Your answers should be analytic, thoughtful and insightful, and should provide an insightful connection between ideas. The writing should be tight and crisp with varied sentence structure and a serious, professional tone.
Want to learn more?
(Optional) Visit the United States Department of Agriculture (USDA Website [44]).
- Go to "Related Topics - Products and Services - Educational Resources [45]" and browse their educational materials: scroll down the page to "Other Resources for Students and Educators."
- Also at "Products and Services," follow the outreach activities link and click on "Career Outreach" to learn about various opportunities for students including internships, scholarships, and employment.
Other Threats to Soil
Soils provide a number of essential goods and services to humanity, including biomass and food production, water filtration, carbon sequestration, and the substrate on which we live our daily lives. Yet the actions of human society present the single largest threat to this essential component of the Critical Zone and Earth system. Negative impacts to soils from human activity include erosion, compaction, salinization, sealing by paving, pollution, and declines in organic matter content and biodiversity. To learn more about threats to soil, visit The Environmental Literacy Council [46]. As you read the short statement there, think about how your own actions threaten the health of soil in your yard, community, and nation. Do you apply herbicides and pesticides to maintain a weed- and pest-free lawn? Do you have a paved rather than gravel driveway? If you have a septic system, do you maintain it and is it operating properly? Do you purchase food grown locally using sustainable agricultural practices? These are just a few of the actions you may take in your lives that preserve the health of soils.
Teaching and Learning About Soil
Let's take some time to reflect on what we've covered in this unit!
Activity
Directions
For this activity, I want you to reflect on what we've covered in this unit and to consider how you might adapt these materials to your own classroom. Since this is a discussion activity, you will need to enter the discussion forum more than once in order to read and respond to others' postings.
Submitting your work
- Enter the "Teaching and Learning About Soil" discussion forum in Canvas.
- Post your ideas for how the materials we covered in this unit might be adapted for your own classroom.
- Read postings by other EARTH 530 students.
- Respond to at least one other posting by asking for clarification, asking a follow-up question, expanding on what has already been said, etc.
Grading criteria
You will be graded on the quality of your participation. See the grading rubric [47] for specifics on how this assignment will be graded.
Summary and Final Tasks
In this lesson on soils, you read about soil formation, the description of soils, and the classification of soils in the United States into twelve soil orders. You also considered the effects of soil erosion on the Critical Zone and how the distribution of the twelve soil orders might relate to the five state factors of soil formation. By now you should understand that soil is a complex material composed of mineral and organic matter, formed by competing processes associated with climate, biota, parent material, topography and time. Soil exists in the overlapping realm between the atmosphere, hydrosphere, lithosphere, and biosphere. It is classified according to need: a geologist studying soil formation rates may have a very different view of soil compared to an engineer building a superhighway or an agronomist trying to understand soil fertility for crop management. Furthermore, due to the increase in human activity on Earth, soil erosion mostly exceeds soil formation rates, thus soil should be viewed as a finite resource that is rapidly being depleted. Finally, you should be well aware that soil maps are available for most of the United States and that they can be very useful, if not critical, for land-use planning and decision making.
With this firm background, throughout the course I want you to remember and contemplate the outstanding question in Critical Zone science, which was introduced in a Lesson 1 reading (Brantley et al. p. 11): can a unified approach be developed to characterize environmental conditions and mechanisms that produce different soil types?
Reminder—Complete all of the lesson tasks!
You have finished Lesson 2. Double-check the list of requirements on the Lesson 2 Overview page to make sure you have completed all of the activities listed there before beginning the next lesson.
Tell us about it!
If you have anything you'd like to comment on or add to, the lesson materials, feel free to share your thoughts with Tim. For example, what did you have the most trouble with in this lesson? Was there anything useful here that you'd like to try in your own classroom?
Unit 3, Lesson 3: Climate (1)
Lesson 3 Introduction
Atmospheric processes and climate (primarily precipitation and temperature) may be the most influential of the factors involved in soil formation because they control weathering over large geographic regions. Bedrock parent material is subjected to physical weathering and disintegration through expansion and contraction associated with wide temperature fluctuations. The presence of water enhances this effect through freezing, thawing, and chemical processes—chemical weathering is accelerated under warm climate settings. In addition, solute and particulate (dust) deposition from the atmosphere plays an important role in Critical Zone and soil biogeochemistry. While continents are more impacted by atmospheric deposition, strong contrasts exist between bedrock and atmospheric sources in ocean island soils.
Climate, as one of the state factors of soil formation, is controlled to a large extent by atmospheric processes dependent on the latitudinal position on Earth. To properly understand the varying effects of climate on the Critical Zone, we must understand Earth's atmosphere and the range of phenomena that occurs within it. The focus of our next three lessons (Lessons 3, 4, and 5) is on understanding the atmosphere and climate systems. In Lesson 3, we will explore the basic structure of the atmosphere, the carbon cycle, basic atmospheric chemistry, atmospheric carbon dioxide and greenhouse gases, radiative forcing, and physical climate processes and feedbacks. In Lesson 4, we will turn our attention toward the evolution of Earth's atmosphere and ocean system through geologic time, specifically focused on our understanding of paleoclimatology (ancient climates). In Lessons 4 and 5, we will consider potential lessons from this knowledge of ancient climate and regional climate issues, in particular how this knowledge can aid our predictions of, and planning for, future climate change. Finally, we will consider how all this knowledge of past, present, and future climate processes is linked to soil formation and the Critical Zone, a topic we will return to in the final lesson (Lesson 12) of this course.
Watch this!
I visited the Adirondacks in upstate New York to examine climate, the hydrologic cycle, and some of the ways in which the forests interact with the Critical Zone during the winter season. Take a look at the video clip below of my visit to the Adirondacks.
Video: A Visit to the Adirondacks with Tim White (3:10)
[MUSIC PLAYING]
TIM WHITE: Hello. I've driven about nine hours north from State College into the northern part of the Adirondack Park in upstate New York. And I'm here to visit my sister, who I've just skied with, out onto Middle Saranac Lake. In the background, you can see of our favorite mountains-- Ampersand Mountain. This is Bodie stumbling around in front of us.
But I thought that while I'm here, I would take advantage of the wintry weather that they're experiencing here that we're not having in central Pennsylvania, to talk to you a little bit about climate and also about the hydrologic cycle and some of the ways in which the forests interact with the critical zone during the winter season.
The difference between weather and climate is an elusive concept for some people, so I'm going to try to describe it to you.
Recall that just moments ago, the sky was clear, and the sun was out to the east. But now, we're in the middle of a nice snowfall. This is an example of the weather. Weather, to me, describes the physical conditions in the atmosphere, and those conditions can change rapidly on time scales of hours to days from region to region and also through time.
Climate, on the other hand, describes prevailing weather trends in a region typically considered over years to decades. So while the weather is different today between the Adirondacks and central Pennsylvania, both regions are characterized as having a humid temperate climate.
One of the things that's unique about the Adirondacks compared to central Pennsylvania is that the mountains, and the topography, and the elevation. So this geographic component is important to understanding climate.
So mountainous regions further from the coastlines typically have colder, longer winters than areas closer to the coast at lower elevations like central Pennsylvania.
In mid- to high-latitude regions that experience a truly cold winter season, critical zone processes slow down and in some cases cease to function. For example, in the frozen Adirondacks, the water that in other seasons would percolate into the subsurface's ground water or flow through the rivers and lakes of the region, is temporarily stored as ice and snow at the surface until temperatures warm, thaw occurs, and critical zone processes begin anew.
We'll reconsider seasonality in later lessons when we discuss the hydrologic cycle and biotic functioning of the critical zone.
[MUSIC PLAYING]
Learning Objectives
By the end of the unit, successful students will be able to:
- Describe the components of the climate system and the basic natural and anthropogenic forces that affect the climate system, including the history of variability and change.
- Respond to questions like: "How much is the world warming?" "Is the recent warming unusual?" and "How rapidly has climate changed in the past?"
- Describe the C cycle and atmospheric chemistry.
- Evaluate C cycle and greenhouse gas models and future projections of atmospheric compositions.
- Determine the relative roles of ozone, aerosols, solar forcing, and land-use change in radiative forcing.
- Further explain the links between the atmosphere, hydrosphere, lithosphere, and biosphere processes and their role in Critical Zone health.
- Compare and contrast various models of future climate change and include region-specific issues.
- Explain how temperature and precipitation patterns are altered by natural events (e.g., El Niño and volcanic eruptions) and by human influences, including deforestation, urbanization, and the production of greenhouse gases (e.g., carbon dioxide and methane).
- Explain how changes in the geometry of Earth's orbital parameters relative to the Sun cause seasonality in climate.
- Describe the different climatic zones and the four major factors affecting climate: latitude, elevation, proximity to bodies of water, and position relative to mountains. Analyze data relating to the concentration of atmospheric CO2 over the past 100 years.
Questions?
If you have any questions, please post them to our Questions? discussion forum (not e-mail), located under the Discussions tab in Canvas. I will check that discussion forum daily to respond. While you are there, feel free to post your own responses if you, too, are able to help out a classmate.
Lesson Overview
To properly understand the varying effects of climate on the Critical Zone, we must understand Earth's atmosphere and the range of phenomena that occurs within it. In this lesson, we will explore the basic structure of the atmosphere, the carbon cycle, basic atmospheric chemistry, atmospheric carbon dioxide, and greenhouse gases, radiative forcing, physical climate processes and feedbacks, and regional climate issues. We will briefly consider the links between the atmosphere and the Critical Zone throughout the lesson.
As you read through the assigned material, you should always make note of and consider the potential link between the subject matter and the Critical Zone. For example, what effect does atmospheric chemistry have on the Critical Zone and how are they linked? We will return to considering these links in more detail later in this lesson and in Lesson 12.
Much of our understanding of the atmosphere and climate system derives from the recent focus on the impact of human society on the greenhouse gas content of the atmosphere and global climate change. The Intergovernmental Panel on Climate Change (IPCC) [49] (go there and read "About IPCC") is a scientific panel established by two organizations of the United Nations in 1988 to evaluate the risk of climate change from human activity. The main activity of the panel is to publish special reports based on assessments of peer-reviewed and published scientific literature—four reports have been published in three volumes each, the most recent in 2007. Much of the background information and reading for Lesson 2 was culled from the 3rd and 4th assessment reports.
Did you know . . . ?
In 2007, the IPCC received a Nobel Peace Prize for its work. Among the 2,000 contributors (including Al Gore), there were five Penn State faculty who shared in the prize: Michael Mann, Richard Alley, Bill Easterling, Klaus Keller, and Anne Thompson were all substantial contributors to the Intergovernmental Panel on Climate Change.
What will we learn about in Lesson 3?
- Fundamentals of the atmosphere
- Overview of the climate system
- C cycle and atmospheric CO2
- Basic atmospheric chemistry
- Greenhouse gases
- Radiative forcing
- Physical climate processes and feedbacks
- Regional climate issues
What is due for Lesson 3?
Lesson 3 will take us one week to complete. As you work your way through these online materials for Lesson 3, you will encounter additional reading assignments and hands-on exercises and activities. The chart below provides an overview of the requirements for Lesson 3. For assignment details, refer to the lesson page noted.
Please refer to the Calendar in Canvas for specific time frames and due dates.
| ACTIVITY | LOCATION | SUBMITTED FOR GRADING? |
|---|---|---|
| "Calculating Carbon Footprints" | page 6 | Post to the Lesson 3 - Carbon Footprint discussion forum, then discuss. |
Questions?
If you have any questions, please post them to our Questions? discussion forum (not e-mail), located under the Discussions tab in Canvas. I will check that discussion forum daily to respond. While you are there, feel free to post your own responses if you, too, are able to help out a classmate.
Climate Dynamics
The field of climate dynamics studies the processes that control the climate system and how it evolves. The climate system is controlled by the interaction of the atmosphere, the oceans, [50] the land surfaces, the cryosphere, and the biosphere, averaged over time-scales of weeks to centuries and millennia. Climate can be classified [51] into spatial zones based on, for example, regional similarities in temperature and precipitation—these zones [52] often contain similar biotic elements from region to region.
The primary energy that drives Earth's climate system and sustains life is solar heat [53] and light. The amount of solar energy that reaches Earth’s surface varies because of latitudinal position on the planet, internal solar processes, changes in Earth's orbit, Earth's albedo [54], changes on Earth such as major volcanic eruptions of dust that block the incoming solar energy, or changes in atmospheric composition. Earth's energy balance is complex. About 30% of incoming solar energy is reflected back to space, with 70% being absorbed by the atmosphere and surface of the planet.
To get a better overview of the climate system, there are three reading assignments I would like you to complete before we proceed. Once you have completed these three reading assignments, continue with this online lesson.
Reading Assignment
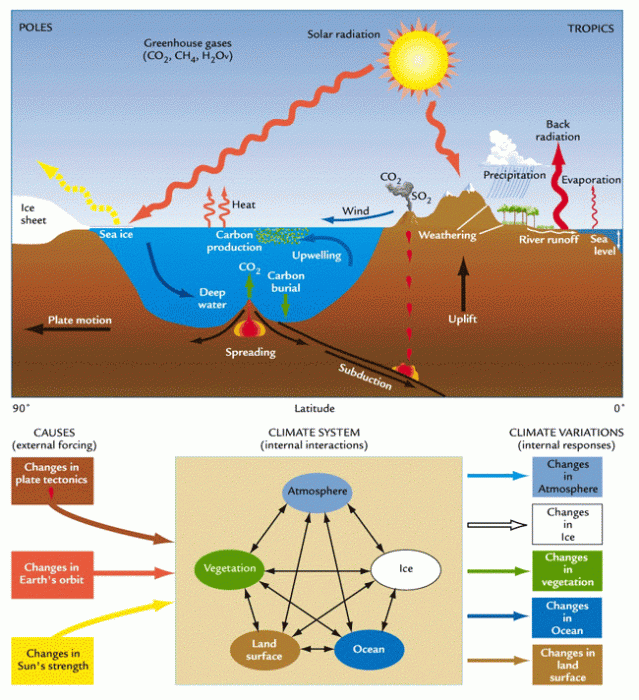
In succeeding portions of this lesson, you will explore some of the topics described in the chapter in more detail, but it is the generalized overview of the material presented in the chapter that I am most interested in seeing you master. On the first page of the chapter you will find a definition of the climate system as "an interactive system consisting of five major components: the atmosphere, the hydrosphere, the cryosphere, the land surface and the biosphere, forced or influenced by various external forcing mechanisms, the most important of which is the Sun." Confusingly, this sounds a lot like descriptions of the Critical Zone we read in Lesson 1! Remember: While the Critical Zone consists of portions of these "spheres," the central component of the Critical Zone is soil, the consequence of complex processes operating at the interface between the "spheres."
- Earth's Atmosphere [56]
Before we begin to explore some of the intricacies of Earth's climate, I would like you to review some basic information about the structure and composition of Earth's atmosphere, available on NOAA's Web site. The terminology presented there will provide you with the background to better understand the remainder of the lesson. - Introduction in the IPCC Fifth Assessment Report: "Climate Change 2013 The Physical Science Basis" [57]
This chapter provides an excellent description of climate entitled "Key concepts in Climate Science". Read the chapter, noting that:
- the glossary for the entire report is available at IPCC Glossary [58];
- the other chapters mentioned in the overview are available online but are not required reading for this lesson; and
- the final section of the chapter, entitled "A Road Map to this Report," is also not required reading for this lesson.
- Atmospheric Chemistry [59]
The chemistry of Earth's atmosphere is governed by numerous complex reactions studied by atmospheric scientists. Though the next portion of Lesson 2 is primarily focused on the carbon cycle, I would first like you to explore some of the most basic concepts of atmospheric chemistry presented at Wikipedia.
Want to learn more?
(Optional) Read Chapter 10 (pp. 419–460) in
- Wallace, J. M. (2006). Climate Dynamics. In Atmospheric Science: An Introductory Survey, International geophysics series. (2nd ed.). Amsterdam: Elsevier Academic Press.
This chapter is available through Library Reserves. Do not focus on the details of this chapter and do not worry about references to earlier chapters, figures, etc. Your primary goal should be a very generalized understanding of the climate system, always considering in the back of your mind what implications this information may have to the Critical Zone.
Check out these Climate Education Modules [60] for teachers. The website was created and is hosted by North Carolina State University, and pays particular attention to the southeast of the U.S. However, the website provides links to relevant National Science Education Standards and many pages include classroom activities.
Carbon Cycle and Atmospheric CO2
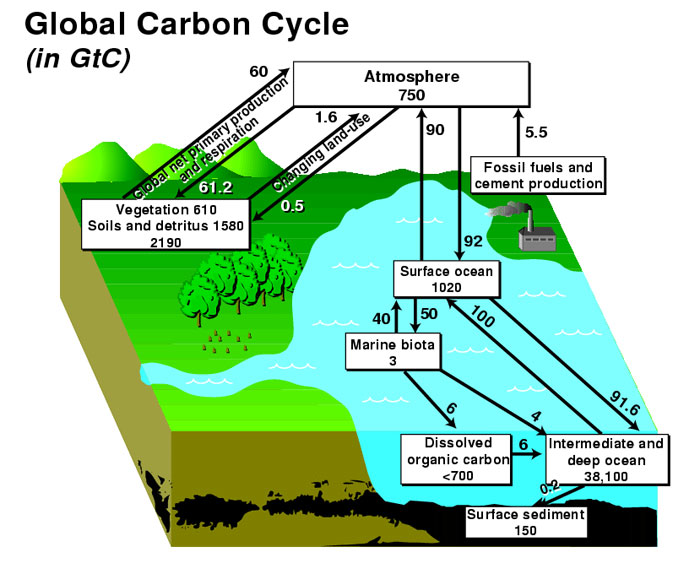
The Global Carbon Cycle
The biogeochemical cycle in which carbon is exchanged between Earth’s terrestrial biosphere, hydrosphere, geosphere, and atmosphere is called the carbon cycle. The global carbon budget is the balance of the fluxes of carbon between these four reservoirs. The terms source or sink define whether the net carbon flux is out of or into the reservoir, respectively.
Atmospheric carbon dioxide
The carbon cycle is of interest to understanding climate because it includes two of the most important greenhouse gases: carbon dioxide (CO2) and methane (CH4). Most atmospheric carbon is in the form of CO2, while CH4 is present only in trace concentrations. Because CO2 is chemically inert, it is relatively well mixed within the atmosphere away from forest canopies, whereas CH4 is chemically active and is removed quickly from the atmosphere through oxidation to CO2 and water. The overall atmospheric concentration of these greenhouse gases has increased during the past century and contributed to global warming.
Carbon is removed from the atmosphere through:
- the photosynthetic conversion of carbon dioxide into carbohydrates by plants, releasing oxygen in the process;
- the formation of carbonic acid as circulating ocean surface waters cool near the poles, thereby absorbing more atmospheric CO2;
- the conversion of reduced carbon to organic tissues or carbonates to hard body parts, such as shells, by marine biota in ocean surface waters; and
- the reaction between carbonic acid and silicate rock that leads to the production of bicarbonate ions, which are carried to the ocean and eventually deposited in marine carbonate sediments.
Carbon can be input to the atmosphere by a variety of processes, including:
- plant and animal respiration, an exothermic reaction that involves the breakdown of organic molecules into CO2 and water;
- decay by fungi and bacteria that break down carbon compounds in dead animals and plants and convert the carbon to CO2 if oxygen is present, or methane if not;
- organic matter combustion (including deforestation and burning fossil fuels), which oxidizes carbon-producing CO2;
- cement production, when limestone (calcium carbonate) is heated to produce lime (calcium oxide), a component of cement, and CO2 is released;
- release of dissolved CO2 back to the atmosphere through warming of surface ocean water; and
- release of water vapor, carbon dioxide, and sulfur dioxide from volcanic eruptions and metamorphism.
Oceanic Carbon
Inorganic carbon is readily exchanged between the atmosphere and ocean, exerting an important control on the pH of ocean water. Carbon is released to the atmosphere at oceanic upwelling sites, whereas regions of downwelling transfer carbon from the atmosphere to the ocean. When carbon (CO2) enters the ocean, carbonic acid is formed by the reaction: CO2 + H2O = H2CO3. Carbonic acid dissociates to form bicarbonate ions (HCO3-), the form in which most of the carbon in the oceans exists; lesser amounts of carbon exist as carbonic acid (H2CO3 or dissolved CO2), and carbonate ions (CO32-) paired with calcium and magnesium and other cations. Marine organisms build their skeletons and shells out of the minerals calcite and aragonite (CaCO3) through the incorporation of bicarbonate ions. These minerals dissolve after the death of the organism, but some of the material settles to the sea floor where it can be buried and stored in the form of limestone.
Carbon in the Biosphere
Carbon is an essential part of life on Earth. It plays an important role in the structure, biochemistry, and nutrition of all living cells. Autotrophs are organisms that produce their own organic compounds using carbon dioxide from the air or water they live in. This lifestyle requires an external source of energy, for example, the absorption of solar radiation in the process called photosynthesis, or the exploitation of chemical energy sources in a process called chemosynthesis. The most important autotrophs for the carbon cycle are trees in forests and phytoplankton in the ocean.
Large quantities of carbon pass between the atmosphere and biosphere on short time-scales: the removal of atmospheric carbon occurs during photosynthesis, following the reaction CO2 + H2O = CH2O + O2, while most carbon leaves the biosphere through respiration, a reversal of the previous reaction in which an amount of energy equivalent to that absorbed during photosynthesis is released as heat. When oxygen is present, aerobic respiration occurs, which releases carbon dioxide into the surrounding air or water. Otherwise, anaerobic respiration occurs and releases methane into the surrounding environment, which eventually makes its way into the atmosphere or hydrosphere.
The biosphere is capable of storing ~10% of atmospheric carbon at any given time. However, carbon storage in the biosphere is influenced by a number of processes on different time-scales: while net primary productivity [62] follows seasonal and annual cycles, carbon can be stored up to several hundreds of years in trees and up to thousands of years in soils. Changes in those long-term carbon pools may thus affect global climate change (view this example of changes to soil) [63].
Carbon in the Geosphere
Organic and inorganic carbon reservoirs in Earth's crust are large with long residence times. Carbon enters the geosphere through the biosphere when dead organic matter (such as peat or marine algae) becomes incorporated into fossil fuels like coal and organic-matter-rich oil and gas source rocks, and when shells of calcium carbonate become limestone through the process of sedimentation briefly described above. These carbon reservoirs can remain intact, that is, the carbon can remain stored within them, for many millions of years. Eventually, most rocks are uplifted and subjected to exposure to the atmosphere where they are weathered and eroded, or they are subducted, metamorphosed, and erupted through volcanoes, returning the stored carbon back into the atmosphere, ocean, and biosphere. Our society's dependence on fossil fuels bypasses this natural process by moving as much carbon from the geosphere to the atmosphere in a single year as what might otherwise require hundreds of thousands or millions of years. In Pennsylvania, when we strip mine and burn coal we are in effect releasing the atmospheric carbon dioxide and stored energy of the sun that has been buried for over 300,000,000 years!
Watch this!
On a trip to Bear Meadows, near the University Park campus of Penn State, I describe atmospheric carbon and organic carbon storage in the Critical Zone.
Video: A Trip to Bear Meadows (5:40)
TIM WHITE: I've traveled to Bear Meadows, a national natural landmark, about eight miles southeast of Penn State's main campus in central Pennsylvania. I've brought you here today to describe the relationship between atmospheric carbon dioxide content and organic carbon storage at the surface of the Earth within the critical zone. Let's go have a look at the bog.
Bear Meadows is a peat bog that began forming nearly 10,000 years ago, shortly after northwestern and northeastern Pennsylvania were covered by vast ice sheets that extended far to the north into the Hudson Bay region and Canada. The closest those ice sheets reached to State College and the Penn State campus here was northeast of Williamsport, nearly 30 miles away. One of the tasks I'd like to accomplish while we're here is to probe the peat in the bog and have a look at what it's made of, and so to do that I'm going to walk along the edge of the bog-- in the background you can see where I'm going to go-- and I'm going to get my soil auger so I have a way to probe and sample the peat.
Recall that plants use water, atmospheric carbon dioxide, and energy from the sun to build their organic framework through photosynthesis. Therefore, plants draw down atmospheric carbon dioxide as part of their life habit. When plants die, the organic matter is oxidized and carbon dioxide is returned to the atmosphere.
This wet, boggy setting is perfect for the preservation of organic matter and organic carbon. If you look beneath the water's surface, you can clearly see various organic constituents related to the plants that live around in the bog. I can see maple leaves and abundant roots associated with these grasses. If plants die and their various organic constituents are preserved, as is the case here in the bog, the original carbon in the atmospheric carbon dioxide that was photosynthesized by the living plant is also stored or preserved, rather than being returned to the atmosphere through decay. We call the site of such processes a carbon sink.
I'm probing the peat with an auger to see how deep I can get to the base of the bog to see if I can get a peat sample from the base of the bog here. You can see that I've penetrated over a meter of the peat and I've obtained a sample from the base of the bog. And you can see that the peat down there is made up of a fine organic muck, along with a number of roots and some grass leaves, similar to what you'd find right here at the surface.
Further out in the bog, there are places where 15 feet of peat have accumulated over the last 8,000 or so years. That means that 8,000 years ago, carbon was removed from the ancient atmosphere, stored here in the peat, and remains today. One last thought before we leave and that relates to the time scale of organic carbon storage in the critical zone. I've told you that organic matter has been accumulating here over the last 8,000 years, but this setting exists within the Appalachian Mountains and the fate of mountains ultimately is to be eroded, which is happening to these mountains today. So while this organic carbon remains stored here now, over long geologic time scales-- hundreds of thousands to millions of years-- this peat will be oxidized and that ancient organic carbon would be returned to our modern atmosphere.
Next, visit a Pennsylvania coal seam and nearby electric generating station to learn about the relationship between Bear Meadows and the burning of coal.
Video: Visit to a Pennsylvania Coal Seam (02:52)
Coal Seams and Electricity Generation near Shawville, PA
[Tim is standing next to a coal seam.]
The geologic, economic, and cultural history of Pennsylvania is steeped in this state's naturally occurring abundance of coal. To give students an opportunity to view coal in its natural setting, I like to come here, Curwensville Dam, about 45 miles northwest of State College.
[Here you can see two coal seams, one directly in front of me and one a little bit further up on the slope. Coal is peat that's been deeply buried in the earth and subjected to high pressures and temperatures. Remember at Bear Meadows, we looked at peat and we were able to see the various plant constituents from which it's made.
We also discussed that those plant constituents at the bottom of the bog were 8,000 years old and contained 8,000-year-old atmospheric carbon dioxide. These coal seams are over 300 million years old. They formed from vast peat swamps that existed along the margins of a large interior seaway that flooded much of North America at the time. So when we dig up and mine these coals, and use them to fire our electric generating stations and the computers you're using today to view this video, we're releasing 300 million-year-old carbon dioxide into our present-day atmosphere.
[looking out a car window at the Shawville Generating Station]
We're approaching the Shawville Generating Station. At this power plant, which is just about 15 miles from the Curwensville coal outcrop we just visited, coal is burned to produce electricity for local and regional consumption.
[Dr. White standing in front of the generating station]
At numerous coal-fired electric generating stations around the state, coal is burned to produce electricity. And it's through this process that Pennsylvania produces 1% of total global human carbon dioxide emissions in any given year.
In subsequent lessons, we will examine and discuss the effects of anthropogenic carbon dioxide emissions and climate change on critical zone processes.
Greenhouse Gases, Aerosols and Radiative Forcing
Earth's surface temperature and climate are controlled by the amount of radiation received from the Sun: when incoming radiation is greater than outgoing radiation the Earth is warmed, and vice versa. Changes in the balance between incoming and outgoing radiation are referred to as radiative forcing. While the intensity or energy output from the Sun varies through time, other Earth-bound processes affect radiative forcing. For example, the gaseous and particulate composition of Earth's atmosphere plays an important role in controlling the energy balance. Changes in the natural landscape and human land-use also influence radiative forcing.
Reading Assignment
- Visit the EPA's Atmospheric Changes [64] site to learn more about the interaction between the greenhouse gas and aerosol composition of Earth's atmosphere and radiative forcing. Note: when you go to this site you'll find that the content is no longer available - I left this link in place so that you can experience the manner in which politics can play a role in science. The same goes on the next page, and assignment, relating to the use of information once provided by the US EPA.
- See https://19january2017snapshot.epa.gov/climate-change-science/causes-climate-change_.html [65] for what used to be the above link.
- Also, visit the UNEP's Radiative Forcing [66] page to better understand the effects of human activity on the composition of the atmosphere and Earth's climate.
Calculating Carbon Footprints
Three processes have contributed to human-induced increases in the carbon dioxide content of Earth’s atmosphere. Two of these processes concern emissions: increasing global economic activity and an increase in the use of fossil fuels to drive the economy. The third process is a suggested decline in the efficiency of CO2 sinks on land and oceans in absorbing human emissions. These changes characterize a carbon cycle that is forcing stronger-than-expected and sooner-than-expected climate change.
The United States ranks first in total and per capita emissions among the top twenty carbon dioxide-emitting nations and is responsible for more than 22% of the total annual carbon dioxide introduced to the atmosphere by human activity. For perspective, the United States population stands at ~4.5% of the total global population—our society’s profligate lifestyle is supported by our consumption of a greater proportion of Earth’s resources than the rest of humanity and therefore translates to a greater share of the waste products of human activities, in this case, human inputs of carbon dioxide to the atmosphere.
Although the United States Federal government has a policy regarding greenhouse gas emissions and climate change (see U.S. Climate Policy and Actions [67]), each citizen, church, school, and business—all of us—can play a role in reducing our nation’s carbon dioxide input to the atmosphere. Reducing the amount of energy we use is one important step in the effort to reduce carbon dioxide emissions. To do so, we must first inventory our carbon dioxide emissions by identifying the energy-intensive activities we partake in throughout our day-to-day lives.
Go here to find information that was once available through the link above: January 19, 2018 Snapshot [68].
You may also be interested in exploring the U.S. Climate Resilience Toolkit [69], designed to help citizens, communities, businesses, and others to manage climate-related risks and to improve resilience to extreme events.
Activity
Directions
For this activity, you are to use three different "calculators" to calculate your own carbon footprint. As you use the three calculators, consider these questions:
- How do the results compare between calculators?
- To what activity(ies) do you attribute a majority of your personal emissions?
- How might you best accomplish a reduction in your carbon dioxide emissions?
- What percentage of total U.S. emissions derive from household emissions versus industry, government, etc.?
- How might widespread reduction (halved) of U.S. household emissions contribute to a reduction in total U.S. emissions?
- In a general sense, how might a business-as-usual approach versus a reductionist approach influence climate change and Critical Zone processes?
- Are there any activities you can engage in that will benefit soil, the central component of the Critical Zone, at the same time as reducing your personal carbon footprint?
I ask you to be honest, with yourselves, with me, and with your classmates. Remember: On average, the U.S. citizenry’s carbon dioxide emissions are grossly out of balance with the rest of Earth’s human inhabitants, so we all play a role in current emission levels. Let’s see what we can learn through a non-judgmental assessment of our community’s lifestyles.
- To begin, use the calculator located at the following Environmental Protection Agency (EPA) Web site:
- Personal Emissions Calculator [70]
- The EPA calculator is no longer easily available, if at all. Please Google Carbon Footprint calculator and choose a calculator to go along with choosing others described in step 2. Provide a sentence in your report that names the calculator and provide the relevant URL.
- Next, use two more calculators, either from the list found on the EPA site or using the one below:
- Once you have accomplished these simple personal calculations, use the same calculators you just used to calculate the carbon footprint for your school or business. Address similar questions as above.
Submitting your work
- Enter the "Lesson 3 - Carbon Footprint" discussion forum in Canvas.
- Post a summary of your responses to the questions above for both your personal carbon footprint and your school/business carbon footprint.
- Read postings by other EARTH 530 students to compare your ideas and experiences.
- Discuss! Respond to at least one other posting by asking for clarification, asking a follow-up question, expanding on what has already been said, etc.
Grading Criteria
You will be graded on the quality of your participation. See the grading rubric [47] for specifics on how this assignment will be graded.
Check this out!
Interested in determining the potential C footprint for a planned building construction or retrofit? See: the Green Footstep website [72] to learn how to plan and design for C neutrality.
Also, visit Global Footprint Network [73] for yet another C footprint calculator as well as an assessment of various country's standing with respect to their C emissions and more.
Summary and Final Tasks
Earth's atmospheric processes and climate may be the most influential factors involved in soil formation in the Critical Zone because processes like precipitation and temperature control weathering over large geographic regions. Once we grasp their importance we begin to properly understand the varying effects of climate on the Critical Zone. In this lesson, you read a lot of material describing these processes, learned about the Intergovernmental Panel on Climate Change (IPCC), performed a carbon footprint calculation, and applied knowledge gained during the calculation to consider Critical Zone-relevant issues of personal and societal behavior.
By now you should feel comfortable describing: components of the climate system and the basic natural and anthropogenic forces that affect the climate system; the carbon cycle and fundamental atmospheric chemistry; and radiative forcing of climate change. In the next lesson you will apply this knowledge to understanding paleoclimates (ancient climates), and from there determine how our knowledge of paleoclimates helps us to understand ongoing and future climate change.
Reminder—Review the Lesson 3 Overview
You have reached the end of Lesson 3! Double-check the list of requirements on the Lesson 3 Overview page to make sure you have completed all of the activities listed there.
Tell us about it!
If you have anything you'd like to comment on or add to, the lesson materials, feel free to share your thoughts with Tim. For example, what did you have the most trouble with in this lesson? Was there anything useful here that you'd like to try in your own classroom?
Unit 3, Lesson 4: Climate (2)
Lesson 4 Introduction
We will now turn our attention toward the evolution of Earth's atmosphere and ocean system through geologic time, specifically focusing on our understanding of paleoclimatology (ancient climates). We will consider potential lessons from this knowledge of ancient climate under so-called greenhouse and icehouse conditions. In particular, I will ask you to consider how this knowledge can aid our predictions of, and planning for, future climate change.
What will we learn about in Lesson 4?
- Paleoclimatology—climate variability and change
- Evolution of atmosphere and ocean system
- Abrupt climate change
What is due for Lesson 4?
Lesson 4 will take us one week to complete. As you work your way through these online materials for Lesson 3, you will encounter additional reading assignments and hands-on exercises and activities. The chart below provides an overview of the requirements for Lesson 4. For assignment details, refer to the lesson page noted.
Please refer to the Calendar in Canvas for specific time frames and due dates.
| ACTIVITY | LOCATION | SUBMISSION INFORMATION |
|---|---|---|
| Short (2–3 page) paper on "Exploring the links between paleoclimatology, the Critical Zone, and modern society" | page 4 | Post to the Lesson 4 - Paleoclimatology Activity dropbox in Canvas |
Questions?
If you have any questions, please post them to our Questions? discussion forum (not e-mail), located under the Discussions tab in Canvas. I will check that discussion forum daily to respond. While you are there, feel free to post your own responses if you, too, are able to help out a classmate.
Paleoclimatology
Paleoclimatology, the study of ancient climates, has become increasingly recognized as a socially relevant tool for unraveling the causes and consequences of ongoing and future climate change. Scientists use the knowledge and insight gained from reconstructing ancient episodes of climate change to better understand how Earth's future climate may behave during climate states not experienced during recorded human history. In addition, a complete understanding of natural climate variability allows us to better identify and understand the role of human activity on climate change. For example, we know that ancient episodes of warmth have occurred in which crocodile-like reptiles and subtropical forests thrived throughout the high arctic. During these times, the atmospheric hydrologic cycle was amplified, the quantity of precipitation was elevated and more broadly distributed, and weathering and soil formation were intensified with tropical soil-forming conditions extending into the mid- to high-latitude regions of the planet.
Did you know . . . ?
Tim and colleagues are working to reconstruct one such interval in Earth history the Paleocene-Eocene Thermal Maximum.
To begin to understand the ties between this work and the carbon cycle, view this video from Svalbard.
Video: A Visit to Svalbard, Norway (02:15)
[MUSIC PLAYING]
TIM WHITE: I'm Tim White. I'm a sedimentary geologist and a paleoclimatologist at Penn State. And I've come here for a variety of reasons. One, to look at siderite-bearings paleosols that I use to reconstruct ancient atmospheric hydrologies during greenhouse warming episodes. I do that work with my colleague Dave Pollard and Chris Poulsen, who do the modeling of the data that I generate.
This is the Longyearbyen Glacier. We've been spending at least three full days hiking up along the lateral moraine. To the right, you can see the old coal workings from the early 1900s. And at the very most top hill are some of the formations that we've been working on.
You can see all the relics of mining. And maybe even now, you can see that there are red colors up on the slope. Those are places where the coal seams burn, as a result of German shelling of this mining town during World War II.
This is the only coal mine in Scandinavia, even today. So at the time, it was a very important part of the allied economic strength, if you can call it that. So the Germans were determined to knock out whatever they could.
They still burn the coal today, and that's what powers this entire town. And you can even see a little bit of-- well, I don't want to call it smog, but you can see smoke emanating from the coal-burning power plant right there. And it's kind of funny, being here near the top of the world, seeing coal being burnt, while we're here to study one of the more extreme greenhouse episodes in Earth history.
[MUSIC PLAYING]
Another example is in the Sahara Desert, where geologists have found ample evidence for the presence of widespread, deep freshwater lakes throughout the desert region as recently as 9,000 years ago, evidence for profound climate change in the intervening time. Imagine the difference this environmental change had on the habitability and presence of life in the region (learn more . . . [74]).
In some places in Pennsylvania, deposits from these episodes are visible at the surface; in other portions of the state, relict glacial deposits attest to the fairly recent presence of thick and vast ice sheets that extended far to the north into Canada a short 18,000 years ago.
(Where is Svalbard? [75])
Watch this!
The record of paleoclimate variation in Pennsylvania includes very ancient paleosols formed during episodes of tropical climate conditions to the more recent deposits of vast ice sheets that extended far to the north into Canada. To learn more view the following video.
Video: Paleoclimatology and Pennsylvania's Ancient Climate (04:19)
[MUSIC PLAYING]
DR. TIM WHITE: Paleoclimatology is the study of ancient climates. In our next lesson, we'll consider aspects of paleoclimatology that involve computer modeling, and you'll meet one of my colleagues who uses computer models to understand ancient climates.
But now I'd like to show you some of the geologic evidence for past climate change that serves as the backdrop from which modelers ply their trade. Earth has undergone many drastic shifts in climate outside those experienced by humanity. For example, here in middle-latitude Pennsylvania, we experience a moist, continental climate that sustains our expansive deciduous forests and agricultural pursuits.
However, Pennsylvania has not always experienced an equable climate. 360 to 370 million years ago, during the Devonian Period, portions of Pennsylvania were covered by a broad, coastal plain next to a large inland sea that existed to the west in the interior of North America. North America was positioned in the Southern Hemisphere at this time.
Notice the gray to green resistant layers behind me, and these reddish recessive layers right here at my feet. The resistant layers are sandstones that were deposited in river channels. Whereas these recessive layers were deposited in the ancient floodplain, where soils formed during that time.
Notice these nodules within the reddish recessive layers. These nodules are calcite formed in soils in the ancient floodplain of the Devonian. These nodules help us to identify these paleosols as calcic Aridisols formed in a much dryer climate than Pennsylvania experiences today-- perhaps similar to West Texas or northwestern Argentina now.
If you need to, return to the lesson on soils and review the modern Aridisol distribution map. You'll find that Aridisols are developed within and along the fringes of many of our modern deserts. And so this ancient setting was much dryer than the climate we experience today, and, in part, can be described by North America's position south of the equator during this time.
[MUSIC PLAYING]
We're in the so-called barrens just northwest of State College, and we're trying to make our way over to that little exposure there, which is in an old bauxite mining pit from the 1870s.
In contrast to the red Devonian calcic Aridisols that we just viewed, these paleosols behind me are oxisols formed sometime between about 15 and 50 million years ago in a very warm and wet tropical setting. Notice the light gray to white color of the soil matrix. The tropical weathering conditions were intense enough to leech most of the elements and nutrients from the soil profile, hence the dull or plain color of the matrix.
You can also see that the profile's much thicker than Devonian paleosols, or any of the soils that we visited in the Introduction to Soils video. This thickness is a tribute to the intense, tropical weathering conditions that existed here deep in the past.
During the time when these paleosols formed, Pennsylvania was located approximately in the same position as it is today. So the presence of these oxisols here indicate that tropical weathering conditions were much more widespread during this deep-time episode of global warmth.
[MUSIC PLAYING]
Reading About Paleoclimatology
Reading Assignment
Before we delve into the specifics of paleoclimatology, I want you to understand current views on the evolution of Earth's atmosphere and ocean system. Much of this information is highly theoretical, based on scant geologic evidence from the very distant past and computer models. However, this information will provide you with a baseline comprehension of natural variations in Earth's climate, for comparison to human-induced (or anthropogenic) causes of climate change.
I also want you to understand how politics can influence science. Some of the links below, specifically those from the US Environmental Protection Agency for Past and Recent Climate Change, are archived and not easily available - this is a function of a different attitude toward climate change research from our current president and his admininstration. Thus, I have provided other links to similar material though I encourage you to explore the EPA links anyway.
- View the short video entitled Life before Oxygen [76].
- Read the following book selections, which are available online through Library Reserves.
- pp. 193–95, and Chapter 11 (pp. 207–29) in Kump, L. R., J. F. Kasting, & R. G. Crane. (2004). The Earth System (2nd ed.). Prentice-Hall.
Pay attention to understanding the role of life in the development of the atmosphere, in particular to the content of atmospheric oxygen and various greenhouse gases.
- pp. 193–95, and Chapter 11 (pp. 207–29) in Kump, L. R., J. F. Kasting, & R. G. Crane. (2004). The Earth System (2nd ed.). Prentice-Hall.
- Review the following Web sites:
- NOAA Paleoclimatology Branch [77]—Paleoclimatologists rely on data collection from a variety of sources, and they require the application of powerful computer climate models to understand the data collected from the field. The National Oceanic and Atmospheric Administration (NOAA) houses the National Climatic Data Center, which includes the Paleoclimatology Branch, the world's largest archive of climate and paleoclimate data. The scientists/administrators at/of the Paleoclimatology Branch join with international partners to expand the application of paleoclimatic data to understanding ongoing and future climate change. This site provides an excellent introduction to paleoclimatology and some of the lessons learned from the past—look to the left at this site, choose the PaleoPrimer link under Outreach, and work through the various headings on the left (what is paleoclimatology, why study climate, how is it studied, etc.), including following the hotlinks on each page. Once you have completed this task, return to the Paleoclimatology home page and familiarize yourself with other Outreach products that are available and may be useful for your classroom (slidesets and climate timeline).
- Past Climate Change (EPA) [78]—Another excellent resource is available through the U.S. Environmental Protection Agency. At their site you will learn about natural causes and rates of climate change, specifically focused on the past 2,000 years. Many of the links at this site either guide you back to the NOAA Paleoclimatology site or to a glossary, while others guide you to the U.S. Geological Survey (USGS), National Atmospheric and Space Administration (NASA), and the National Research Council (NRC), all Federal agencies with a role in understanding climate change.
- Instead, consider visiting NASA [79] for information relevant to the no-longer-available EPA website.
- Recent Climate Change (EPA) [80]—Finally, visit this EPA site to learn about the most recent and ongoing climate change and the role of human society in this change. You will find some overlap in material, particularly when following the links, but this should serve to expand and reinforce your knowledge base and understanding of paleoclimatology and its relevance to society.
- But since the relevant pages are down, have a look at Climate Change Research [81].
Paleoclimatology Activity
Activity
In this assignment, you will begin to explore the links between paleoclimatology, the Critical Zone, and modern society.
Directions
- View the short video entitled "Earth System: Ice and global warming [82]" (See transcript [83]) and the slide shows entitled "Glaciers [84]" and "Documenting glacial change [85]. [86]"
As you view these visual resources, consider the following questions.- Do glaciers play any role in parent material aspects of soil formation? If so, what role?
- How might sea level variations associated with the waxing and waning of glacial ice sheets affect soil formation?
- How might Critical Zone processes be altered in regions not covered by but near to glaciers?
Consider each of the state factors of soil formation in this manner.
- Having viewed the video and considered the leading questions, visit the Pennsylvania Topographic and Geologic Survey Web site to learn more about glaciation in Pennsylvania [87].
- Follow the link to Map 59, "Glacial deposits of Pennsylvania," near the bottom of the page.
- Briefly describe, in no more than two double-spaced pages, your thoughts on the aforementioned leading questions applied to Pennsylvania (if you are not from Pennsylvania, feel free to pursue a similar activity for your home state, but please clear this with me first!).
Next, carefully study the map below, then learn more about laterites [88]. Mid-Cretaceous refers to a broad expanse of geologic time from ~120,000,000 to 85,000,000 years ago, when the planet was generally much warmer than today with, for example, dinosaurs stomping around in sub-tropical forests near both poles. As you read about laterites you may want to refer back to knowledge gained in our lesson on soils and soil orders, specifically the geographic distribution of oxisols.
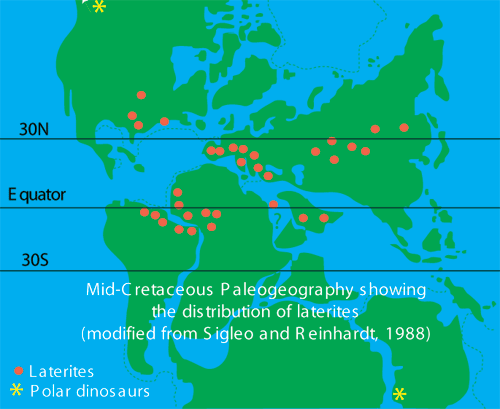 Map of Mid-Cretaceous Paleogeography showing the distribution of laterites.Image source: Dr. Timothy White, The Pennsylvania State University, 2008. Modified from Sigleo and Reinhardt, 1988)
- Continue the document you began for Step 4, above, by answering the following questions in no more than one additional double-spaced page:
- What do you notice about the distribution of laterites during the Mid-Cretaceous compared to their modern distribution?
- What state factor(s) in soil formation are these distributions most dependent upon?
- List some of the potential implications of your observations to Earth's not-too-distant-future Critical Zone. Specifically, consider the possible effects on agriculture and society's ability to produce sufficient food to feed our ever-expanding population.
- Save your paper as either a Microsoft Word or PDF file in the following format:
L4_paleoclimatology_AccessAccountID_LastName.doc (or .pdf).
For example, student Elvis Aaron Presley's file would be named "L4_paleoclimatology _eap1_presley.doc"—this naming convention is important, as it will help me make sure I match each submission up with the right student!
Submitting your work
Upload your paper to the "Lesson 4 - Paleoclimatology Activity" dropbox in Canvas (see the Modules tab) by the due date indicated on our Canvas calendar.
Grading criteria
You will be graded on the quality of your writing. You should not simply write responses to the questions and submit them to me. Instead plan on writing a short stand-alone paragraph (or page or whatever you decide is necessary considering any constraints I might have placed on you) so that anyone can read what you've written and understood it. You should strive to be specific and complete in responding to the questions. Your answers should be analytic, thoughtful and insightful, and should provide an insightful connection between ideas. The writing should be tight and crisp with varied sentence structure and a serious, professional tone.
Abrupt Climate Change
Those of us fortunate enough to have experienced Earth sciences in primary and secondary school probably learned about gradual climate change through geologic time, such as the gradual waxing and waning of continental-scale ice sheets during the last ice age. This view of paleoclimate change is appropriate in the context of Earth history and geologic time. However, more recently, paleoclimatologists have gathered evidence for widespread abrupt changes in climate that occurred in the not-too-distant past, on time-scales equivalent to a human lifetime. For those who are attentive to these issues, this realization has served as a "wake-up call" to action—humanity's effect on atmospheric composition and climate change may push the climate system toward a "tipping point" from which rapid regional and global changes in climate of unknown magnitude and duration may occur. The question remains whether human action to reduce greenhouse gas emissions can avert such events.
Reading assignment
Read the following text chapter:
- Committee on Abrupt Climate Change & National Research Council. (2002). Evidence of Abrupt Climate Change. [89] In Abrupt Climate Change: Inevitable Surprises (pp. 19–72). National Academies Press.
The first few pages of the chapter provide a brief overview of paleoclimate proxy interpretations, information you should now be familiar with and therefore can skip here if you choose. Pay particular attention to the discussion of the Younger Dryas, the most recent widespread episode of abrupt climate change for which abundant, globally distributed terrestrial and marine data has been collected.
- How much temperature change occurred during the Younger Dryas, how was it distributed regionally, and over what time frame did it occur?
- As importantly, how would a similar change in climate during your lifetime affect your lifestyle, and the lives of others in your region, in North America, and on Earth?
The concepts and terminology through this portion of the chapter should mostly be familiar to you.
When you reach the sections entitled "Patterns of Climate Variability" and "Trends Recorded Instrumentally," you may find that the terminology is unfamiliar—do not fret. Your primary focus through this portion of the chapter should be to understand that human records of recent-past climate change do exist and provide evidence for and are relevant to our understanding of ongoing and future climate change. Also, read the final section entitled "Synopsis of Observations."
Summary and Final Tasks
To properly understand and plan for the potential range of variability in Earth's future climate and its effects on the Critical Zone, we must look to the ancient past to understand that Earth's climate has experienced extremes in climate, cold and warm, outside of the span of human history. You just read a lot about paleoclimatology, learned about various government agencies that are interested in paleoclimatology, and viewed maps of glacial and extremely warm greenhouse deposits of the past to consider what socially relevant information might be gleaned from those distributions.
As you shift your attention toward Lesson 5, you should feel comfortable describing: basic concepts of paleoclimatology and the type of information that can be collected to reconstruct ancient climates; Federal agencies with ongoing research in paleoclimatology; examples of paleoclimatologic information that may be relevant to your life and society; and issues regarding the rate of climate change and what we know about the potential abruptness of climate change. In Lesson 5, we will complete Unit 3 by studying regional climate change and taking a more focused look at links between atmospheric processes and the Critical Zone.
Reminder—Review the Lesson 4 Overview
You have reached the end of Lesson 4! Double-check the list of requirements on the Lesson 4 Overview page to make sure you have completed all of the activities listed there.
Tell us about it!
If you have anything you'd like to comment on or add to, the lesson materials, feel free to share your thoughts with Tim. For example, what did you have the most trouble with in this lesson? Was there anything useful here that you'd like to try in your own classroom?
Unit 3, Lesson 5: Climate (3)
Lesson 5 Introduction
Lesson Overview
The atmosphere is a complex portion of the Earth system that greatly influences Critical Zone processes. It should be clear to you now that a wide range of climate states have existed in Earth history that fall outside of the realm of human experience. Further, you now know that these climates of the past—paleoclimates—provide us with great insight into present-day atmospheric processes and that paleoclimatic variations led to changes in Critical Zone processes of the past.
In Lessons 3 and 4, you studied modern and ancient atmospheric processes at a planetary scale. In Lesson 5 you will further explore predictive modeling of future climate change and what our best scientists and computer models predict will happen to atmospheric carbon dioxide levels, temperature and precipitation, storms, and sea level in Earth's not-too-distant future
Watch these Videos!
To better understand some of the very basic general concepts of climate modeling, I will take advantage of the nearby presence of my colleague Dave Pollard, an internationally known paleoclimate modeler and co-author of the GENESIS global climate model (GCM). Dave's depth and breadth of knowledge of computer codes, GCMs and paleoclimate will be obvious as you watch the series of videos we created and will help you to better understand and digest the readings I have assigned in this lesson.
Video: Part 1: Meet Dave Pollard (02:50)
See Transcript: Meet Dave Pollard
TIM WHITE: Hello. Welcome to my office. Perhaps now when you're communicating with me you can imagine this is where I operate from. But we're really here today because a colleague and neighbor of mine, Dave Pollard, is a paleoclimatologic modeler, and so we're going to go over to Dave's office and have a little conversation with him.
Hey Dave.
DAVID POLLARD: Hi, Tim.
TIM: How you doing?
DAVID: Fine.
TIM: You have a couple minutes to have a chat?
DAVID: Sure. Come on in.
TIM: Thanks. So when did you start climate modeling?
DAVID: I first started the simple climate modeling in grad school. I did a simple couple glacier ice sheet model of the Pleistocene ice ages. And that's when it started.
TIM: And then your post doc?
DAVID: I did a post doc in Oregon State, and I worked on-- for the first time there-- on global climate models. The big, complex, global models that Larry Gates used then. Applied to the quaternary ice ages. I later worked for NCAR, which is in Boulder, Colorado. It stands for the National Center for Atmospheric Research. They do a lot of different things there. The division I worked in was called climate and global dynamics, which mainly developed community climate global climate model that people use a lot in the United States and internationally for paleoclimate and modern and future climate modeling.
TIM: And I suppose it was at that time you created or coded Genesis?
DAVID: While I was there, my group decided to develop a global climate model specifically aimed at the paleoclimate modeling community, and so we built GCM, which stands for Global Climate Model, or General Circulation Model, and we called it Genesis. And that was in the 1980s and 1990s, and quite a lot of paleoclimate modelers used it at that time. In the late 1990s, I moved to Penn State. There was a dynamic group here led by Eric Baron at the time doing a lot of paleoclimate modeling work, and I joined that. And since then, I've worked here on Genesis climate model and also a lot on ice sheet modeling, which maybe we'll talk about a little later.
Video: Part 2: Modelling Climates (05:25)
See Transcript: Modeling Climates
TIM WHITE: You've used the term climate modeling quite a bit in describing yourself, so maybe this is a good time to tell us-- from your perspective, what is climate modeling?
DAVID POLLARD, Sr. Research Associate, Earth and Environmental Systems Institute: Well, climate modeling, and in particular global climate models, are really large computer codes. They're quite like the codes that are used for weather forecasting by the National Weather Services. But they're simplified a little bit so that they can be run instead of over a few days where you're interested in really getting the weather right tomorrow in the next four or five days so that you can run them over 10 years if you like or 100 years to get a projection of the average climate. They still have all the storms and the weather events in them simplified a little bit so they're efficient enough to run for those long-time scales.
And the other thing that's different about them is that they have a lot of other components. They're coupled to other things that interact with the weather over that time scale like snow. The thickness of snow, the temperature and amount of moisture in the soil, oceans, the effect of vegetation. That sort of thing.
How Do Climate Models Work?
Some things you have to just prescribe from observations, but then a lot of it is in the physics of the equations themselves. The things you prescribe are the amounts of sunlight coming in at the top of the atmosphere, which is determined from the current orbit the seasonal cycle of the Earth around the sun. The amount of carbon dioxide and other gases in the atmosphere. The types of vegetation that distributed around the globe.
That sort of thing. And then, when you run the model, just about everything else that you can think of to do with the weather is predicted from the equations. Air speeds, temperatures, humidities, they're all in the physics.
Climate Models and Soil
TIM: Do soils play a role in the models?
DAVID: Yes. For global climate modeling, you generally have a model of the top few meters of soil, which includes most of the critical zone. Not ground water, but the upper soil layers, which includes the seasonal cycle of temperature going down to about a meter. And what these models predict in the physics is the soil temperature and the soil moisture. The amounts of water in the pores.
TIM: And what about surface water like lakes or rivers? Are they in the model?
DAVID: Usually not explicitly. You don't predict river flow, for instance. You're not going to get the speed of the Mississippi current, but what is predicted is the local runoff averaged over soil areas. And then what you can do from that is deduce the average river output integrated over the whole Mississippi basin, for instance. And lakes are just prescribed, usually.
TIM: What about ice?
DAVID: Well, there's the seasonal snow pack coming and going, how it melts in the spring and then forms in the fall and winter, is predicted from the amounts of snowfall falling from the atmosphere. And sea ice is also predicted, which is of interest recently, because of the rapidly receding cover in the Arctic, for instance. That's included in these climate models when they apply it to the future.
But the big ice sheets, like Greenland and Antarctica today, they're prescribed. Those time scales of the variations of thousands to tens of thousands of years and these global climate models can only be run realistically, with computer power that we have for decades or a few hundred years at most at a time. So you have to prescribe these long-term features like ice sheets.
Computer Power & Coupled Modelling
Coupled modeling, which I do quite a bit, where you use tricks, really, to run these global climate models only for a few decades and then couple them to separate models of the ice sheets where you can try and then run just the ice sheet model over thousands, ten thousands, or even millions of years to predict their variations in the past.
Video: Part 3: Modelling Modern & Ancient Climates (06:00)
See Transcript: Modelling Modern & Ancient Climates
TIM WHITE: You've told us a lot about climate modeling in general, and you've alluded to some of your work in paleoclimate modeling. And I wondered if you could perhaps tell us a little bit more about some of the differences between modeling ancient climates and modern climate.
DAVE POLLARD, Sr. Research Associate, Earth and Environmental Systems Institute: Sure. You actually use the same physical model, which is a good thing. You want to use exactly the same physics in the model, be it just the general circulation model, as works for the present. And just shift that and apply that to the past. But to do that, the main thing you have to do is to change the boundary conditions.
Then that means the layouts of the components as they varied very much, if you go far back, due to plate tectonics. The amounts of carbon dioxide in the atmosphere, which could be four times, eight times, or more if you go back to the Cretaceous, say, 100 million years ago. Then if you're interested in orbits, and Milankovitch orbital perturbations over the ice ages, for instance, you set different orbital parameters. The eccentricity, the precession, and obliquity of the Earth around the Sun.
So there's a handful of those things, about four or five changes to the external boundary conditions, that you impose on the GCM. And then you simply run it, just like you would for the present, except you're simulating the climate 100 million years ago, say.
How are Ancient Climate Models Relevant Today?
So do these paleoclimate simulations have any relevance to the future and to society's concerns? And I think the answer's definitely yes. We're about to enter, in the next few centuries to millennia, unprecedented increases in greenhouse gases, which are going to warm the climate tremendously.
Now, we can attempt to just model that with models based on the present day, but if we can go back in the past to when greenhouse gases were the same levels as we anticipate, two to three to four times what they are today, that gives us an analogy. And just a means of testing the models to see if they're doing the right job for the past. And then we'll have more confidence for them in the future.
For instance, the last time that greenhouse gases were three to four times present-day amounts was in the-- before about 40 million years ago. 100 million to 40 million years ago. And we can simulate those conditions and compare with paleoclimate data that we have for those periods and see if the models are doing a reasonable job.
Another example concerns parts of the present-day ice sheets, for instance, West Antarctica and also Greenland. And it's quite hard to model those. But we've coupled ice sheet and climate models to see if they are vulnerable if they're in danger of totally disintegrating, for instance, in the case of West Antarctica, in the next 1,000 years due to increases in ocean and air temperatures caused by humans. But we can look in the past to see if those parts of the ice sheets have collapsed or not. And when they have, what were the climates that caused that, and try to simulate those with our coupled models.
Another great thing about these models is helping to communicate to the public what's really going to happen. The three-dimensionality of them means that you can make nice graphics and animation, and also run them forward in time to produce movies. And that sort of visual has a big impact and potency for the public to really see what might happen.
For instance, we can run these ice sheet models and watch the ice sheets coming and going over tens of thousands of years and through ice age cycles. And also how they might recede in the future. And so that's a great way of communicating to the public much better than dry tables and thousands of just figures that you might think.
TIM: Well, this is great. Let's have a look at some examples of your work.
DAVE: OK.
Modeling the Ice Sheets
This shows work I've done coupling global climate models with ice sheet models. And this particular experiment was aimed at the last glacial maximum, 21,000 years ago-- really recently, geologic time, when ice sheets covered a lot of the known hemispheric continents, almost all of Canada, with kilometers thick ice sheets. And it's a real mystery why they came and why they went away again over very short geologic time periods.
And the purpose of this experiment was just to see if the global climate model could produce reasonable snowfall and snow melt patterns over these ice sheets. And that's what you need to do if you think about the long term evolution of them, because what is the net annual input of mass onto the surface versus the melt? That controls whether they recede or advance. So I use the global climate model with these boundary conditions to produce maps of snowfall, snow melt, and the net balance.
TIM: We've actually discussed this episode in the class. And during this time, part of Pennsylvania was covered with ice. But I'm curious, were you able to adequately model the ice sheet?
DAVE: Yes. These amounts of snowfall and snow melt are quite reasonable from what we can deduce about what they should be at the last glacial maximum, which is actually since the ice sheets were at their maximum, they weren't rapidly receding or growing. The net input of mass should be close to zero. And that's how it works out in these simulations.
But the atmosphere and climate system are more complex than we've considered thus far. Perhaps you gained some insight into this concept when considering the ancient climate-relevant deposits and the relationship between greenhouse paleosol and modern oxisol distributions. Therefore, we will consider, in more detail, the differences in climate between regions, specifically looking at predictions of regional climate change in the United States. You will think and write about how these predictions may affect the Critical Zone within a region.
Finally, we will close Lesson 5, and Unit 3, with some readings that link Earth's atmosphere to soil and provide predictions of changes in soil that we may expect as a result of climate change.
What will we learn about in Lesson 5?
- Regional climate change in the United States
- Links between the atmosphere and soil
- Predictions of changes to soil associated with climate change
- Future climate change
- Predictive models
- Atmospheric carbon dioxide content
- Temperature and precipitation
- Storminess
- Sea level
- Predictive models
What is due for Lesson 5?
Lesson 5 will take us one week to complete. As you work your way through these online materials for Lesson 5, you will encounter additional reading assignments and hands-on exercises and activities. The chart below provides an overview of the requirements for Lesson 5. For assignment details, refer to the lesson page noted.
Please refer to the Calendar in Canvas for specific time frames and due dates.
| ACTIVITY | LOCATION | SUBMISSION INFORMATION |
|---|---|---|
| Discussions on regional climate issues | page 3 | Participate in the Lesson 5 - Regional Climate team and class discussion forums in Canvas |
| Short (2-page) paper on links to the Critical Zone | page 4 | Post to the Lesson 5 - Links to the Critical Zone dropbox in Canvas |
| Discussion - Teaching and Learning About Atmosphere and Climate | page 5 | Participate in the Unit 3 - Teaching and Learning About Atmosphere and Climate discussion forum in Canvas |
Questions?
If you have any questions, please post them to our Questions? discussion forum (not e-mail), located under the Discussions tab in Canvas. I will check that discussion forum daily to respond. While you are there, feel free to post your own responses if you, too, are able to help out a classmate.
Future Climate Change Predictions and Model Evaluation
Future climate change projections are based on our understanding of the atmosphere, ocean, and climate system as it is mathematically represented in powerful computer models of the globe that reconstruct physical and chemical processes. These models are tested by their ability to accurately represent modern climate conditions and by using paleoclimate proxy data to "ground truth" model output for past climate conditions. In this manner, scientists can determine whether or not models accurately reconstruct the full range of climate extremes that can occur in Earth's climate system.
Many models have been applied to determine Earth's near-future climate. The results of these modeling efforts can then be applied to anticipating changes in Critical Zone processes, many of which are extremely relevant to the health of human society and all life on our planet.
Reading assignment
To learn more about future climate change predictions, please read the "Future Climate Change [90]" section of the United States EPA Web site (but instead go here [91]).
Also, visit the Climate Inspector [92] page in the U.S. Climate Resilience Toolkit to view future climate simulations from one of the leading global climate models.
Want to learn more?
(Optional) Read Chapter 11, Near-term Climate Change: Projections and Predictability [93], in Climate Change 2013: The Physical Science Basis, IPCC.
- Do not worry about the details.
- Read the Executive Summary.
- Browse the figures, noting the range in predictions dependent upon the model being considered; I find Figure 9.14 to be particularly enlightening.
- The General Summary and Figure 9.31 also provide good overviews.
Struggling to teach climate change in your 9-12 classroom?
Check out: Visualizing and Understanding the Science of Climate Change [94]
Regional Climate Issues
To learn more about regional climate issues, complete the following learning activity.
See our course calendar in Canvas for specific activity due dates.
Activity
Directions
- To get started, read the following Web sites. Feel free to browse any of the links you find interesting. Your goal should be to gain a basic understanding of the term "regional climate" from a climate scientist's perspective.
- Regional Climate in the U.S. [95]
- Regional Impacts of Climate Change in North America [96] (Read the Executive Summary)
- Regional Climate Models [97]
- With your newfound understanding of regional climate, you will now proceed to read two important reports, one by the Pew Center on Global Climate Change and the other by the Union of Concerned Scientists (UCS), that discusses potential climate-change-related impacts on specific regions within the United States.
- Regional Impacts of climate change: Four Case Studies in the United States [98] (Pew Center on Global Climate Change)
- Confronting Climate Change in the U.S. Northeast [99] (Union of Concerned Scientists)
NOTE:
You don't have to read the entire reports . . . we are going to do this part of the activity in five (5) teams. Team membership will be provided by the start of this lesson week.
Here is how each team should proceed with the readings:
- Members of every team should read the Introduction to the Pew report (pages 1-7) and Chapter 1 in the UCS report (pages 1–9).
- Members of individual teams should then read the following:
- Team 1: pp. 10–29 in the UCS report describing regional climate change in the Northeast
- Team 2: pp. 8–21 in the Pew report on the Midwest
- Team 3: pp. 22–41 in the Pew report on the West
- Team 4: pp. 42–56 in the Pew report on the Gulf Coast
- Team 5: pp. 57–67 in the Pew report on the Chesapeake Bay
Submitting your work
Upon completion of the reading, you are to engage in a discussion of the readings, first within your team and then with the rest of the class. The team discussion component of this activity will take place over two days and will require you to participate multiple times over that period. Likewise, the class discussion will then take place over the subsequent two days. See our course calendar in Canvas for specific dates.
Team discussions
- Enter the special discussion forum created for your team in Canvas (e.g., "Lesson 5 - Regional Climate: Team 1 Discussion")
- You will see five postings already there, each containing one of the following questions:
- What regional effects to the Critical Zone are described in your region?
- Are there any regional characteristics that make your region more susceptible or resilient to climate change?
- What role does the Critical Zone play in climate change in your region?
- Are there any actions that can be taken to mitigate the regional effects?
- How might reductions in our nation’s greenhouse gas emissions lessen the regional effects, if at all?
- Respond to one question that hasn't already been chosen by another student. If all questions have already been addressed, then select a question where you can further the discussion and post there.
- Return to the discussion periodically to read your teammates postings and to respond by asking for clarification, asking a follow-up question, expanding on what has already been said, etc.
Class discussion
Once you have discussed these topics within your team, we will regroup to engage in a discussion with the entire class. This class discussion will take place in a separate discussion forum in Canvas titled "Lesson 5 - Regional Climate: Class Discussion."
- Before joining the class discussion, skim the discussions that have taken place in ALL of the team discussion spaces in order to acquaint yourself with the other topics and issues.
- Next, enter the "Regional Climate - Class Discussion" forum and post a response to each of the following questions. Remember, if there are already postings there from other students, then respond by asking for clarification, asking a follow-up question, expanding on what has already been said, etc.
- What will the net effect of climate change be on the nation’s Critical Zone?
- Consider the previous list of questions from a carbon trading perspective. Imagine that a national cap on total carbon dioxide emissions has been established, but that consideration can be made for the total carbon budget of your region. That is, your region can be classified based on its carbon sources and sinks—if your region is designated as a net carbon sink, then your region can emit more carbon dioxide than a region that is identified as a source of carbon dioxide—or you trade or sell carbon credits to a region that is a net carbon source. Do you think your region is a net source or sink? How did you come to this conclusion? How will your region’s carbon budget be affected by climate change? Will the actions of other regions positively or negatively affect the carbon budget in your region? The Critical Zone?
Grading criteria
You will be graded on the quality of your participation. See the grading rubric [100] for specifics on how this assignment will be graded.
Links to the Critical Zone
As we progress through the semester, you will learn that all of the various "spheres" that overlap in the Critical Zone, and all of the state factors of soil formation, are complexly interrelated—it is difficult to tease out the effects of a single factor or "sphere," on the Critical Zone. Nonetheless, it is worthwhile to assess aspects of Critical Zone science associated with a single "sphere," if for no other reason than we can draw on the accumulated knowledge of various scientific sub-disciplines that have focused on an individual "sphere." More importantly, though, is the fact that my brain best understands and learns simple concepts, so we will more closely consider the effects of a single variable, the atmosphere, on the Critical Zone to complete this lesson.
Activity
NOTE:
For this assignment, you will need to record your work on a word processing document. Your work must be submitted in Word (.doc) or PDF (.pdf) format so I can open it. In addition, documents must be double-spaced and typed in 12 point Times Roman font.
Directions
- Before we consider atmospheric effects on soils and predictions of changes to soils associated with climate change, please re-read pages 19–20 from Brantley et al. (2006). These pages will remind you of the complex interactions between the biosphere, lithosphere, hydrosphere, and atmosphere before you focus on atmospheric effects.
- Brantley, S., White, T., White, A., Sparks, D., Richter, D., Pregitzer, K., et al. (2006). Frontiers in exploration of the Critical Zone [7]. In Frontiers in exploration of the Critical Zone: Report of a workshop sponsored by the National Science Foundation (NSF). (pp. 1–30). Newark, DE. Retrieved 16 June 2008.
- Next, read Derry, L. A., & O. A. Chadwick. (2007). Contributions from Earth's Atmosphere to Soil. [101] ELEMENTS, 3(5): 333–38. (This article is available online through Library Reserves.)
As you learn about aerosol inputs to soils, particularly on isolated ocean islands where strong atmospheric fluxes can be contrasted to bedrock (parent material) signatures, note that Lou and Oliver are both steering committee members for the Critical Zone Exploration Network.
As you read the article, consider whether or not the soils you studied in your Web Soil Survey activity may have significant atmospheric inputs. (You will be asked to submit your answers to these questions below.)- Are the inputs natural or anthropogenic?
- Do the inputs provide vital components to the soil or do they degrade the soil?
- In either case, what would happen if the inputs were increased or decreased?
- Continue reading the two short articles from Soils on a Warmer Earth. I want you to leave these readings with the general sense that many soil scientists expect soils to be altered, in some cases drastically, because of climate change, and that the soil changes are expected to vary regionally. Most of these changes entail variations in soil moisture and temperature, but higher leaching and erosion rates are expected under conditions of elevated rainfall, whereas increased salinization is expected in regions susceptible to drier climate. Also, note that some soils are considered to be more "resilient" than others.
- Brinkman, R. (1990). Resilience against climate change? Soil minerals, transformations and surface properties, Eh, pH. In H. W. Scharpenseel & M. Shoemaker (Eds.), Soils on a Warmer Earth (pp. 51–60). Elsevier Publishing Company.
- Szabolcs, I. (1990). Impact of climate change on soil attributes: Influence on salinization and alkalinization. In H. W. Scharpenseel & M. Shoemaker (Eds.), Soils on a Warmer Earth (pp. 61–69). Elsevier Publishing Company.
- Complete this activity by considering the following questions with respect to your Web Soil Survey results. (You will be asked to submit your answers to these questions below.)
- What changes do you expect in your study soil as Earth's climate warms?
- How might these changes cascade through the hydrosphere and biosphere?
- Will they be beneficial?
- Are there any management strategies worth considering now before the changes occur?
- Combine your responses to the questions in steps 2 and 4 into a single paper that is no more than two double-spaced pages in length.
- Save your work as either a Microsoft Word or PDF file in the following format:
L5_links_AccessAccountID_LastName.doc (or .pdf).
For example, student Elvis Aaron Presley's file would be named "L5_links_eap1_presley.doc"—this naming convention is important, as it will help me make sure I match each submission up with the right student!
Submitting your work
Submit your work to the Lesson 5 - Links to the Critical Zone dropbox in Canvas by the due date indicated on our Canvas calendar. (See the Modules tab in Canvas)
Grading criteria
You will be graded on the quality of your writing. You should not simply write responses to the questions and submit them to me. Instead plan on writing a short stand-alone paragraph (or page or whatever you decide is necessary considering any constraints I might have placed on you) so that anyone can read what you've written and understood it. You should strive to be specific and complete in responding to the questions. Your answers should be analytic, thoughtful and insightful, and should provide an insightful connection between ideas. The writing should be tight and crisp with varied sentence structure and a serious, professional tone.
Teaching and Learning About Atmosphere and Climate
Let's take some time to reflect on what we've covered in this unit!
Activity
Directions
For this activity, I want you to consider how you might adapt the materials of this unit to your own classroom. Since this is a discussion activity, you will need to enter the discussion forum more than once in order to read and respond to others' postings.
Submitting your work
- Enter the "Teaching and Learning About Atmosphere and Climate" discussion forum in Canvas.
- Post your ideas for how the materials we covered in this unit might be adapted for your own classroom.
- Read postings by other EARTH 530 students.
- Respond to at least one other posting by asking for clarification, asking a follow-up question, expanding on what has already been said, etc.
Grading criteria
You will be graded on the quality of your participation. See the grading rubric [47] for specifics on how this assignment will be graded.
Summary and Final Tasks
This has been a long unit with a lot of reading and writing. By now though you should have a strong basic understanding of atmospheric processes and the full range of climate change that can occur on Earth, on both the global and regional level. You should also understand the overwhelming scientific information indicating that climate change is being driven by anthropogenic causes, that this change is occurring very rapidly, and that the change will affect the Critical Zone and soil resources. All is not lost however—the scientific community has begun to discuss various management strategies to deal with potential degradation of the Critical Zone. Whether you realize it nor not, you can apply this newfound knowledge to modify your own behaviors and help to develop strategies that will allow society to survive and perhaps thrive under warmer Earth conditions—perhaps your students will learn from you and do the same.
In the next unit we will focus on the hydrologic cycle, and surface and ground water resources, which are all intimately tied to the atmospheric processes you have just studied and mastered.
Reminder—Complete all of the lesson tasks!
You have finished Lesson 5. Double-check the list of requirements on the Lesson 5 Overview page to make sure you have completed all of the activities listed there before beginning the next lesson.
Tell us about it!
If you have anything you'd like to comment on or add to, the lesson materials, feel free to share your thoughts with Tim. For example, what did you have the most trouble with in this lesson? Was there anything useful here that you'd like to try in your own classroom?
Unit 4, Lesson 6: Water (1)
Lesson 6 Introduction
Agua es vida (Water is life [102])—that statement adorned the logo of a water-well-drilling company I worked with many years ago in Puerto Rico, and to me, the phrase highlights the importance of water on Earth. Remember that 78% of a human baby's body is composed of water, as is 55–60% of an adult's body; obviously, water is a truly critical component of sustaining life on Earth.
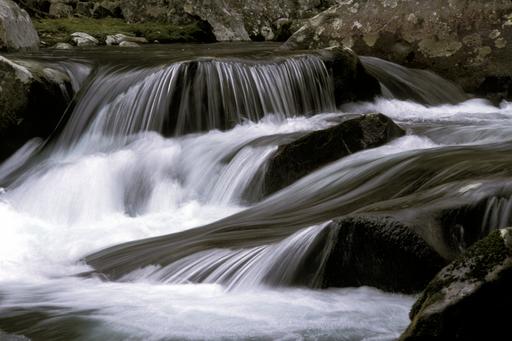
Water covers ~70% of Earth's surface. Most of this is in the oceans, a realm of Earth not covered in this course. However, the global ocean is more than peripheral to the Critical Zone. Ultimately, all of the water that bathes the Critical Zone was evaporated from the ocean surface, transferred to the continents as vapor via the atmosphere, and deposited on the land surface as liquid or solid precipitation, depending on regional climate. In this unit, we will learn about water's role in the Critical Zone. We will accomplish this in Lesson 6 by first considering in some detail the so-called water cycle. Because of the role of the atmosphere, we will revisit some aspects of atmospheric processes. This should serve to demonstrate the intimate link between the various "spheres" (our last unit with this one) that overlap in the Critical Zone!
The water cycle involves much more than the transfer of water from the ocean to the land surface. Once precipitated, water can flow across the land surface, infiltrate into the subsurface as soil pore water or groundwater (remember that the base of the Critical Zone is defined as the depth to which groundwater freely circulates), or be evaporated or transpired by plants (the top of the Critical Zone!) back to the atmosphere. In this lesson, we will consider the many processes involved in the flow of water through the Critical Zone.
Water is known as the universal solvent—rarely is it found in a pure state because many substances will readily dissolve in it. Thus, we will include brief considerations of water chemistry and quality (we will return to this topic again when considering landforms and biota) and the role human society has played in degrading this invaluable resource. In our landform unit, you will also learn about the role water plays in transforming and sculpting the land surface, while in the biota unit we will explore the many interactions between water and life in the Critical Zone, thus further linking the Critical Zone "spheres."
Finally, because of the somewhat mysterious nature (out of sight, out of mind) of groundwater, you will study various aspects of groundwater flow in Lesson 7, and complete the water unit by reading about links between water and Critical Zone science. Enjoy.
Lesson Overview
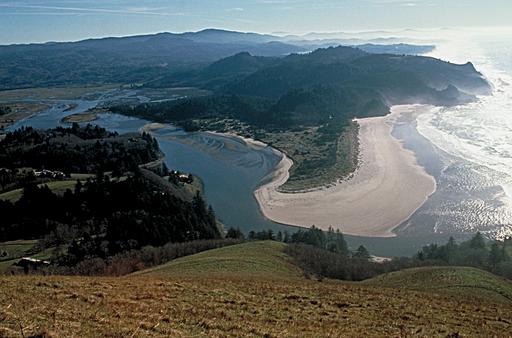
In an earlier lesson, I described soil as the "heart" of the Critical Zone. With that analogy in mind, perhaps you can consider water to be the “blood” of the Critical Zone. Once precipitated onto a landscape, water can be stored at the surface in various reservoirs depending on the climate of a region, flow across the surface, or infiltrate into and flow through the subsurface domain. Along the various pathways, water can transfer dissolved constituents from one portion of the Critical Zone to another. Those constituents may degrade water quality, precipitate minerals, or provide sustenance for life, among many other processes. As in earlier lessons, you should not be concerned with memorizing and repeating various definitions for the many processes you will read about and study. Instead, begin by securely grasping the concept of the water cycle. Once you have mastered the water cycle, move on to learn about the chemistry of natural waters and human influences on water in the Critical Zone.
What will we learn about in Lesson 6?
- The role of the ocean in the water cycle
- The difference between evaporation, sublimation, and evapotranspiration
- The difference between condensation and precipitation
- Various reservoirs in which water is stored in and moves through the Critical Zone
- The difference between surface runoff and streamflow
- The distribution of water on Earth and in the Critical Zone
- Human influences on water distribution and quality
- The use of online surface water data
- Basic chemistry of some natural waters
Learning Objectives
By the end of this lesson you should be able to:
- Describe the water cycle using a schematic diagram
- Obtain and interpret online surface water data
- Discuss basic chemistry of some natural waters
- Discuss human influences on the availability and quality of water
What is due for Lesson 6?
Lesson 6 will take us one week to complete As you work your way through these online materials for Lesson 6, you will encounter additional reading assignments and hands-on exercises and activities. The chart below provides an overview of the requirements for Lesson 6. For assignment details, refer to the lesson page noted.
Please refer to the Calendar in Canvas for specific time frames and due dates.
| ACTIVITY | LOCATION | SUBMISSION INFORMATION |
|---|---|---|
| Report on StreamStats | page 6 | Post to the Lesson 6 - StreamStats dropbox in Canvas dropbox |
Questions?
If you have any questions, please post them to our Questions? discussion forum (not e-mail), located under the Discussions tab in Canvas. I will check that discussion forum daily to respond. While you are there, feel free to post your own responses if you, too, are able to help out a classmate.
Water cycle
The term "water cycle" does not refer to water craft you can peddle across water—instead the water cycle describes the transit of water through all of the components or "spheres" of the Critical Zone (atmosphere, hydrosphere, lithosphere, biosphere, and soil) and the processes involved in that transit.
Reading assignment
- An excellent discussion of the water cycle is available at the U.S. Geological Survey Web site [103]. Please go to that page and thoroughly read and study the information presented there. I suggest that you read the entire summary page, then return to the Quick Summary and read it, visiting and studying each blue hot-button link for more detail.
- The USGS water cycle summary includes discussions of the general distribution of water on Earth and how precipitation rates vary geographically. However, I would like you to further study the geographic distribution of precipitation. To do so you must first understand the manner in which precipitation occurs—go to the Wikipedia entry for "Precipitation (meteorology)" and read the section on types of precipitation [104].
- Next please visit and read the Wikipedia entry for "Atmospheric Circulation [105]."
- Visit and read "Why are Deserts Dry?" [106]Pay close attention to the figure: Do you notice any relationship between the distributions of descending and ascending air masses and deserts?
- Other processes influence the distribution of precipitation on Earth. Perhaps most prominent among these are the so-called monsoons, seasonal episodes of intense rainfall followed by periods of relative drought. Read the Wikipedia entry for "Monsoon" [107] to learn more.
- Much of the reading to this point in this section has focused on liquid forms of precipitation. To provide you with some insight into the presence of solid water and its role in the hydrosphere, water cycle, and Critical Zone (and more knowledge to support what you learned about glaciers in our lesson on paleoclimatology) please read the Wikipedia entry for "Cryosphere [108]."
Want to learn more?
- To learn more about the water cycle and specifically the role of NASA satellite research in understanding the water cycle, see NASA's "The Water Cycle." [109]
- A very simple interactive video called "Thirstin's Water Cycle [110]" is also available on the EPA's Web site.
- The EPA site also has a collection of water-related K–12 resources [111]!
- Teacher's Domain provides a lesson plan and multimedia resources that may be useful for your classroom. Though it is rated for grades 3–5, Cycling Water through the Environment [112] has some interesting products including: "Observe precipitation," "Water cycle animation," and "The hydrologic cycle."
- The National Science Foundation provides a lot of information regarding water resources and humanity's dependence on and use of water, but this one in particular may be of interest [113].
- Several simple on-line model tools [114] for understanding the water cycle and human influences on it are available from the Stroud Water Research Center, a co-host of the Christina River Basin CZO.
Chemistry of Natural Water
The chemistry of natural water, aqueous chemistry (or aqueous geochemistry), is a complex subject well beyond the reach of this course. However, some very basic concepts of water chemistry are important to help understand the role of water in the Critical Zone.
Reading assignment
- To begin to attain some understanding, please visit "Study and Interpretation of the Chemical Characteristics of Natural Water [115]." This paper by John Hem is a classic. Read the abstract of this USGS water-supply paper, along with pages 3 to 10 (sections from "Properties and Structure of Water" to but not including "Thermodynamics of Aqueous Systems") and pages 30 to 42 (sections from "Relationship among Environmental Factors and Natural Water Composition" to but not including "Evaluation of Water Composition"). If you want more detail, feel free to read the remaining sections (optional).
- A classic textbook is The Geochemistry of Natural Waters by James I. Drever (1982). Read Chapter 1, "The Hydrologic Cycle" (pp. 1–13), located on Library Reserves. To some extent, this chapter will serve to partially review some concepts you have already studied under the water cycle. Focus on the brief discussions of water chemistry and quality linked to the physical processes of water flow.
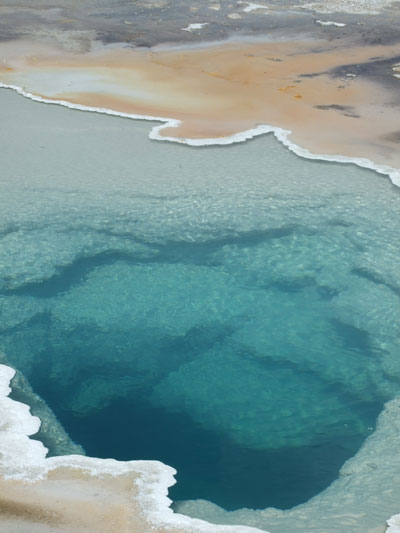
Human Influences on Water
Humanity's use of water has a long history for obvious reasons—agua es vida! Civilization is thought to have first arisen in the Tigris-Euphrates River Valley, where irrigation canals have been used for at least 6,000 years. In addition, the site of vast water bodies (lakes, oceans) or flowing water in rivers and streams, provide aesthetic appeal and comfort for many, as well as providing sources for food, waste disposal, and recreation. For these reasons among others, humans have lived and worked near water, exerting strong and important influences on the water cycle, water quantity, and quality.
Reading assignment
- To better understand some of these influences please visit the Wikipedia entry for "Water Resources [116]." Much of the information there has been covered in this course, so plan to focus on the sections entitled "Uses of fresh water" and "Water stress."
- To learn more about Human influences on water quality [117] visit the Utah State University Cooperative Extension and read about Agriculture & Water Quality, Urban Stormwater, and more.
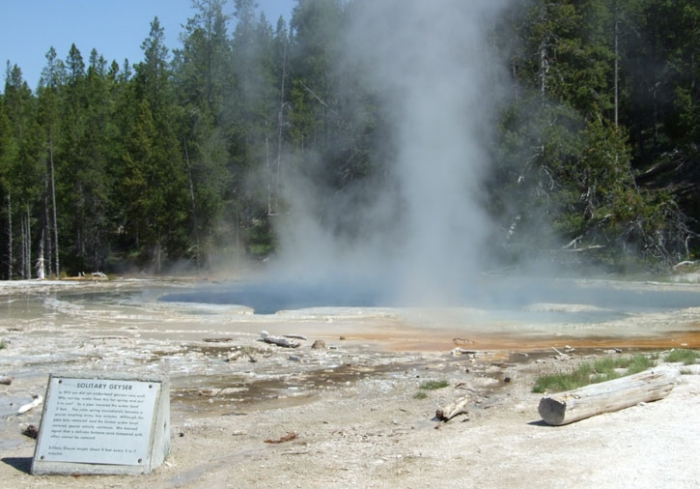
Surface Water Studies
USGS has placed much of its surface water gauging data online using a Web-based tool called Streamstats. In this exercise, you will learn to use Streamstats to gather information about a study site. Ideally, this study site will be the same as the soil site you identified in Lesson 2. However, you will see that not all of the states have fully implemented this tool, so if you are from a state other than Pennsylvania and chose a soil site in that state, you may not be able to use Streamstats to evaluate your soil site. Read on.
Activity
Directions
NOTE:
For this assignment, you will need to record your work on a word processing document. Your work must be submitted in Word (.doc) or PDF (.pdf) format so I can open it. In addition, documents must be double-spaced and typed in 12 point Times Roman font.
- Begin by visiting USGS Water Data for the Nation [118].
- In upper left-hand corner select "Current Conditions" - see if the state where your soil study site is located (from our previous activity) is “Fully Implemented.” If it isn’t, choose a state that has fully implemented online data availability and use it for the remainder of this activity. Click on the state.
- When you arrive at the state map you will see color-coded gauging stations plotted on the state map.
- Begin to write a two-page report (described further in steps below) by answering the following questions (your responses will serve as the introduction for the report):
- How does real-time streamflow in your state compare to historical data?
- How does real-time streamflow in the gauging station nearest to your study site compare to historical data?
- Identify the closest station to your study site. If you had to switch to another state in Step 3, then just pick a site of interest to you (explain why you chose it when writing up this part of the activity). Use the zoom function and you can use your cursor to hover over each site to learn the name and characteristics of the gauging station. If you click on the spot you can gather more information about the site, and if you click on the name of the site in that information box you will arrive at current conditions - and be able to determine what data is available from the site. What data is available from this nearest gauging station to your study site?
- From the current conditions, plot as many data parameters as are available (up to 3) over a 60-day duration. Include the resulting plot(s) and describe your results in the report you began earlier in this activity. In your report, include responses to these questions:
- Do any unusual events or anomalies exist in the data?
- If so, to what do you attribute the anomalies?
- Finally, go to Streamstats [119] and visit and read the Documentation section.
- Zoom in to the soil site you identified in Step 5 and delineate the drainage basin at the site and obtain the relevant information for your site.
- As a third page to your report, include responses to the following questions along with a map of your basin:
- What are the characteristics of your basin?
- How do the flow data compare to the nearest gauging station?
- To what do you attribute the similarity or difference (think about the location of your site relative to the nearest gauging station within the drainage network and basin).
- Save your report as either a Microsoft Word or PDF file in the following format:
L6_surfacewaterstudies_AccessAccountID_LastName.doc (or .pdf).
For example, student Elvis Aaron Presley's file would be named "L6_surfacewaterstudies_eap1_presley.doc"—this naming convention is important, as it will help me make sure I match each submission up with the right student!
Submitting your work
Upload your report to the "Lesson 6 - Surface Water Studies Activity" dropbox in Canvas (in the lesson under the Modules tab) by the due date indicated on our Canvas calendar.
Grading criteria
You will be graded on the quality of your writing. You should not simply write responses to the questions and submit them to me. Instead plan on writing a short stand-alone paragraph (or page or whatever you decide is necessary considering any constraints I might have placed on you) so that anyone can read what you've written and understood it. You should strive to be specific and complete in responding to the questions. Your answers should be analytic, thoughtful and insightful, and should provide an insightful connection between ideas. The writing should be tight and crisp with varied sentence structure and a serious, professional tone.
Summary and Final Tasks
The importance of water in the Critical Zone cannot be overstated. Water plays a primary role in physical and chemical weathering, erosion and transportation of sediments and dissolved ions, and the sustenance of life, to name a few processes. You should understand the water cycle and the various reservoirs in which water is stored and transported through the Critical Zone. You should also understand basic concepts linking water flow to the natural chemistry of water, and human influences on water resources. Finally, you should be confident in your ability to access widely available river and stream gauge data and should have used this data to learn about the surface water characteristics of your study site.
Want to learn more?
Here are some links to some Teacher's Domain resources (developed by Penn State!) that you might even want to use in your own classrooms:
Reminder—Complete all of the lesson tasks!
You have finished Lesson 6. Double-check the list of requirements on the Lesson 6 Overview page to make sure you have completed all of the activities listed there before beginning the next lesson.
Tell us about it!
If you have anything you'd like to comment on or add to, the lesson materials, feel free to share your thoughts with Tim. For example, what did you have the most trouble with in this lesson? Was there anything useful here that you'd like to try in your own classroom?
Unit 4, Lesson 7: Water (2)
Lesson 7 Introduction
Lesson Overview
So far you've learned that the water cycle includes the infiltration and flow of water into and through the subsurface. Many citizens are familiar with groundwater, since approximately one-third of us obtain our drinking water supply from groundwater. People discuss "aquifers," underground lakes, and the mythical existence of a deep underground connection between Loch Ness (Scotland) and Lake Champlain (Vermont) that explains reports of large ancient dinosaur-like creatures in both places. However, groundwater is no mystery! The presence and flow of groundwater are governed by the same physical processes that operate within our view on Earth's surface.
In this lesson, we will spend some extra time considering the water that exists beneath our feet. First, you will read about and consider soil moisture in the unsaturated zone, and then progress to read about and study groundwater. You will access, use, and interpret online groundwater data very similar to what you accomplished in your surface-water study in the last lesson. Finally, we will close by thinking in more depth about the links between water, the water cycle, and the Critical Zone!
What will we learn about in Lesson 7?
- The difference between soil and groundwater, and the vadose and saturated zones
- Basic concepts of groundwater flow
- How the water cycle is linked to biologic (including humans) and other processes active in the Critical Zone
- How to access and use online groundwater data
Learning Objectives
By the end of this lesson you should be able to:
- Describe soil moisture and the vadose zone, the water table, groundwater, and the saturated zone using a schematic cross-section
- Obtain and interpret online groundwater data
- Discuss the important role of water in the Critical Zone
What is due for Lesson 7?
Lesson 7 will take us one week to complete. As you work your way through these online materials for Lesson 7, you will encounter additional reading assignments and hands-on exercises and activities. The chart below provides an overview of the requirements for Lesson 7. For assignment details, refer to the lesson page noted.
Please refer to the Calendar in Canvas for specific time frames and due dates.
| ACTIVITY | LOCATION | SUBMISSION INFORMATION |
|---|---|---|
| Report (6–7 pages) on groundwater studies | page 4 | Post to the Lesson 7 - Groundwater Activity dropbox in Canvas |
| Discussion—Teaching and Learning About Water | page 6 | Participate in the Unit 4 - Teaching and Learning About Water discussion forum in Canvas |
Questions?
If you have any questions, please post them to our Questions? discussion forum (not e-mail), located under the Discussions tab in Canvas. I will check that discussion forum daily to respond. While you are there, feel free to post your own responses if you, too, are able to help out a classmate.
Soil Moisture and Groundwater
In most places, an unsaturated zone of soil, sediment, and bedrock exist close to Earth's surface. Although it is unsaturated, the zone still may contain water by capillary action and adhesion to soil particles. This so-called vadose zone exists from the soil surface beneath our feet to the top of the water table. This should be relatively easy to understand if you imagine that if all of the soil and sediment beneath us was saturated, we'd constantly be walking through mud, quicksand, etc., dependent upon the parent material. Instead, as water infiltrates into the subsurface, much of it flows to the water table, while some is retained in the soil and sediment column, the vadose zone.
Reading assignment
- To learn more about the vadose zone visit the Toxic Substances Hydrology Program site [122] at USGS and read the short paragraph and view the accompanying figure.
- At the previous link, you encountered the term soil moisture as it relates to the water contained within the unsaturated zone. Learn about soil moisture [123] at NASA's Web site.
- The term groundwater usually refers to all subsurface water beneath the water table (the interface between the vadose and saturated zones, or the top of the saturated zone) in soils and geologic formations that are fully saturated. This definition excludes soil pore water in the vadose or unsaturated zone. Keeping in mind that the field of hydrogeology or groundwater hydrology is a sub-discipline of its own, learn about groundwater [124] at the Water Encyclopedia site. In addition, learn about groundwater basics [125] at the USGS Groundwater Information site.
More on Groundwater
Remember that this unit on water and lesson on groundwater present only a broad overview of some very complex topics. Here you will have an opportunity to revisit and expand your knowledge of some of the topics covered in part 2 of this lesson—I consider the concepts presented here to be important for understanding links between surface and groundwater. To me, these concepts highlight the complex interplay of surface and subsurface processes that are active in and affect the Critical Zone.
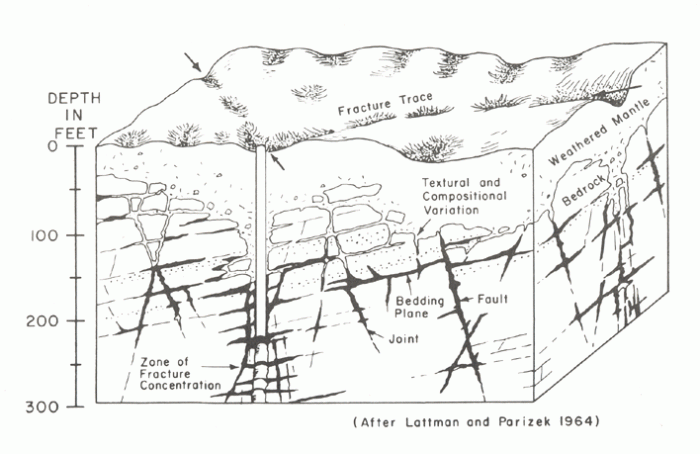
Reading assignment
Review the following information and resources:
- Confined v. unconfined aquifers [126]
- Primary porosity and diffuse flow v. fracture or conduit porosity and flow: Many rocks and sediments contain space called pores between the individual solid grains that comprise the rock or sediment. This is called primary porosity. If the pores are interconnected then the material is considered to be permeable and fluids can flow through the interconnected pores. This type of fluid flow is known as diffuse flow. Sediments and rock can undergo substantial changes when they are buried and subjected to increased pressure and temperature, or when they are weathered at Earth's surface. Some of these processes can lead to changes in the primary porosity and/or the development of porosity separate from primary porosity—this is called secondary porosity. Sometimes secondary porosity can include the development of large fractures in the rock or conduits, like caves in limestone or lava tubes in basalt. Typically larger fluid volumes can pass through fractures and conduits, thus a different name, fracture or conduit flow, is used to describe this flow regime. Imagine if you can water moving between grains of sand at the beach versus through Mammoth Cave in Kentucky and you will have grasped the difference between diffuse and fracture/conduit flow.
- Gaining and losing streams: The term gaining stream refers to a stream in which the water table in the surrounding flood plain is higher than the water level in the stream. Thus, water flows from the flood plain sediments into the stream channel and stream flow increases in volume downstream. A losing stream is the opposite: water from the stream channel percolates into the subsurface because the water table in the surrounding sediments is below the water level in the stream channel—stream flow decreases downstream.
- Groundwater flow and effects of pumping [127]
Check this out . . .
You can learn more about groundwater at USGS [128]. More importantly, you can access a number of resources, including posters for your classroom, at this site. I highly recommend spending time here.
A detailed map of Earth's groundwater resources can be viewed and downloaded at WHYMAP [129].
Groundwater Studies
Activity
USGS has placed much of its groundwater database online. In this exercise, you will learn to access this data to gather information relevant to your soil and surface water study site.
Directions
NOTE:
For this assignment, you will need to record your work on a word processing document. Your work must be submitted in Word (.doc) or PDF (.pdf) format so I can open it. In addition, documents must be double-spaced and typed in 12 point Times Roman font.
- Go to the USGS Ground-Water Data for the Nation [130] Web site.
- Click on the "Current Conditions" link.
- Scroll down through the list of wells that are organized by state. For Pennsylvania, the real-time monitoring wells are named according to the county in which they are found, so if PA is your state, you're in luck. Not all states are organized in this manner.
- Locate and identify the real-time groundwater well closest to your soil and surface water study site. What real-time data is available for the site closest to your study site?
- In a report no longer than two double-spaced pages, answer the following questions (include a plot of water level versus time):
- Are any trends available (short- or long-term)?
- If so, to what do you ascribe the trends?
- Do any unusual events or anomalies exist in the data?
- If so, to what do you attribute the anomalies?
- Is this information relevant to your soil and surface water study site?
- If so, how? If not, why not?
- Next return to the USGS Groundwater Data for the Nation main page and click on the "Daily Data" link to move into site selection mode.
- A form will appear:
- Check the box for the "Lat-Long box" unless you already know the name of the nearest USGS groundwater well at which daily data is collected and placed online.
- Leave the "Site type" box checked.
- Submit the form.
- A new form will appear:
- For "Site type," choose "Well" or if you get no results try "Spring", or both.
- For "Lat-Long box," provide a range of latitudes and longitudes. Be sure to provide coordinates that will "box" or contain your soil and surface water study site and use an "expanding box" strategy. In other words, if you make the lat-long box too small (good idea to begin with) there may be no USGS station located within the box. So, expand the coordinates outward from the site until you locate the closest USGS station with daily data.
- Leave the available parameters blank so that your search results include all available data for the USGS station.
- Submit the form.
- In a report no longer than two double-spaced pages, answer the same questions as above (and again, include a plot of water level versus time). Notice the Statistics hot button for daily, monthly, and annual statistics that may be useful for interpreting the data.
- Are any trends available (short- or long-term)?
- If so, to what do you ascribe the trends?
- Do any unusual events or anomalies exist in the data?
- If so, to what do you attribute the anomalies?
- Is this information relevant to your soil and surface water study site?
- If so, how? If not, why not?
- Finally, return to the main page once again and click on the "Field Measurements" link. While the data here is more limited, there are many more sites to choose from, so this may provide you with your best opportunity to collect information relevant and closest to your study site.
- Apply the same strategy as you did in steps 7 and 8, above, to collect the relevant information.
- In a report no longer than two double-spaced pages, answer the same questions as above (and again, include a plot of water level versus time).
- Are any trends available (short- or long-term)?
- If so, to what do you ascribe the trends?
- Do any unusual events or anomalies exist in the data?
- If so, to what do you attribute the anomalies?
- Is this information relevant to your soil and surface water study site?
- If so, how? If not, why not?
- Finish your report (which is now about six pages in length) with a paragraph describing which of the data you collected is most relevant to your site and why.
- Save your report as either a Microsoft Word or PDF file in the following format:
L7_groundwater_AccessAccountID_LastName.doc (or .pdf).
For example, student Elvis Aaron Presley's file would be named "L7_groundwater_eap1_presley.doc"—this naming convention is important, as it will help me make sure I match each submission up with the right student!
Submitting your work
Upload your report to the "Lesson 7 - Groundwater Activity" dropbox in Canvas (see the Modules tab) by the due date indicated on our Canvas calendar.
Grading Criteria
You will be graded on the quality of your writing. You should not simply write responses to the questions and submit them to me. Instead plan on writing a short stand-alone paragraph (or page or whatever you decide is necessary considering any constraints I might have placed on you) so that anyone can read what you've written and understood it. You should strive to be specific and complete in responding to the questions. Your answers should be analytic, thoughtful and insightful, and should provide an insightful connection between ideas. The writing should be tight and crisp with varied sentence structure and a serious, professional tone.
Links to the Critical Zone
If you have not concluded that the Critical Zone is a complex maze of processes and interactions, you soon will. By now you should clearly understand the links between the atmosphere, climate, and the water cycle. You should have a basic understanding of how water interacts with the lithosphere, though we will explore this in more detail in the next unit. You should also know that freshwater in the Critical Zone is unevenly distributed on Earth and that this leads to variations in the character of and processes operational in the Critical Zone from region to region.
Reading assignment
Please read the following manuscript to solidify your understanding of the links between surface and groundwater quality and quantity and the surrounding landscape.
- Peters, Norman E., and Michel Meybeck. (2000).Water Quality Degradation Effects on Freshwater Availability: Impacts of Human Activities, Water International, 25.2, pp. 185–193, located on Library Reserves.
This is an excellent review of much of the material covered in Unit 4—pay particular attention to the schematic figures. Also, note the attention placed on human interactions with the water cycle. As you do so, begin to think about the role of humanity on your study site –(your site is probably not pristine even if it is located in a state or national forest), as you will be required to assess the impact of past, present, and potential future human impacts on your site as part of your semester project.
Teaching and Learning About Water
Let's take some time to reflect on what we've covered in this unit!
Activity
Directions
For this activity, I want you to reflect on what we've covered in this unit and to consider how you might adapt these materials to your own classroom. Since this is a discussion activity, you will need to enter the discussion forum more than once in order to read and respond to others' postings.
Submitting your work
- Enter the "Teaching and Learning About Water" discussion forum in Canvas.
- Post your ideas for how the materials we covered in this unit might be adapted for your own classroom.
- Read postings by other EARTH 530 students.
- Respond to at least one other posting by asking for clarification, asking a follow-up question, expanding on what has already been said, etc.
Grading criteria
You will be graded on the quality of your participation. See the grading rubric [47] for specifics on how this assignment will be graded.
Summary and Final Tasks
This lesson on groundwater was crafted to introduce you to the fairly complex concepts of hydrogeology and groundwater flow. You should understand that some water that arrives at Earth's surface infiltrates into the ground. An unsaturated zone exists between the ground surface and the water table, beneath which lies the saturated zone of groundwater flow. Where recharge to the water table occurs freely without barriers to flow, unconfined flow systems exist. In some places, groundwater is confined—disconnected from overlying solid material and water outside of its recharge area. Surface water and groundwater can be in hydrologic communication in other ways, for example as gaining or losing streams.
Groundwater flows through spaces in the sediment and rock beneath our feet: a continuum exists in flow regimes between diffuse flow and fracture or conduit flow. Groundwater quality is affected by natural and anthropogenic processes. In some places, groundwater can be naturally degraded by proximity to geologic materials, but the majority of groundwater quality concerns are due to human activities, such as agriculture, industry, and waste disposal. Because of water's role as a solvent, and its intimate relationship to the sustenance of life, all of the processes you've learned about in this unit are important for furthering your understanding of Critical Zone processes. Remember, agua es vida.
Reminder—Complete all of the lesson tasks!
You have finished Lesson 7 and Unit 4. Double-check the list of requirements on the Lesson 7 Overview page to make sure you have completed all of the activities listed there before beginning the next lesson.
Tell us about it!
If you have anything you'd like to comment on or add to, the lesson materials, feel free to share your thoughts with Tim. For example, what did you have the most trouble with in this lesson? Was there anything useful here that you'd like to try in your own classroom?
Unit 5, Lesson 8: Landforms (1)
Lesson 8 Introduction
Thus far through the course, we have focused on one of the state factors of soil formation: climate. (We have also studied how water specifically contributes to this process.) Now we turn our attention to the other state factors. In this unit on geology and landforms, we will consider and discuss three of the remaining four natural state factors of soil formation: parent material, topography, and time.
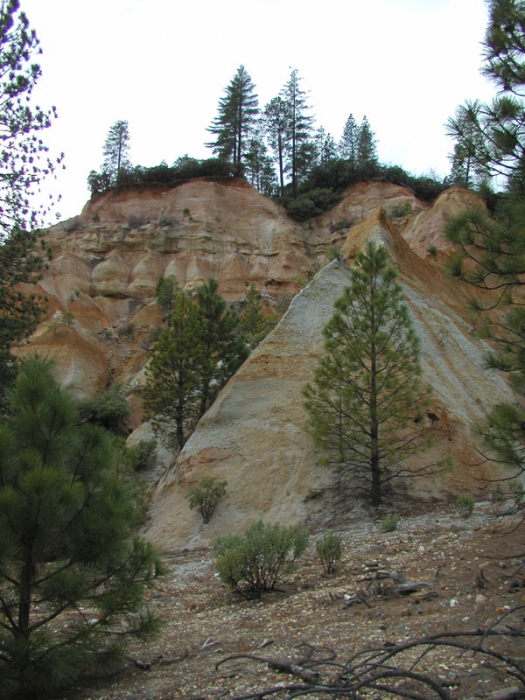
Parent material is obviously a critical component of the pedogenic system and the Critical Zone—all the other state factors of soil formation act upon the parent material to create soil, and thus the original, unweathered composition of the parent material plays a unique role in the weathered product. In Lesson 8, you will learn (review) basic concepts of geology to remind you that rocks and sediments have widely ranging textures and compositions formed in a wide range of environments. These variations, in turn, can affect soil formation and Critical Zone processes.
The landforms and topography of a region control a variety of Critical Zone processes. You will learn in Lesson 8 that the plate tectonic setting plays a first-order role in determining the topography of a site and thus in determining whether soils develop and accumulate or are subject to erosion. In addition, the geologic setting determines other aspects of environmental control on the Zone. As you study Lesson 8, consider the following questions: Can unique depositional environments consist of characteristic landforms? If so, what can those landforms show us about Critical Zone processes? Do soils developed on unique landforms have unique characteristics? What is the slope and aspect of a site and how do these relate to solar heat budgets and vegetation?
Lesson Overview
The geology of a region controls the parent material available for pedogenesis. Parent material can be represented by a wide range of rock types of varying geochemical compositions, it can be lithified (hardened) or unconsolidated, and it can be relatively recent in age or billions of years old. The geologic setting of a region, past and present, also determines whether or not mountains or valleys exist, thereby exerting a first-order influence on the topographic setting in which Critical Zone processes function and soils form. Furthermore, the geologic setting will determine whether parent material lies within an active setting, perhaps only recently exposed to pedogenic processes; or within a more stable setting in which soil formation may continue unabated, subject only to the vagaries of climatic and biotic change.
What will we learn about in Lesson 8?
- Basic geologic concepts
- Rock types and the rock cycle
- Plate tectonics
- Geologic time
- Weathering, erosion, and deposition
- Geologic maps
Learning Objectives
By the end of this lesson you should be able to:
- Describe three rock types and the processes by which they form
- Discuss the rock cycle and plate tectonics
- Differentiate between relative and absolute age dating
- Describe the difference between weathering and erosion and their relationship to soils
- Differentiate between bedrock and surficial geologic maps and apply them to understanding the Critical Zone at your study site
What is due for Lesson 8?
Lesson 8 will take us one week to complete. As you work your way through these online materials for Lesson 8, you will encounter additional reading assignments and hands-on exercises and activities. The chart below provides an overview of the requirements for Lesson 8. For assignment details, refer to the lesson page noted.
Please refer to the Calendar in Canvas for specific time frames and due dates.
| ACTIVITY | LOCATION | SUBMISSION INFORMATION |
|---|---|---|
| Report (2 pages) on parent material questions | pages 4, 7 | Post to the Lesson 8 - Geology dropbox in Canvas |
| Report (2 pages) with relevant maps | page 8 | Post to the Lesson 8 - Geologic Map dropbox in Canvas |
Questions?
If you have any questions, please post them to our Questions? discussion forum (not e-mail), located under the Discussions tab in Canvas. I will check that discussion forum daily to respond. While you are there, feel free to post your own responses if you, too, are able to help out a classmate.
What is Geology?
Geology is near and dear to my life since I am a geologist. I cannot count the number of times I have been asked whether or not I have been out on a "dig" recently or whether I dug up any arrowheads or pottery during my recent field excursions. Geology is not archaeology! For this reason, I want to be sure that you are exposed to some basic information about geology, including a definition. Be aware that geology is a science subdivided into numerous sub-disciplines and that numerous university geoscience departments around the world offer degrees ranging from two-year associate's degrees to the Ph.D. This lesson should be viewed as an introduction to only the very basics of geology!
Check this out . . .
A set of talks covering various topics within the Geosciences is available for free use in schools at Your Planet Earth [131].
The Pennsylvania Topographic and Geologic Survey provides online resources for teachers [132], including lesson plans, relating to the geology of Pennsylvania. Visit the site and follow the hyperlink "For Teachers" to "Lesson Plans." Other states may offer similar resources.
Reading assignment
Please visit and read the following sites to be certain that you understand the basics of the field of geology.
Once you have completed that reading, you should understand that geology is the study of Earth: the materials of which it is composed, the processes that created those materials, and the history of the planet.
Much of what geologists work on focuses on rocks, classified into three basic types: igneous, sedimentary, and metamorphic.
Please visit the "Geology" section of About.com [135] to learn more about rocks.
- Follow the link to "Identify rocks"
- Continue on to "About igneous rocks"
- Follow the links through the descriptions of sedimentary and metamorphic rocks
You will be asked some questions related to these readings in the following activity.
Geology Activity
Activity
For this activity, I want you to begin writing a two-page report that you will continue working on in another activity in this lesson.
NOTE:
For this assignment, you will need to record your work on a word processing document. Your work must be submitted in Word (.doc) or PDF (.pdf) format so I can open it. In addition, documents must be double-spaced and typed in 12 point Times Roman font.
Directions
- Having read the materials listed on the previous page, think about their relevance to the Critical Zone and pedogenesis.
- If all state factors of soil formation except a parent material (in this case, rock type) were held constant in a select locale, do you think similar or different soils would be developed on the different rock types?
- Why?
- Save your document as either a Microsoft Word or PDF file in the following format:
L8_geologydocument_AccessAccountID_LastName.doc (or .pdf).
For example, student Elvis Aaron Presley's file would be named "L8_geologydocument_eap1_presley.doc"—this naming convention is important, as it will help me make sure I match each submission up with the right student!
- Continue with this lesson. You will continue this report in the activity on page 7 of this lesson.
The Rock Cycle and Plate Tectonics
Geologists use the term rock cycle to describe and simplify the complex interactions through which the three rock types can be linked to the processes that created them. One version of the rock cycle is illustrated below.
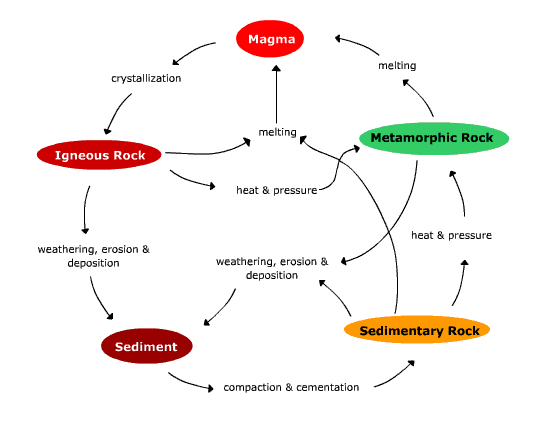
A simple animation of the rock cycle can be viewed at Exploring Earth [137]. Follow the links through steps 2 and 3, ignoring the assignment in step 3.
Reading assignment
The rock cycle is driven by plate tectonics and the presence of water. To review some basic information about plate tectonics, visit and read:
Notice that oceanic crust is denser than continental crust, hence continents exist above sea level and they are a net source of sediment to the ocean basins. Also note that each plate boundary type is described by characteristic processes, some of which lead to the development of uplifted regions, while others lead to downwarped or subsided portions of crust. Subsided areas often contain thick sediment piles full of relatively fresh bedrock and mineral nutrients derived from the nearest uplifted zones. For example, where the Indian sub-continent has collided with Eurasia, a large mountain belt has risen, the Himalayas, from which enormous quantities of sediment are shed into the Bay of Bengal.
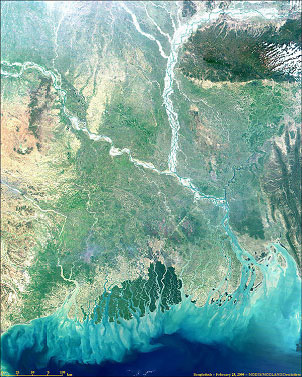
Tectonically active regions of Earth typically display characteristics and landscapes that are different from less active, more stable regions of the planet. In the next lesson, you will learn about the unique features of five geomorphic environments and settings. But now, while you've been thinking about plate tectonics, I want you to view images of landforms from tectonically active regions [140]; remember these when you study the five geomorphic environments later.
Obviously, much of the rock cycle includes processes which operate deep within Earth's interior, the details of which fall well beyond the purview of this course. While it is important to understand that these processes occur, in this lesson we will focus on those portions of the rock cycle that are immediately relevant to and operate within the Critical Zone: weathering, erosion, and deposition. To fully understand these processes, it is as important to know the rates at which they are active, which often requires the perspective of geologic time.
Geologic Time
Geologists have a much different sense of time than most of our fellow citizens of Earth. It is not unusual for me to tell friends and family about my studies of the most recent episode of past greenhouse warmth, ~50,000,000 years ago, as an analog to Earth's not-too-distant globally warmed future, and in return be subject to gaping jaws or glazed eyes. Geologists' perception of time derives from our study and understanding of the history of Earth and the vastness of geologic time. Often these concepts conflict with Biblical interpretations of geologic time; nevertheless, the majority of geologists know and accept that features like the Grand Canyon did not form in 6,000 years. Personally, I find the vastness of geologic time to be much more inspiring! But like the rest of you, I still wish my weekends and vacations were longer.
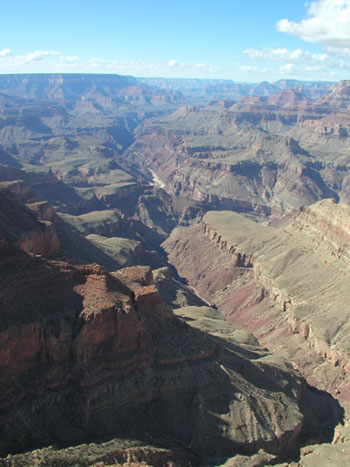
Recall from the lesson on soils that time is one of the five natural state factors of soil formation. A parent material long subjected to the forces of climate, topography, and biota is more likely to develop into soil than one subjected to only brief exposure to those factors. Following from that, the structure, texture, and horizonation of a soil can and often will become more developed and mature with time. Also, remember from the paleoclimatology lesson that paleosols exist and provide a record of the history of the Critical Zone through time. Billions-of-years-old paleosols are known to exist, providing witness to the evolution of the Critical Zone.
To learn about various aspects of geologic time, including the methods that allow us to measure geologic time and their development, visit and read:
- Geologic Time [141]
View the figure below, being sure to note the human figure in the Pleistocene Epoch—human history represents only a small fraction of all of Earth history, yet as we will learn in future lessons, we have quickly become the dominant force in shaping Earth's surface.
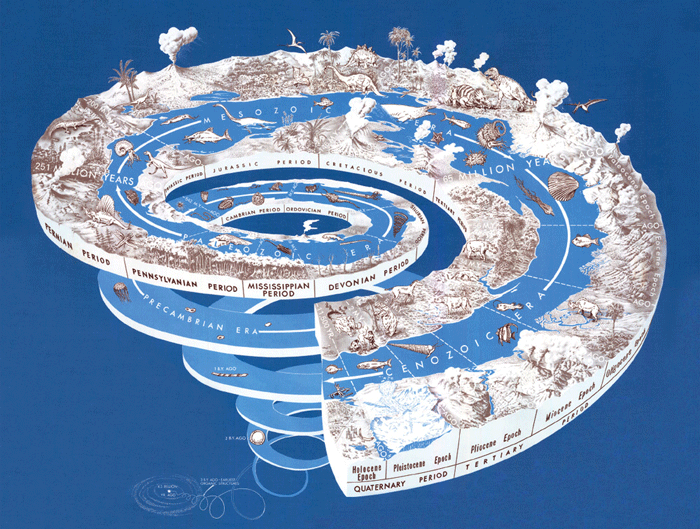
Reading assignment
As important to understanding the vastness of geologic time is the perspective it brings to understanding the rates of surface processes in the Critical Zone. Visit "Chapter 6: Geologic Time, Geologic Processes Past and Present - Uniformitarianism [143]" and focus on the description of uniformitarianism versus catastrophism.
Also, see "Geological Time [144]" for issues relating to teaching about geologic time and the notion that it requires innovation in our sense of reality.
Weathering, Erosion, and Deposition
Weathering describes the chemical and physical decomposition of rocks and minerals through contact with our atmosphere. Rocks and minerals subject to weathering are not moved during decomposition. In contrast, erosion involves the entrainment and transport of rock and mineral particles by wind, water, ice, and gravity; a reduction in velocity of the transport medium or increase in resistance of the transported particles results in deposition or the addition of material to the landscape. Note that biota (i.e., biogeomorphology [145]) can play an important role in both weathering and erosion.
Reading assignment
To learn more about the processes of weathering, erosion, and deposition, please visit and read the following:
- Erosion and Weathering [146]
- "Weathering" at Wikipedia [147]
- "Erosion" at Wikipedia [148]
- "Deposition" at Wikipedia [149]
In addition, read:
- "Physical and chemical controls on the critical zone" by Anderson et al. (2007)
which is located in Library Reserves, so that you can develop a more evolved view of the relationship between these processes and the concept of the Critical Zone as a "feed-through reactor."
You will be asked some questions related to these readings in the following activity.
Activity
For this activity, I want you to complete the two-page report you began on page 4 of this lesson.
Directions
- Open the document you began on page 4.
- As you read through the materials listed above, recall our lesson on soils and consider the role these processes have in shaping the Critical Zone. Soils consist of unconsolidated material subjected to physical and chemical weathering.
- Do you think all soil parent materials were subject to erosion and deposition?
- Are some soils the result of weathering of bedrock in place, that is not subjected to erosion and deposition?
- If so, how do soils developed directly from bedrock differ from soils developed on unconsolidated material, if at all?
- Re-save your document.
Submitting your work
Upload your report to the "Lesson 8 - Geology" dropbox in Canvas (see the Modules tab) by the due date indicated on our Canvas calendar.
Grading Criteria
You will be graded on the quality of your writing. You should not simply write responses to the questions and submit them to me. Instead plan on writing a short stand-alone paragraph (or page or whatever you decide is necessary considering any constraints I might have placed on you) so that anyone can read what you've written and understood it. You should strive to be specific and complete in responding to the questions. Your answers should be analytic, thoughtful and insightful, and should provide an insightful connection between ideas. The writing should be tight and crisp with varied sentence structure and a serious, professional tone.
Exploring Geologic Maps
Geologists use and create a variety of maps to display the results of our work. Among the simplest of these are maps of bedrock and surficial geology. Bedrock maps display the various rock types in a region. They are best understood if you can imagine stripping away all of the unconsolidated sediment, soil, and vegetation from the land surface down to solid rock. Bedrock maps do not indicate that XYZ rock type can be found at ABC locale; instead, they show what exists in the subsurface beneath the soil and sediment and vegetation. In some places, particularly out west, rocks do exist at the surface! In that case, the bedrock map shows the rock type at the surface.
Surficial geologic maps differ from bedrock maps in that they display the sediments mantling bedrock. In some places, no sediment exists and, therefore, the surficial map may show bedrock. But in others, for example in northeastern and northwestern Pennsylvania (where multiple glaciers dumped their sediment load over the past several hundred thousand years), surficial geologic maps differentiate between the various materials moved into the region by glaciation and may even differentiate between deposits of different ice ages.
Now let's take a look at the geologic maps available for your study site.
Activity
Directions
- Go to USGS AASG [150].
- Choose Map Catalog.
- Use the Google Maps/Location interface to find information for your study site. Use a similar approach as in the Groundwater study - bounding coordinates that are small, to begin with, but reach out further to find more information.
- From the check-box options provided, select bedrock and surficial under Geology heading, then click Search.
- Assess the available resources for your study site.
- Describe the results of your search and include bedrock and surficial geologic maps in a report no longer than two pages.
- Choose Resources and Hazards too—include a resource and hazard assessment of your site in the same report with all relevant maps.
- Save your document as either a Microsoft Word or PDF file in the following format:
L8_geologicalmaps_AccessAccountID_LastName.doc (or .pdf).
For example, student Elvis Aaron Presley's file would be named "L8_geologicalmaps_eap1_presley.doc"—this naming convention is important, as it will help me make sure I match each submission up with the right student!
Submitting your work
Upload your report to the "Lesson 8 - Geologic Maps" dropbox in Canvas (in the lesson under the Modules tab) by the due date indicated on our Canvas calendar.
Grading Criteria
You will be graded on the quality of your writing. You should not simply write responses to the questions and submit them to me. Instead plan on writing a short stand-alone paragraph (or page or whatever you decide is necessary considering any constraints I might have placed on you) so that anyone can read what you've written and understood it. You should strive to be specific and complete in responding to the questions. Your answers should be analytic, thoughtful and insightful, and should provide an insightful connection between ideas. The writing should be tight and crisp with varied sentence structure and a serious, professional tone.
Summary and Final Tasks
Geology, the study of Earth, is a broad and complex discipline. In this lesson, you reviewed some geologic concepts, including the difference between the three basic rock types. You read briefly on plate tectonics, geologic time, the rock cycle, and various related processes focusing on weathering, erosion, and deposition. I asked you to consider several questions regarding the role of parent material, erosion, and deposition on soil formation. Finally, various types of geologic maps were explored—the accessibility and usefulness of these resources are the most important lesson for you to draw here.
Reminder—Complete all of the lesson tasks!
You have finished Lesson 8. Double-check the list of requirements on the Lesson 8 Overview page to make sure you have completed all of the activities listed there before beginning the next lesson.
Tell us about it!
If you have anything you'd like to comment on or add to, the lesson materials, feel free to share your thoughts with Tim. For example, what did you have the most trouble with in this lesson? Was there anything useful here that you'd like to try in your own classroom?
Unit 5, Lesson 9: Landforms (2)
Lesson 9 Introduction
In the last lesson, you were introduced to the concept of the Critical Zone as a feed-through reactor (Anderson et al., 2007). As we move forward in this unit, I first want you to consider the relationship between the feed-through reactor and isostasy [151]. Imagine a mountainous setting in which active erosion constantly removes weathered material from the summits: the unloading of weathered material allows the underlying crust to readjust by uplift, thereby physically raising unweathered rock rapidly into the feed-through reactor. Eventually, the landscape may mature to one with low topography and little relief as the deep crustal root has been exposed, weathered, and brought toward isostatic equilibrium with the underlying mantle. Thick soil profiles develop and blanket underlying unweathered rock, slowing the rate at which the unweathered rock is processed through the reactor. Furthermore, recall from Lesson 2 (reading Brady and Weil, pp. 41–2 and 61–2) that topography is the configuration of the land surface described in terms of elevation, slope, and landscape position differences, and that topography can hasten or retard the effects of climate on parent material-weathering by creating a balance between erosion and pedogenesis.
Because topography often reflects the distribution of different parent materials in many landscapes, detailed soil maps can be useful for interpreting geology, and geological maps can in places be made directly from soil maps [Birkeland, P. W. (1999). Soils and Geomorphology (3rd ed.). New York: Oxford University Press, p. 31]. Mappable soil bodies typically display patterns of distribution based on underlying bedrock and landforms—to fully understand soils one must make an in-depth assessment of geomorphic settings (Birkeland, p. 49, p. 1).
Having considered the variables associated with bedrock type, the rock cycle, tectonic setting, weathering and erosion in the last lesson, now we will explore geomorphic environments and the processes that can move and shape them to learn about the links between landforms, soils, and the Critical Zone. I'll remind you here, as I did in Lesson 2, to consider the outstanding question in Critical Zone science learned in a Lesson 1 reading (Brantley et al., p. 11): Can a unified approach be developed to characterize environmental conditions and mechanisms that produce different soil types?
What will we learn about in Lesson 9?
- Geomorphology and the relationship between topography and soil formation
- Coastal processes and landforms
- Karst processes and landforms
- Glacial and periglacial processes and landforms
- Wind processes and landforms
- Fluvial processes and landforms
- Aerial photographic analysis of landforms
Learning Objectives
By the end of this lesson you should be able to:
- Discuss the notion of the Critical Zone as a feed-through reactor
- Describe a soil catena and the influence of slope and aspect on pedogenesis
- Define fluvial, eolian, periglacial and karst
- Describe and identify some features and processes characteristic of five generalized geomorphic environments
- Find remotely sensed imagery, specifically aerial photographs, for your study site
What is due for Lesson 9?
Lesson 9 will take us one week to complete. As you work your way through these online materials for Lesson 9, you will encounter additional reading assignments and hands-on exercises and activities. The chart below provides an overview of the requirements for Lesson 9. For assignment details, refer to the lesson page noted.
Please refer to the Calendar in Canvas for specific time frames and due dates.
| ACTIVITY | LOCATION | SUBMISSION INFORMATION |
|---|---|---|
| Report (1 page) on topography and feed-through reactor at your study site | page 2 | Post to the Lesson 9 - Catena dropbox in Canvas |
|
Respond to question on aerial photo availability in your state Report (1 page) on aerial photo analysis |
page 8 |
Email directly to Tim Post to the Lesson 9 - Aerial Photo dropbox in Canvas |
Questions?
If you have any questions, please post them to our Questions? discussion forum (not e-mail), located under the Discussions tab in Canvas. I will check that discussion forum daily to respond. While you are there, feel free to post your own responses if you, too, are able to help out a classmate.
Geomorphology
A remarkable aspect of Earth's surface is the seemingly infinite variety of landforms. However, some landforms possess certain characteristics that differentiate them from other landforms, a fact that is fundamental to geomorphology [152], the field-oriented study of landforms at the interface between geology and many other disciplines working to understand surface processes. The applications of geomorphic knowledge can range from engineering projects dealing with the physical properties of landforms to geological studies of the record of past climate change recorded by landforms. It is this overall lack of rigid philosophical boundaries that may be geomorphology's greatest attribute—interdisciplinarity (Ritter, D. et al., 2002, Process Geomorphology, 4th edition, p. 1–2).
Diversity in the Critical Zone is displayed by the distribution of soils across landforms, reflecting variable chemical and mechanical weathering processes as well as physical erosion and chemical denudation. These processes, in turn, control the internal structure of the Critical Zone, the feed-through reactor of Anderson et al. (2007), through which changes in surface area, flow paths, and material residence time impact element and nutrient weathering fluxes.
Activity
In succeeding sections 3 through 7 we will explore five classes of geomorphic environments and the processes that occur with them. Before we launch into this more detailed study, I want you to more fully understand basic concepts of topography, including the influence of slope orientation or aspect on pedogenesis, by completing the following activity.
Directions
NOTE:
For this assignment, you will need to record your work on a word processing document. Your work must be submitted in Word (.doc) or PDF (.pdf) format so I can open it. In addition, documents must be double-spaced and typed in 12 point Times Roman font.- Read the following book selection, which is available online through Library Reserves:
- Chapter 9 in Birkeland, P. W. (1999). Soils and Geomorphology (3rd ed.). New York: Oxford University Press.
You should leave the reading with a firm grasp of the soil catena concept. As you progress through the reading, consider the effects of topography on your soil study site. Also, think how the feed-through reactor and chemical weathering fluxes might operate in your soil study site and how it might vary between nearby environments.
- Chapter 9 in Birkeland, P. W. (1999). Soils and Geomorphology (3rd ed.). New York: Oxford University Press.
- Record your thoughts (from step 1) in the form of a one-page paper.
- Save your paper as either a Microsoft Word or PDF file in the following format:
L9_catena _AccessAccountID_LastName.doc (or .pdf).
For example, student Elvis Aaron Presley's file would be named "L9_catena _eap1_presley.doc"—this naming convention is important, as it will help me make sure I match each submission up with the right student!
Submitting your work
Upload your paper to the "Lesson 9 - Catena" dropbox in Canvas (see the Modules tab) by the due date indicated on our Canvas calendar.
Grading criteria
You will be graded on the quality of your writing. You should not simply write responses to the questions and submit them to me. Instead plan on writing a short stand-alone paragraph (or page or whatever you decide is necessary considering any constraints I might have placed on you) so that anyone can read what you've written and understood it. You should strive to be specific and complete in responding to the questions. Your answers should be analytic, thoughtful and insightful, and should provide an insightful connection between ideas. The writing should be tight and crisp with varied sentence structure and a serious, professional tone.
Fluvial Processes and Landforms
Reading assignment
Complete the following reading assignments:
- The ubiquity of streams makes fluvial action probably the most important geomorphic agent. The following hyperlink gives a good general overview of fluvial landforms and processes, beginning with what should be a reminder to you about the hydrologic cycle and surface runoff. The Web site then provides a characterization of the parts and types of rivers, drainage patterns, fluvial processes of erosion, deposition, saltation, solution, and suspension, and erosional and depositional landforms.
- The next hyperlink overlaps somewhat with the first one you visited. While studying this site, do not concern yourself with mentions of specific drainage basins unless they are of interest to you. You can peruse the section on river types and drainage basin patterns for more detail than is available at the first site. Do read the short sections on structure and tectonics and paleochannels. It is old and the pdf is relatively poor quality but there is useful information here.
- Good images of stream channel types and features can be viewed by following this hyperlink:
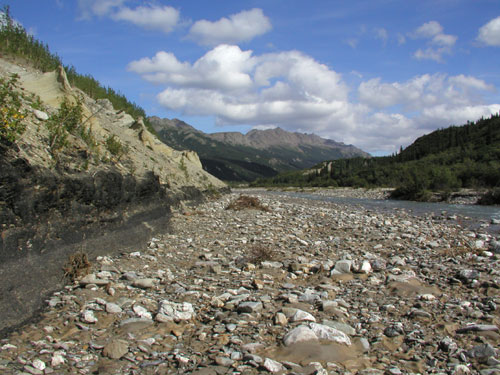
Wind Processes and Landforms
Wind can be an effective geomorphic agent. Obviously, the presence of regular and/or strong wind is required for a specific landscape to be dominated by wind erosion and deposition, but various physical properties are also important. For example, regions showing a paucity of vegetation or preponderance of unconsolidated sediment are more susceptible to wind erosion.
Reading assignment
Complete the following reading assignments:
- The adjective "eolian" is used to describe processes of wind erosion and deposition and the resultant deposits and landscapes. Please visit and study the following hyperlink to learn about eolian processes and landforms. Be sure to leave the site having grasped concepts covering the relationship between velocity, entrainment and transport, and the variety of erosional and depositional eolian landforms.
- For more detail and good imagery of dune fields check out Pattern Indicators in:
Glacial and Periglacial Processes and Landforms
In an activity in Lesson 4, you learned about the formation of glaciers and the role and effect of glaciers on climate. Now we turn our attention to some of the most spectacular landscapes on Earth—the result of glacial erosion and deposition. Understanding glacial motion, recorded in glacial landforms, is fundamental to current considerations of ice sheet meltback, sea level rise, and global climate change.
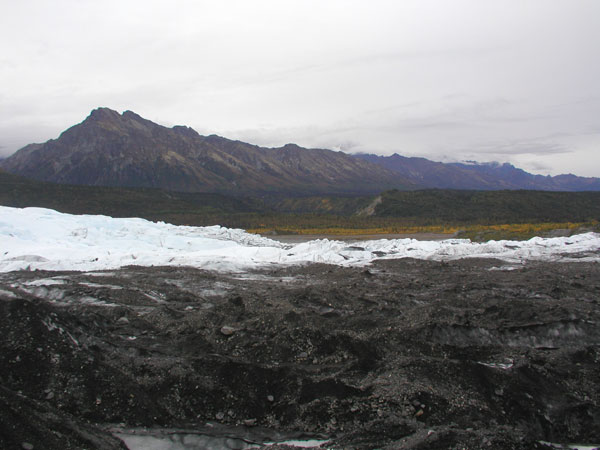
Reading assignment
Complete the following reading assignments:
- When you visit and study the following Web site, review the causes of glaciation and glacier motion that you learned about in Lesson 4. Then move on to learn about the anatomy of and types of glaciers, glacier erosion, sediment transport and deposition, and the resulting continental and alpine landforms.
- Glacial Systems Outline [158]
- For additional information, mostly review but with nice imagery, follow this hyperlink:
- In cold regions often near glaciers, periglacial environments and processes are recognized. While permafrost has been a characteristic feature of these landscapes, climate change is slowly reducing its presence and creating challenges for human society. Permafrost, present during the Last Glacial Maximum, is at least partly responsible for much of the landscape of Pennsylvania and surrounding Appalachian states. Periglacial processes and landforms are described at the following web site focusing on permafrost, freeze-thaw weathering, ground ice, mass movement, and the erosive processes of nivation, wind, and flowing water.
Watch this!
Remember my visit to Bear Meadows in Lesson 3? You might want to re-watch that video to refresh your memory . . .
Video: A Trip to Bear Meadows (05:40)
Atmospheric Carbon & Organic Carbon Storage in the Critical Zone
TIM WHITE: I've traveled to Bear Meadows, a national natural landmark, about eight miles southeast of Penn State's main campus in central Pennsylvania. I've brought you here today to describe the relationship between atmospheric carbon dioxide content and organic carbon storage at the surface of the Earth within the critical zone. Let's go have a look at the bog.
Bear Meadows is a peat bog that began forming nearly 10,000 years ago, shortly after northwestern and northeastern Pennsylvania were covered by vast ice sheets that extended far to the north into the Hudson Bay region and Canada. The closest those ice sheets reached to State College and the Penn State campus here was northeast of Williamsport, nearly 30 miles away. One of the tasks I'd like to accomplish while we're here is to probe the peat in the bog and have a look at what it's made of, and so to do that I'm going to walk along the edge of the bog-- in the background you can see where I'm going to go-- and I'm going to get my soil auger so I have a way to probe and sample the peat.
Recall that plants use water, atmospheric carbon dioxide, and energy from the sun to build their organic framework through photosynthesis. Therefore, plants draw down atmospheric carbon dioxide as part of their life habit. When plants die, the organic matter is oxidized and carbon dioxide is returned to the atmosphere.
This wet, boggy setting is perfect for the preservation of organic matter and organic carbon. If you look beneath the water's surface, you can clearly see various organic constituents related to the plants that live around in the bog. I can see maple leaves and abundant roots associated with these grasses. If plants die and their various organic constituents are preserved, as is the case here in the bog, the original carbon in the atmospheric carbon dioxide that was photosynthesized by the living plant is also stored or preserved, rather than being returned to the atmosphere through decay. We call the site of such processes a carbon sink.
I'm probing the peat with an auger to see how deep I can get to the base of the bog to see if I can get a peat sample from the base of the bog here. You can see that I've penetrated over a meter of the peat and I've obtained a sample from the base of the bog. And you can see that the peat down there is made up of a fine organic muck, along with a number of roots and some grass leaves, similar to what you'd find right here at the surface.
Further out in the bog, there are places where 15 feet of peat have accumulated over the last 8,000 or so years. That means that 8,000 years ago, carbon was removed from the ancient atmosphere, stored here in the peat, and remains today.
One last thought before we leave, and that relates to the time scale of organic carbon storage in the critical zone, I've told you that organic matter has been accumulating here over the last 8,000 years, but this setting exists within the Appalachian Mountains and the fate of mountains ultimately is to be eroded, which is happening to these mountains today. So while this organic carbon remains stored here now, over long geologic time scales-- hundreds of thousands to millions of years-- this peat will be oxidized and that ancient organic carbon would be returned to our modern atmosphere.
Glacial geomorphology has proven quite useful to planetary geologists interested in understanding the evolution and history of the surface of nearby planets in our solar system. Visit the following hyperlink for a brief introduction to glacial geomorphology and Mars.
You may find the following resources useful in your classroom:
- Glacial Processes [162] This Powerpoint slide show covers processes of glacier formation, erosion, sediment transport and deposition, the difference between alpine and continental glaciers, and the recent glacial history of Earth.
Karst Processes and Landforms
Unique landforms and patterns of drainage called karst or karst topography primarily form in temperate to tropical regions, though they are found in arid and polar regions too. The common feature shared by all karst landscapes is that they are underlain by chemical sedimentary rocks particularly susceptible to dissolution, carbonates and/or evaporites. The landforms result mostly from chemical weathering of the host rock and the progressive integration of subsurface cavities, though collapse into solution cavities can also be important. Karst landscapes are often dominated by underground drainage networks that interrupt and capture surface water flow.
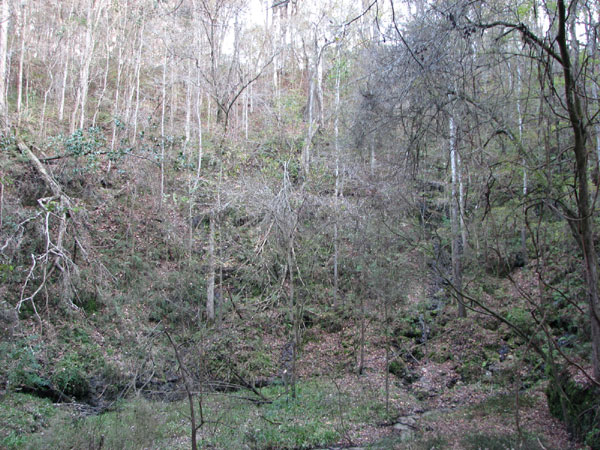
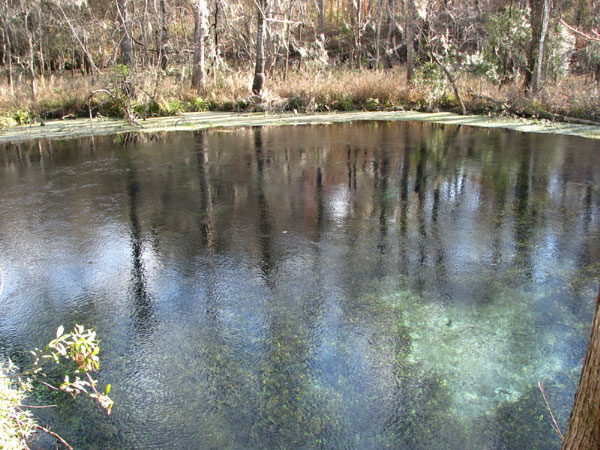
Reading assignment
For a relatively succinct definition of karst, from the Canadian perspective, follow this hyperlink:
- Karst Landform [163]
Of the karst-forming rocks, the carbonates (dolostone and limestone) are much more abundant than evaporites (mostly deposits of gypsum and anhydrite), therefore karst landscapes are most often found in regions underlain by carbonate rocks. The following Web site will help you learn more about limestone karst, including information on the relationship between lithology, porosity, permeability and karstification, the distribution of karst lands in the United States, the driving mechanics of karst processes, and links between surface water flow, aquifers, and groundwater.
- Karst Processes [164]
Watch this!
To learn about the distribution of karst landforms in central Pennsylvania, the relationship to lithology, and groundwater flow, watch the following video of my visit to Tussey Sink.
Video: A Visit to Tussey Sink (08:03)
TIM WHITE: We're now in that portion of the course where we're considering landforms and how critical zone processes differ on different parts of the landscape. Much information can be gleaned from the study of geologic maps. For example, in this geologic map of the eastern half of the United States, you can clearly see parallel, curving lines that highlight the Appalachian Mountains. Geologists recognize this map pattern as characteristic of folded and faulted strata, the valley and ridge province, similar to what you'd form if you compress and folded a floor rug.
In this lesson, we'll focus on limestone and dolomite, within the variety of rock types in the Appalachian Mountains. In the closeup map of Pennsylvania, you can clearly recognize parallel, curving lines similar to the ones we viewed in the Appalachian Mountains, but here those lines highlight regions underlain by limestone. Next, we'll make a site visit to take a closer look at landforms associated with limestone.
Introducing the Tussey Sink
Welcome to Tussey Sink. We've driven about 10 miles southeast of the geology building at Penn State, where we just looked at some geologic maps of the US and Pennsylvania. And now we have in front of us a much finer detail map, a 7 and 1/2 minute quadrangle map of the Centre Hall region. You can see in the upper left-hand portion in the map, there are a number of parallel lines. And in the lower right-hand portion of the map, similar parallel lines. Whereas in the central part of the map, there are a bunch of dots superimposed on those parallel lines. And it's these dots that are the focus of our lecture today because one of them sits behind us here, Tussey Sink.
Now let's think about this map in a little bit more detail. Here we are at Tussey Sink. And I want you to notice that we're on the edge of this zone that I earlier referred to as containing all the dots. In the upper left-hand corner of the map, where there are no dots, is Nittany Mountain, which you can see in the background. And in the lower right-hand corner, again where there are no dots, behind us, you can see Tussey Mountain.
It's important for you to understand that there are similarities between the bare portions in the map and that these two regions in the map are different from the portion that contains all the dots. The areas that are bare, that is the two ridges we pointed to earlier, are both underlain by shale and sandstone. Whereas this area covered by these dots is underlain by limestone.
Now let's take a walk into Tussey Sink and have a look at the rock types that are contained within it. We have walked about thirty feet from the car into the sinkhole, and we're beginning to descend towards the bottom of it. The first thing I'd like you to notice is that you can see water-- and I'm pointing off to my right, upstream-- that flows down off Tussey Mountain into this sinkhole feature. And if you look over here to my left, there is no more water. And there's a reason for that. That is, there's a reason for this dry stream bed. And that's visible, again over here to my right, where you can see that rock outcrop. That outcrop is limestone, which has a conduit in it, into which that stream disappears.
Conduits like this, and this entire sinkhole that we're within, are unique to limestone terrains. And so what is it about limestone that leads to the formation of these unique features? Well, as geologists, we use hydrochloric acid as a means of verifying whether or not a rock is limestone. And here you can see, when I put hydrochloric acid onto this rock, there's a very vigorous reaction that leads to the formation of carbon dioxide bubbles. This is unique to limestone. Over time, the reactions like this that naturally occur, from dilute carbonic acids formed in the atmosphere, cause the dissolution of limestone and the formation of these features.
We're looking at the water flowing into this hole, or conduit, in the limestone. And it's important for you to recognize that we're in the midst of a very dry fall here in central Pennsylvania. Under normal stream flows, this hole would not be able to accept all the water that flows down this stream channel. And the stream would continue down in the direction I'm pointing, into the dry area that you saw from above. Further downstream from there is the terminus of this sinkhole complex, into which even in the highest flood stages this stream disappears into the subsurface.
Now we're gazing down into the terminus of this sinkhole complex. And it's at this point that, even in the highest flood stages of the stream we were just looking at, it entirely flows into the subsurface here.
One Month Later
It's late November, and we've returned to Tussey Sink after substantial rainfall. You can see that the stream runoff into the sinkhole complex is much greater than earlier in the fall. We followed a leaf as it flowed down the stream and doubled back into the crevice we talked and spoke about earlier in the semester. You can see that the capacity of the crevice to receive the stream flow has been exceeded. Not just because of the limited size of the crevice, but also because it's clogged with leaves and twigs. And so the remaining stream flow is flowing down through the stream channel behind me and into the main sinkhole of the Tussey sinkhole complex.
Remember, we began this lesson by looking at the Centre Hall 7 and 1/2 minute quadrangle map. And on that map I showed you that there were regions in which there were no sinkholes developed, those were the ridges underlain by shale and sandstone, and then the valley where the limestone was, where we just came from. This is a small quarry within the shale that was excavated to build the road that we drove here on. But the important thing to understand is that shale is not subject to dissolution, and therefore, there are no sinkholes developed on the shale terrain.
Remember that earlier we talked about the capacity of different rock types to dissolve under the influence of acid. I'm going to do my acid test again. Let's see what happens.
No reaction. What does this mean? Well, this explains the reason why sinkholes form in limestone and not on shales. It also explains the distribution of the sinkholes within the map that we looked at. That is, the sinkholes exist within the limestone terrains but not in those parts of the map underlain by shale and sandstone.
Check this out . . .
Some basics of karst processes and landscapes focused on caves are presented at Teachers' Domain as "I [165]ntroduction to Caves and Karst." [166]
Coastal Processes and Landforms
Nearshore coastal environments host most of humanity, at the interface between the vast oceans that cover 70% of Earth and the continents, home to all our soil and the Critical Zone. The oceans possess energy that is transferred to and manipulates land through erosion and deposition. Humanity's land use has greatly strained coastal environments; therefore, a thorough understanding of coastal processes betters our chances of sustaining life and human endeavors in this very dynamic environment. Be aware that these concepts apply to shore lines along large lakes, too!
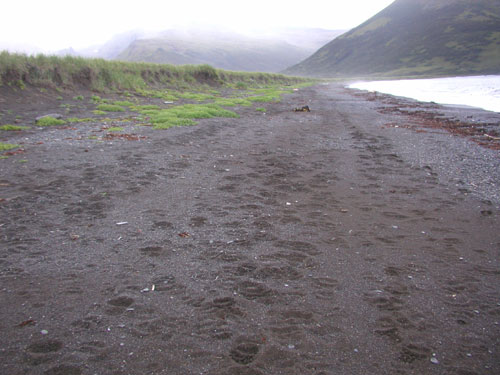
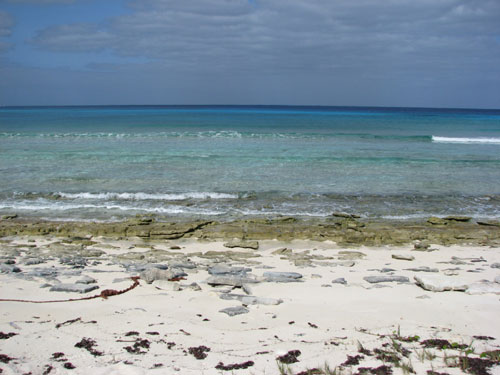
Reading assignment
To learn about shoreline processes and coastal evolution, wave refraction and erosion, sediment transport and deposition, and submergent and emergent coastlines through a series of schematic diagrams, follow this hyperlink:
More information on classification, with nice imagery, can be studied at:
- Coastal Erosion Features [168]
The following two hyperlinks lead to other reviews of coastal processes and landforms, as well as wave refraction, erosion, and deposition, importantly with nice images:
Check it out . . .
To view a slide show covering coastal erosion, corrasion and corrosion, subaerial procesess, and coastal classification, including nice images of headlands and bays, wavecut notches and platforms, cliffs, sea caves, and arches, and the stages of coastal development, see:
Remote Sensing and Aerial Photography
While field studies are essential for understanding the geomorphic environment or setting of a region, remote sensing imagery—specifically easily obtained aerial photographs and satellite imagery—provides a broad overhead view, a context in which to place field observations. For this reason, in this section of the landform lesson, we will explore various online resources that provide overhead imagery. Before you begin the following activity, go to Fluvial/Deltaic/Coastal Landforms [172] and Karst/Lacustrine/Aeolian/Glacial Landforms [173] to view aerial photographs representative of the major geomorphic environments presented in sections 3 through 7 of this lesson.
Activity
Directions
NOTE:
For this assignment, you will need to record your work on a word processing document. Your work must be submitted in Word (.doc) or PDF (.pdf) format so I can open it. In addition, documents must be double-spaced and typed in 12 point Times Roman font.- The EROS Data Center [174] is the major government clearinghouse for aerial photographs and imagery in the United States. Follow the hyperlink to the EROS Data Center site, and click on the "Aerial" image gallery link. This will take you to the available Aerial Products. The first line in the table has information available through NAPP.
- Choose Find Data, then Aerial Photography under the Products & Data Available list.
- Scroll down to National Aerial Photography Program (NAPP) -- then Get Data from the header bar.
- Use USGS EarthExplorer -- input an address or use the clickable map to view aerial photographs of your study site.
- Return to the EROS Data Center - Find Data page and choose "Satellite Imagery" to view the available Satellite Products.
- Explore what is available for your study site. At a minimum, view the Landsat TM imagery through EarthExplorer. Alternatively, you may choose to access Landsat imagery through the LandsatLook viewer. [175] The imagery you find here should be included in your semester project report.
- You may also want to visit the Color Landform Atlas of the United States [176] and Flash Earth [177] to be sure you've covered all the bases! Google Earth too.
- Also, visit Principles in Remote Sensing [178] to learn more about remote sensing in general and some specifics about the various sensors and data.
- Aerial photographic coverage for Pennsylvania are archived and made accessible through Pennsylvania Spatial Data Access [179] (PASDA), which includes historical archives available for the state. Other state surveys do, too. Does the home state of your study site provide similar resources?
- TerraServer [180] is another Web site that provides access to aerial photographs of the United States. Visit the site to determine whether TerraServer provides additional resources beneficial to your semester project.
- While there, or using Google Earth, use the coordinates tab (;at/long - decimal) to view the sites listed below (longitude, latitude). Note that negative longitude values indicate west. TerraServer is a commercial company that recently opted to brand the photography so you cannot simply screen capture the imagery, thus it may be a little challenging to see past the name - try anyway, or use Google Earth.
- -105.57229, 37.78748
- -101.64845, 41.82330
- -91.47299, 30.65249
- -146.95036, 64.34985
- -66.88306, 18.43125
- -81.92303, 29.35791
- -76.65703, 42.99389
- -77.02833, 42.52195
- -75.51855, 35.22025
- -124.20464, 43.92189
- For each site, record a few sentences describing what you see and classifying the site using one of the five geomorphic settings discussed in sections 3 through 7. Consider whether zooming in or out will help your classification effort.
- While there, or using Google Earth, use the coordinates tab (;at/long - decimal) to view the sites listed below (longitude, latitude). Note that negative longitude values indicate west. TerraServer is a commercial company that recently opted to brand the photography so you cannot simply screen capture the imagery, thus it may be a little challenging to see past the name - try anyway, or use Google Earth.
- Write a one-page report that contains the following:
- A statement regarding whether the home state of your study site provides similar resources to Penn Pilot (Step 3).
- Your descriptions and classifications for each site listed in Step 4.
- Save your report as either a Microsoft Word or PDF file in the following format:
L9_remotesensing_AccessAccountID_LastName.doc (or .pdf).
For example, student Elvis Aaron Presley's file would be named "L9_remotesensing_eap1_presley.doc"—this naming convention is important, as it will help me make sure I match each submission up with the right student!
Submitting your work
Upload your report to the "Lesson 9 - Remote Sensing Report" dropbox in Canvas (in the lesson under the Modules tab) by the due date indicated on our Canvas calendar.
Grading criteria
You will be graded on the quality of your writing. You should not simply write responses to the questions and submit them to me. Instead plan on writing a short stand-alone paragraph (or page or whatever you decide is necessary considering any constraints I might have placed on you) so that anyone can read what you've written and understood it. You should strive to be specific and complete in responding to the questions. Your answers should be analytic, thoughtful and insightful, and should provide an insightful connection between ideas. The writing should be tight and crisp with varied sentence structure and a serious, professional tone.
Check this out . . .
Go to the NASA website and view the learning module Blue Marble Matches [181] - you may find it to be something to introduce into your classroom!
Summary and Final Tasks
In this unit, we have focused our attention on the lithosphere and explored a number of aspects of geology and geomorphology, mostly focused on parent material and topography factors in soil formation. It should be clear to you that Earth's surface is covered by landscape elements that can be classified according to processes and landforms unique to those processes. You should also know that while geomorphology and geology are field-oriented sciences, the study of remotely sensed imagery can greatly enhance our understanding of a landscape and the processes that formed it. Considering the resources you've been introduced to in this lesson, you should also now know how to obtain such imagery for your own use.
Reminder—Complete all of the lesson tasks!
You have finished Lesson 9. Double-check the list of requirements on the Lesson 9 Overview page to make sure you have completed all of the activities listed there before beginning the next lesson.
Tell us about it!
If you have anything you'd like to comment on or add to, the lesson materials, feel free to share your thoughts with Tim. For example, what did you have the most trouble with in this lesson? Was there anything useful here that you'd like to try in your own classroom?
Unit 6, Lesson 10: BIOTA (1)
Lesson 10 Introduction
The variety of life on Earth exists as a myriad of microscopic and macroscopic forms. This biological diversity, or biodiversity, can be described at scales ranging from planetary, biome, or ecosystem to site-specific. Biodiversity includes genetic variation within species, the variety of species in an area, and the variety of habitats within a landscape. Roughly 1,750,000 species have been described and formally named, though estimates of the total biodiversity of life on Earth range from 5 to 30 million, with some estimates as high as 100,000,000 total species.
Most of terrestrial life reproduces, feeds, lives, and dies in the Critical Zone (see "Soil Biodiversity" [182] at Wikipedia for a brief introduction to soil biodiversity topics). Soil is intimately linked to biodiversity: soil provides the substrate through which much of the terrestrial biosphere interacts with the Critical Zone and its other component "spheres," and biota exert a significant influence on soil formation and Critical Zone processes. For example, plants absorb atmospheric carbon dioxide and store it in roots—eventually root respiration adds carbon dioxide to the soil atmosphere, changing, and at times controlling, weathering rates and other chemical processes within the soil and Critical Zone. A primary function of roots is to absorb water and nutrients, activity that directly influences the hydrosphere by drawing in soil moisture and dissolved constituents. This influences recharge rates and the chemistry of the soil and groundwater system. Roots also anchor plants within the Critical Zone and physically erode rocks by penetration and wedging, thus influencing interaction with the lithosphere.
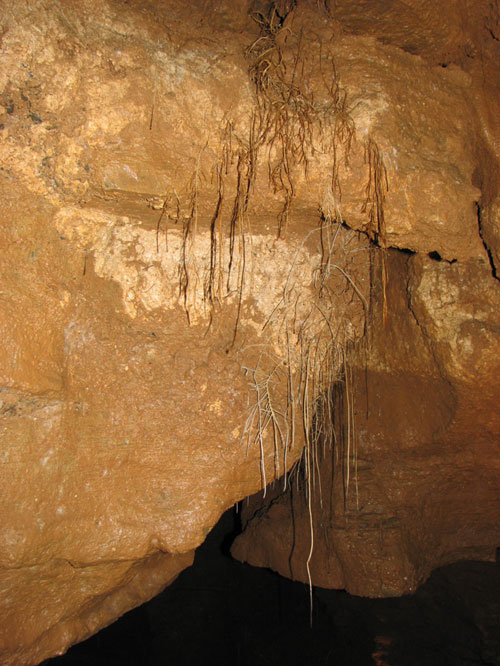
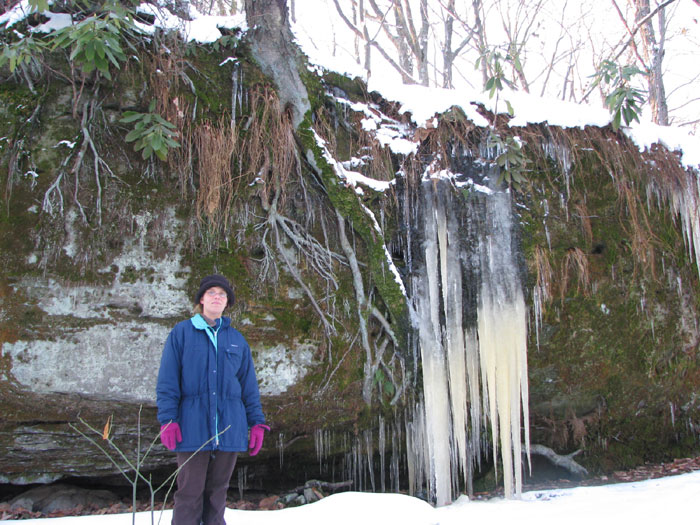
But it is yet more complicated than that! Each species or organism may have a unique role in an ecosystem and therefore may interact with the Critical Zone in a different way. Furthermore, the interactions between organisms can be unique to species or unique to a specific habitat or ecosystem. Let's think about plants again. Cellulose, a potential source of energy, is tough and insoluble to most organisms. But termites (and grazing animals) contain microorganisms in their digestive tracts that convert cellulose to sugars usable by them and their hosts. Thriving termites in turn clear the landscape of dead plant litter, recycle contained nutrients back to the soil, and enhance soil porosity and permeability through construction of their subterranean chambers. An overall decrease in soil productivity and fertility has been observed in the absence of termites; thus, if not for those gut flora, a substantially different, and perhaps less fecund, ecosystem might exist.
Most cultures have recognized the importance of biodiversity for boosting overall ecosystem productivity and resilience to disasters. Yet continued destruction of habitat and species by human society is leading to what some biologists and paleontologists call the “Sixth Extinction,” perhaps the most rapid and destructive of extinctions in Earth history. Imagine total global human destructiveness perhaps exceeding the comet impact that occurred at the end of the Cretaceous [183] Period that finished off the dinosaurs!
In Lesson 10, we will consider the various means by which biologists and other natural scientists classify life on Earth. From there, we will launch into concepts of ecology, examining some of the interactions and processes between organisms and their environment—this examination will gradually focus in on the Critical Zone and soil processes that involve biota. We will complete Lesson 10 with an online forum to discuss the merits of placing a financial value on ecosystem processes. In Lesson 11, we will take a closer look at various expansive ecosystems of Earth and consider the relationship between them and the rest of the Critical Zone.
Watch this!
Learn about some interesting examples of the role of life in the Critical Zone.
Video: Biota in the Critical Zone (11:44)
DR. TIM WHITE: Greetings. Behind me, you can see the Nittany Valley, State College, and the Penn State campus. And I just want to point out to you that you can see a mix of land uses, including the town, and forest, and agricultural fields. Prior to European colonization of North America, this region would have been entirely forested, including that valley behind me.
In 2007, when I began teaching EARTH 530, I didn't make an introductory video for unit six on the biosphere, and thus here we are in 2014 making that video. Much has happened in the interim. For example, Earth's population has grown by 500 million people to over 7 billion total people living on earth.
Much of society has begun to recognize the degradational effects of human activities on the landscape. Let's consider an example. You likely recall that I am a geologist. Thus, this example I will provide of humanity's effect on the critical zones is from the geological literature-- a study from 2005 by Bruce Wilkinson.
Look at the graph in front of you, and notice that, on either one of the y-axes, is described annual loss of sediment and soil, either measured in tons or in meters per million years. On the x-axis, you can see time from the present on the right, to 2000 years before present on the left. The solid black line crossing the graph shows a long term average natural erosion rate, calculated by various means, through geologic time.
What you should notice, then, is that in the open diamond is shown this cumulative effect of erosion by human processes. Early on in humanity's history, this is primarily by agriculture. And as you move from the left to the right of the diagram, following those open diamonds, you'll see that the rate increases. And that increases as a function of agricultural activities, as well as industrial and construction activities.
The point of this graph is that, if you compare this open diamond at present to the solid black line crossing the graph, showing natural erosion rates, you should notice that there's an orders of magnitude shift in humanity's erosive effect to values that now exceed long term natural rates by as much as 50 times. I want to stress what I just said. The combined effects of humanity at present now erode and transport more solid material on Earth's surface then all natural processes combined.
Our 7.1 billion people move more dirt than all wind, streams, rivers, and glaciers combined. Thus, in this unit six, when we consider biotic effects on the critical zone, we cannot ignore humanity. Throughout the semester, you've been exposed to various topics associated with human degradation of the critical zone. In lesson 12, you will focus on this topic to provide some context. In unit six, we will consider topics of biodiversity and ecological processes, and ways in which landscape scale characterization of biotic attributes may be considered.
Life on earth can be classified into six kingdoms. Of these kingdoms, most people are familiar with the plant and animal kingdoms. Kingdoms are further subdivided, and the finest level of that subdivision is species. To give you some perspective on numbers, some estimates suggest that 8.7 million species exist on earth. And that means that up to 90% of life on Earth has yet to be discovered.
Each organism may play a unique role in its ecosystem, and therefore may impact the critical zone in a unique manner. Let's consider some examples. We've hiked about two miles on this glorious July day to this clearing in the Rothrock State Forest. The clearing is here due to a combination of human and invasive species. But the continued presence of the clearing-- the maintenance of it, if you will-- is due to colonization by Allegheny mound ants.
In the background here, you can see at least three ant mounds. And those mounds range in size from three to four feet in diameter, and two to two and 1/2 feet high. Let's have a closer look. The Allegheny mound ants are known to create mounds up 10 feet in diameter and five feet high, with tunnels that extend to similar depths below ground.
In the process of building the mounds, the ants churn the soil, thus introducing fresh mineral matter from depth, to the more intensive weathering environment at the surface. Their tunnels increase soil porosity, thereby providing pathways for water and gas transfer deeper into the soil than otherwise would be possible. The ants also inject formic acid into nearby vegetation, does thus it and easing expansion of the colony.
Here you can see a halo of dead blueberry branches surrounding this active colony. Here you can see an abandoned colony that's six feet in diameter and up to 2 and 1/2 feet high. We can tell it's abandoned because it's now vegetated by mosses and grass. The resident black bear population likes to eat the ants and their eggs, which may explain the presence of this crater in the top of the once thriving colony.
The sound you hear is from hundreds of thousands of cicadas that have erupted from the landscape during these few weeks approaching summer solstice, another example of life interacting with the critical zone. The cicadas emerge from soil burrows, churning the soil, and introducing mineral matter from depth to the surface. Notice the pen for scale. The burrows also increase soil porosity, thereby providing pathways for water and gas transferred deeper in the soil profile than might otherwise be possible. The combination of molted larval exoskeletons and dead adult cicadas may also periodically introduce a new source of organic matter to the surface litter of the forest floor, and [INAUDIBLE] of the forest soil.
The first example was from the animal kingdom. And now I'd like to consider what, for most of you, is going to be a less obvious effect of the plant kingdom. If a tree falls in the woods, does it matter?
Here beside me, you can see a fallen deciduous tree. And you can also see that the root mass of that fallen tree has incorporated large pieces of rock, and sediment, and soil-- what geologists call tree throw. In this process, the tree rips up the substrate and churns the soil, aerating an otherwise subterranean realm, and setting off a cascade of changing geochemical and ecological processes.
In a typical Appalachian Mountains setting, this process can entirely overturn a landscape in a few thousand years. On a slope, the effect can be relatively dramatic. In the Appalachian mountain region, a typical hill slope, away from the erosive effects of a stream, erodes primarily by gravitational processes that geologists call creep.
Creep is the slow, downward slide of loose soil mantle on top of a more compacted and less mobile zone of soil and rock. Detailed studies of the rates of sediment and soil movement and erosion by tree throw demonstrate that tree throw erodes at a rate that is at least two orders of magnitude greater than creep. Thus, in temperate regions of earth, like the Appalachian Mountains, trees are the dominant erosive force on the landscape, other than humans.
I hope these examples have demonstrated that the biosphere interacts with the critical zone in unique ways that may not be immediately obvious just to most people. As you study the biosphere in unit six and consider the critical zone near your home or school, remember this complexity and value it-- a topic we will also consider in this unit six.
Lesson Overview
In this lesson, we will examine basic ecological processes, eventually focusing through reading on links to the Critical Zone. This knowledge will prepare us for a closer examination of ecosystem-scale Critical Zone processes in Lesson 11 and our consideration of human interactions in the Critical Zone, in the manner of Earth system science, in our final lesson.
What will we learn about in Lesson 10?
- What is biodiversity? How is it measured?
- How is life classified and how is biodiversity measured?
- How do organisms interact with their environment and influence the flow of water, energy, and nutrients?
- Do ecosystem processes have value?
- How do the topics of biodiversity and ecology relate to the Critical Zone?
What is due for Lesson 10?
Lesson 10 will take us one week to complete. As you work your way through these online materials for Lesson 10, you will encounter additional reading assignments and hands-on exercises and activities. The chart below provides an overview of the requirements for Lesson 10. For assignment details, refer to the lesson page noted.
Please refer to the Calendar in Canvas for specific time frames and due dates.
| ACTIVITY | LOCATION | SUBMITTED FOR GRADING? |
|---|---|---|
| Report on "Site-specific ecological processes" | pages 3, 5, & 6 | Submit to the "Lesson 10 - Ecological Processes" dropbox in Canvas |
| "Merits of Valuing Ecosystem function" | page 7 | Post to the "Lesson 10 - Ecosystem Value" discussion forum in Canvas, then discuss |
Questions?
If you have any questions, please post them to our Questions? discussion forum (not e-mail), located under the Discussions tab in Canvas. I will check that discussion forum daily to respond. While you are there, feel free to post your own responses if you, too, are able to help out a classmate.
Biodiversity
Reading assignment
Before we begin to explore the main topic of ecological processes in the Critical Zone, I want you to first study and consider biodiversity.
To learn more about the measurement, distribution, and control of the biodiversity of life on Earth, please visit and read:
- Biodiversity [184] (from the Encyclopedia of Earth)
Next, read the following article, located through Library Reserves:
- Swerdlow, J. L. (1999). Biodiversity: Taking stock of life. National Geographic, 195(2), 6–31.
Enjoy this reading. Learn that the upper reaches of the Critical Zone in an Ecuadoran forest canopy contains ~42,000 insect species per 2.5 acres. View and study the figure entitled "Life's rich tapestry" on pages 21–22. Note that the maintenance of biodiversity is attributed to a wide variety of microhabitats and environments in genetic studies of soil bacterial microdiversity, as the tropical-like variety of plant species in temperate South Africa is similarly maintained, whereas in dry central Australia the type and amount of vegetation dictate animal diversity.
Activity
As you reflect on what you just read, complete the following activity.
Directions
NOTE:
For this assignment, you will need to record your work on a word processing document. Your work must be submitted in Word (.doc) or PDF (.pdf) format so I can open it. In addition, documents must be double-spaced and typed in 12 point Times Roman font.
L10_ecologicalprocesses_AccessAccountID_LastName.doc (or .pdf). For example, student Elvis Aaron Presley's file would be named "L10_ecologicalprocesses _eap1_presley.doc"—this naming convention is important, as it will help me make sure I match each submission up with the right student!
- Consider natural scientists' drive to understand biodiversity in light of the accelerating rate of human-caused extinctions of life. While you do, think specifically about biotic interactions in the Critical Zone at your study site, and, in particular, what role extinction of various life forms may have played or play in the Critical Zone at your site. Can you think of any way to determine the land-use history of your site? A means to assess changes in forest cover?
- Record your thoughts as the start of a 3–4-page paper that you will continue working on later in this lesson.
- Save your paper as either a Microsoft Word or PDF file in the following format:
- Continue with this lesson.
Classification of Life
The myriad variety of life is classified in a number of ways, dependent on scientific questions and need. Scientists utilize taxonomy to name and classify organisms, and they use systematics to create phylogenies—the evolutionary history of a species or group of species. Perhaps the most commonly known classification scheme utilizes evolutionary relatedness and a hierarchy of increasingly exclusive categories: domain, kingdom, phylum, class, order, family, genus, and species.
Reading assignment
- To learn more about topics of classification, visit General Biology/Classification of Living Things/Classification and Domains of Life [186].
- Organisms can also be classified according to the manner in which they derive their life energy, or nutritional mode—chemoheterotrophs, chemoautotrophs, photoheterotrophs, and photoautotrophs, for example. Autotrophs ("self feeders") are organism dependent upon CO2 as their sole source of carbon, whereas heterotrophs ("feeders on others") cannot grow solely with CO2 and therefore must use organic compounds derived from other organisms. To learn more about this topic, visit Autotroph -v- Heterotroph [187].
- Scientists assign organisms to trophic levels based on their source of nutrition and energy. The trophic level that supports all others contains the primary producers and consists of autotrophs. Organisms in higher trophic levels are heterotrophs, subdivided further into categories like primary, secondary, and tertiary consumers. Follow these hyperlinks to learn more about trophic levels and dynamics [188].
- For information on classifying life in soils, visit Soil Organisms [189].
Check it out . . .
The following hyperlink provides a nice classroom Powerpoint slide show: Naming and Classifying Organisms [190].
Ecological Processes
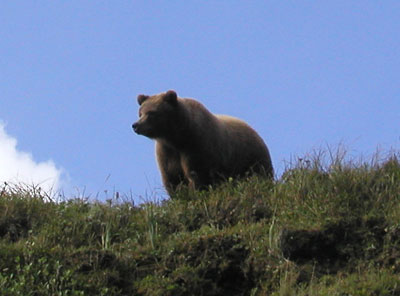
Ecology, the study of the interactions between organisms and the environment, can be arranged into categories mostly based on increasingly generalized interactions between multiple organisms and their habitat. For example:
- Organismal ecology studies a specific organism's structure, physiology, and behavior
- Population ecology studies a group of a single organism
- Community ecology studies interactions between different organisms
- Ecosystem ecology emphasizes energy flow and biogeochemical cycles
- Landscape ecologists study mosaics of connected ecosystems
- Global ecology recognizes that the biosphere is truly a global system—the sum of Earth's ecosystems and landscapes
Activity
For this activity, I want you to continue working on the 3–4-page paper that you began on page 3 of this lesson.
Directions
NOTE:
For this assignment, you will need to record your work on a word processing document. Your work must be submitted in Word (.doc) or PDF (.pdf) format so I can open it. In addition, documents must be double-spaced and typed in 12 point Times Roman font.
- To learn more about the interactions between organisms I want you to read the following book chapter, located in Library Reserves: Chapter 52 from Biology by Campbell & Reece (8th edition), "An Introduction to Ecology and the Biosphere." [191]
- While reading this chapter, pay particular attention to the descriptions of biotic and abiotic factors that control organismal interactions. Consider dispersal by natural range expansion and species transplantation, as well as behavioral and habitat selection.
- The section on climate should be review—feel free to skip it or use it as a review.
- Read the section on aquatic biomes, noting that lakes, wetlands, streams, and rivers are all part of the Critical Zone. While coastal zones are included in the Critical Zone, most of the section on oceanic biomes is irrelevant to this course and you can skip it.
- The "Terrestrial Biomes" section is important—read it carefully, paying attention to the section "Exploring Terrestrial Biomes" and keeping in mind that we will return to this subject in more detail in Lesson 11.
- Study the climograph comparing major biome types in North America. As you do so, record your answers to the following questions on the paper you began on page 3 of this lesson:
- How does your study site fit into the climograph?
- Does the generalized biome indicated on the climograph match your site biome?
- Summarize the biotic and abiotic characteristics of your site that most influence on-site ecology and interactions in the Critical Zone.
- Do you expect global warming will alter the ecology of your site? Be specific: use estimates of changes in temperature and precipitation gleaned from Lesson 5 when you read about regional climate change in North America with some case studies.
- Next, read the following book chapter, located in Library Reserves: Chapter 29 from Biology of Plants by Raven et al (5th edition), "The Dynamics of Communities and Ecosystems." [192]
- Though this chapter focuses on plants, many of the concepts apply to all life and the reading is clear and succinct.
- Leave this chapter with a good understanding of terms like population, community, ecosystem, and biome.
- Also be clear on the interactions between organisms, particularly the concepts of mutualism and competition.
- Nutrient cycles, trophic levels, and community and ecosystem development are also well described and should be understood by the completion of this reading.
- Finally, read the following book chapter, located in Library Reserves: Chapter 55 from Biology by Campbell & Reece (8th edition), "Ecosystems." [193]
- You will read and learn in more detail about energy flow and efficiency, biogeochemical cycling, and primary production.
- Focus your attention on the section on terrestrial ecosystems and closely study the figure comparing evapotranspiration (ET) to net primary productivity (NPP).
- Continue your writing assignment for this lesson by responding to the following questions as you work through the Campbell reading.
- Does the ET v. NPP figure provide any insight into ecological processes at your study site? If so, what?
- What processes of decomposition and nutrient cycling are most evident at your site? Use the mean annual temperature (MAT) v. % litter mass lost figure in considering this final question.
- Note that we will return to the final section on "Dominance of Human Activities" in Lesson 12.
- Re-save your document and continue with this lesson.
Ecological Processes in the Critical Zone
The Earth's surface hosts a dynamic interplay of biotic and abiotic processes, all of which support the self-sustaining system that is the Critical Zone. The looming disaster associated with human activities and dominance of nature, however, threatens the balance of natural processes and challenges science to better understand the resilience of ecosystems and the CZ.
Activity
For this activity, I want you to complete the paper you have been working on for this lesson (see pages 3 and 5).
Directions
- To bring your newfound ecological knowledge fully to bear on Critical Zone issues, read the article entitled "Coupling between Biota and Earth Materials in the Critical Zone" by Ron Amundson and colleagues, which is available through Library Reserves.
- As you read, be sure to think about the issues related to separating a direct biotic role in chemical weathering from climatic effects because of the strong influence of climate on biota.
- Note the important role of plants in CZ processes: they pump essential elements and remove, temporarily store, and recycle them upon death; further, plants enhance weathering by altering CZ and river chemistry. Biota also mediates geomorphic processes by inhabiting, growing through and burrowing in soil, for example.
- Leave this reading with an understanding of the concepts of the biomantle, or soil conveyor belt, and burrowing as a mediator between soil erosion and soil thickness.
- Complete your writing assignment begun on page 3 and continued on page 5 with any thoughts derived from this reading, specifically considering the site-specificity of burrow mediation and the soil conveyor concepts. We will return to issues regarding biosphere resilience and Critical Zone research in Lesson 12.
- Re-save your paper.
Submitting your work
Upload your paper to the "Lesson 10 - Ecological Processes " dropbox in Canvas (see the Modules tab) by the due date indicated on our Canvas calendar.
Grading Criteria
You will be graded on the quality of your writing. You should not simply write responses to the questions and submit them to me. Instead plan on writing a short stand-alone paragraph (or page or whatever you decide is necessary considering any constraints I might have placed on you) so that anyone can read what you've written and understood it. You should strive to be specific and complete in responding to the questions. Your answers should be analytic, thoughtful and insightful, and should provide an insightful connection between ideas. The writing should be tight and crisp with varied sentence structure and a serious, professional tone.
Do Ecosystem Processes Have Value and Financial Worth?
Much of humanity tends to be oblivious to the role of nature in their lives. In North America, water comes from a faucet, food is gathered from stores, and toilets remove our waste. In less industrialized nations, much of the populace is too poor to concern themselves with natural ecological processes (though such processes may benefit their lives) as they deal more directly with poverty, hunger, and disease. But as the effect of humanity on nature has begun to deteriorate our lives and increase the need for engineering responses to our degradations, more scientists, planners, and citizens have begun to realize the value of a healthy, operational Critical Zone—various groups have gone as far as to estimate the financial value of such processes while others argue that such a move denigrates the natural world and attitudes toward it. You will read about this debate in the following activity.
Activity
Directions
- To learn about the debate regarding estimating the financial value of natural processes, read and discuss two important papers, one by Costanza et al. published in Global Environmental Change, and one by Gatto and De Leo published in BioScience.
- Costanza et al., 2014 [194], Changes in the global value of ecosystem services, Global Environmental Change, v. 26, 152-158.
- Gatto, M., and G. De Leo. (2000). Pricing Biodiversity and Ecosystem Services: The Never-Ending Story. BioScience, 50(4), 347–355. [Located in Library Reserves.]
Submitting your work
Upon completion of the reading, you are to engage in a discussion of the readings with the rest of the class. The class discussion will take place during the week of this lesson in a discussion forum in Canvas titled "Lesson 10 - Ecosystem Value Discussion."
- Enter the special discussion forum created; in Canvas (e.g., "Lesson 10 - Ecosystem Value Discussion").
- Use the following questions to guide your comments to the discussion noting that you do not need to address every question.
- Regarding the Costanza et al. paper . . .
- What are the merits of placing financial value on ecosystem services?
- Is the biome approach detailed enough to include all important Critical Zone processes? Have the authors missed any important processes?
- Is it reasonable to include cultural, specifically aesthetic and spiritual value in this assessment?
- Is it reasonable for less-developed nations with high global ecosystem value to expect a transfer of wealth from those of us who have wealth but low global ecosystem value?
- Use the map and table to estimate and describe the ecosystem value of your study site. Do you envision that this value is increasing or decreasing? What effect might global warming have on ecosystem value of your site? Should individual landowners be compensated for the value of an undeveloped site that provides high ecosystem service value?
- Regarding the Gatto and DeLeo paper . . .
- According to this paper, what are some of the problems associated with placing financial value on ecosystem services? Does their presentation have merit?
- Is it realistic or advisable to separate specific ecosystem services and value them, when in fact ecosystem services are an interrelated aggregate of services?
- Can a method be developed to ensure that organisms with a fundamental ecological function but low aesthetic appeal or recognition are properly valued?
- How can global interests be transferred to the local level?
- Regarding the Costanza et al. paper . . .
- Return to the discussion periodically to read your teammates postings and to respond by asking for clarification, asking a follow-up question, expanding on what has already been said, etc.
Grading criteria
You will be graded on the quality of your participation. See the grading rubric [47] for specifics on how this assignment will be graded.
Check this out...
To learn more about valuing ecosystem services, read the original Costanza et al. paper published in the elite journal Nature:
Costanza, R., d'Arge, R., de Groot, R., Farber, S., Grasso, M., Hannon, B., et al. (1997).The value of the world's ecosystem services and natural capital [195]. Nature, 387(6630), 253–260. doi: 10.1038/387253a0.
You may also find this Nature Comment by Costanza and Kubiszewski [196] equally provocative and interesting.
Most of humanity forgets that pollinators and trees and the sun work for free, providing some of the many ecosystem services that benefit us. Listen to Paul Sutton, a geography professor at University of Denver who has calculated a dollar price of these services, explain how he made the calculations on this June 2014 edition of Living on Earth.
Nature's Dividend: ”Pricing Global Ecosystem Services"
Living on Earth [197]
To learn about the concept of Critical Zone services, read the paper by Field et al. (2015) [198].
Summary and Final Tasks
This lesson briefly touched on the complexity of life on Earth and the interactions between organisms and their environment. It is important to recognize that the Critical Zone is so named because it is this thin veneer at Earth's surface that supports life on our planet—yet life also plays a complex and vital role in shaping and sustaining the zone. In the next lesson, we will study in more detail the complexities of various biomes and ecosystems and their role in CZ function. We will also evaluate the relationship between biomes and soils, and learn how to make site-specific determinations of landscape types.
Reminder—Complete all of the lesson tasks!
You have finished Lesson 10. Double-check the list of requirements on the Lesson 10 Overview page to make sure you have completed all of the activities listed there before beginning the next lesson.
Tell us about it!
If you have anything you'd like to comment on or add to, the lesson materials, feel free to share your thoughts with Tim. For example, what did you have the most trouble with in this lesson? Was there anything useful here that you'd like to try in your own classroom?
Unit 6, Lesson 11: BIOTA (2)
Lesson 11 Introduction
The last lesson began with an introduction to biodiversity, including soil biodiversity, and moved on to study the classification of life, based on evolutionary relatedness, nutritional mode, and trophic levels. We completed the lesson by thinking about the interactions between organisms (ecology) and the value of ecosystems to human society. In this lesson, we will focus on sets of ecosystems or biomes, their character, and their relationship to the rest of the Critical Zone. We will revisit key concepts and observations learned in earlier lessons on soil, climate, and landscapes. You will then learn to access land cover maps available through the USGS to determine the natural character and human land use of your site. Finally, we will consider the ecology of soils in some detail.
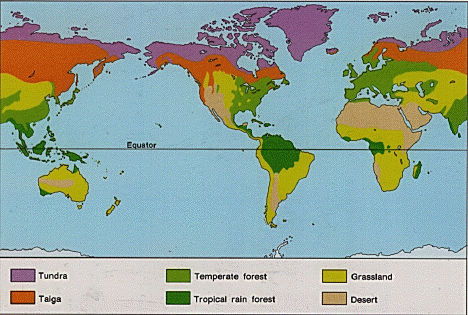
What will we learn about in Lesson 11?
- Global biome characterization
- Climate-biome relationship
- Climate-biome links to soil and the Critical Zone
- Land cover and land-use maps
- Soil biodiversity and ecology
Learning Objectives
By the end of this lesson you should be able to:
- Describe some of the most distinctive characteristics of each of the major global biomes
- Discuss the relationship between climate and biome distribution
- Consider the relationship between the climate-biome link and the rest of the Critical Zone
- Write about the relativity of the aforementioned objectives to your study site
- Understand simple concepts of soil macro and microbiotic organisms and their basic life processes
What is due for Lesson 11?
Lesson 11 will take us one week to complete. As you work your way through these online materials for Lesson 11, you will encounter additional reading assignments and hands-on exercises and activities. The chart below provides an overview of the requirements for Lesson 11. For assignment details, refer to the lesson page noted.
Please refer to the Calendar in Canvas for specific time frames and due dates.
| ACTIVITY | LOCATION | SUBMISSION INFORMATION |
|---|---|---|
| Report (3-page) on biotic links to the CZ, land cover, and soil ecology | page 3, 4, and 5 | Post to the Lesson 11 - Biomes dropbox in Canvas |
Questions?
If you have any questions, please post them to our Questions? discussion forum (not e-mail), located under the Discussions tab in Canvas. I will check that discussion forum daily to respond. While you are there, feel free to post your own responses if you, too, are able to help out a classmate.
Biome Character
One manner in which to consider the term biome is as a set of ecosystems with characteristic biota—the first-order effects of climate determine the location of biomes on Earth. The interrelationship between climatic and biotic processes with the landscape and parent material determines the flow of energy, water, and nutrients in the biome. Soil and Critical Zone processes can be distinctive to a biome, thus soil and Critical Zone character and function can be considerably different from one region of Earth to another.
Reading assignment
To learn more about biomes read:
- Chapter 30 in Raven, P. H., Evert, R. F., & Eichhorn, S. E. (1992). Biology of Plants (5th ed., pp. 657–85). W. H. Freeman.
You may also find that the following Flash animation from Teachers' Domain to be useful now and in your classroom:
- Biomes [200]
As you read this chapter, reconsider briefly the information on terrestrial ecosystems presented in the Lesson 10, page 5 reading assignment [201].
Once you dive into Raven et al., be sure to...
- View the global biome distribution map on pp. 658–9 and Figure 30-6 which displays the relationship between biomes and altitude (latitude)
- Understand that the rainforest biome is typified by few individuals of many species and the most complex interrelationships between species of all the biomes—be certain to read carefully about nutrient cycling, shallow-rooted trees, and soil infertility
- Consider . . .
- Why are annual plants better represented in deserts than the other biomes?
- How do winter soil temperatures in temperate deciduous forests affect the availability and movement of water to roots?
- Why have grasslands been agriculturally exploited across the globe?
- How are edaphic and biotic variation important in scrub biomes?
- Which biome covers 20% of Earth's land surface?
Climate-biome Link to the Critical Zone
In a previous soils lesson activity, you were asked to study and describe the relationship between soil distribution and latitude. Subsequently, in the climate lesson, you read about the distribution of different climates on Earth and the Koeppen climate classification system. Now I want you to briefly compare the relationship between biomes and climate using the Koeppen classification.
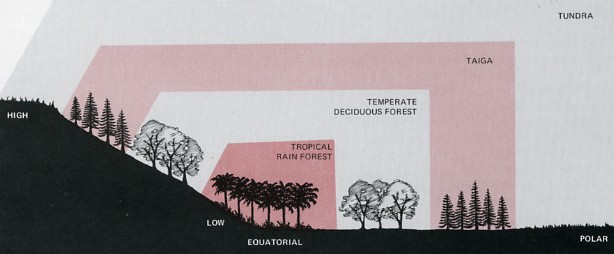
Activity
Directions
NOTE:
For this assignment, you will need to record your work on a word processing document. Your work must be submitted in Word (.doc) or PDF (.pdf) format so I can open it. In addition, documents must be double-spaced and typed in 12 point Times Roman font.
- Read about World Climates [52] at the Blue Planet Biomes Web site.
- First, notice that climate is divided into three climate zones: low, mid, and high latitude. Consider the relationship between climate and biomes—think globally and be creative.
- If you need to look at the global biome distribution maps from the Raven chapter on page 2 of this lesson [203], do so.
- Gradually focus your attention toward the distribution maps for North America shown in Chapter 52 of Biology (refer back to Lesson 10, page 5 [191]). You should notice some pretty clear relationships, but also some disparities.
- To what do you attribute the disparities?
- Does the geomorphologic character displayed in the very generalized landscape map of North America [204] provide answers?
- Compare your observations and conclusions to the global soil distribution map. Are there any general conclusions you can make?
- Once you have a clear sense for these global-scale relationships, focus on your study site.
- How do sweeping generalizations like those made above apply to your study site?
- Are the regional-scale observations you have made thus far through this course consistent with these generalizations?
- Consider using the BiomeViewer [205].
- Record your responses to questions posed in 4 and 5 above as the start of a three-page report that you will continue working on later in this lesson.
- Save your report as either a Microsoft Word or PDF file in the following format:
L11_biomes_AccessAccountID_LastName.doc (or .pdf).
For example, student Elvis Aaron Presley's file would be named "L11_biomes _eap1_presley.doc"—this naming convention is important, as it will help me make sure I match each submission up with the right student!
- Continue with this lesson.
Land Cover Maps
Land cover maps are available from the USGS—the maps characterize the natural environment as well as the land use. Depending on the year and other factors, twenty-one land-use categories have been applied to the United States.
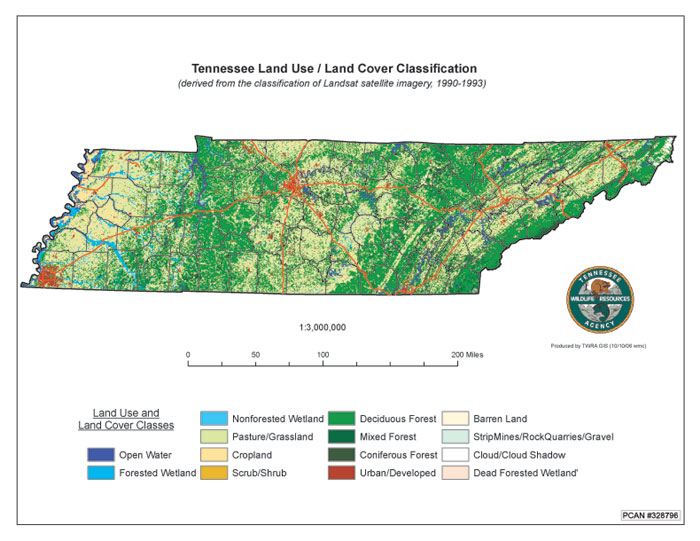
Activity
Directions
NOTE:
For this assignment, you will need to record your work on a word processing document. Your work must be submitted in Word (.doc) or PDF (.pdf) format so I can open it. In addition, documents must be double-spaced and typed in 12 point Times Roman font.
- To learn more about land cover maps, download the short information sheet available at the Multi-Resolution Land Characteristics (MRLC) Consortium Web site. [207]
- To access land cover maps of places you will visit, go to the National Map Web site [208] - be patient for the page to load.
- Look to the top of the page in the green bar, and choose the third icon from the left (Layer List), and then choose the National Land Cover Database (NLCD) - work through the drop-down menu here and choose NLCD 2001.
- Zoom in to your study site to determine the mapped land cover/land use—be sure to use the appropriate color key (legend) to study your site. (2001 legend [209]).
- Choose NLCD 2016, zoom into your study site, and compare to NLCD 2001. (2016 legend [210]).
- Continue the three-page report for this lesson by responding to the following questions:
- What can you learn regarding your study site?
- Is it consistent with what you have observed in other data sources studied this semester?
- Re-save your document and continue with this lesson.
Soil Ecology
Now that we've spent the better part of two lessons studying ecosystem and biome scale processes, I want you to focus especially on soil organisms, soil biodiversity, and the ecology of soils.
Activity
For this activity, I want you to complete the paper you have been working on for this lesson (see pages 3 and 4).
Directions
NOTE:
For this assignment, you will need to record your work on a word processing document. Your work must be submitted in Word (.doc) or PDF (.pdf) format so I can open it. In addition, documents must be double-spaced and typed in 12 point Times Roman font.
- Read the following chapter, located in Library Reserves:
- Brady, N. C., and Weil (2002). Organisms and Ecology of the Soil. In The Nature and Properties of Soils (13th ed., pp. 449–97). Upper Saddle River, N.J.: Prentice-Hall.
- As you read this chapter, finish the three-page report you've been working on for this lesson by answering these questions:
- What are the primary contributing factors to soil biodiversity? What about at your study site?
- Consider figure 11.1: can you use this as a template to fill in the details for your site?
- What role do earthworms fill in pedogenesis at your site? Ants? Microorganisms? Roots?
- Are there regional or site-specific natural conditions of organic matter content (soil moisture or temperature, for example) that most affect soil biodiversity at your site? How have land use and management practices affected the natural soil biodiversity of your study site?
- Re-save your paper.
Submitting your work
Upload your paper to the "Lesson 11 - Biomes" dropbox in Canvas (in the lesson under the Modules tab) by the due date indicated on our Canvas calendar.
Grading Criteria
You will be graded on the quality of your writing. You should not simply write responses to the questions and submit them to me. Instead plan on writing a short stand-alone paragraph (or page or whatever you decide is necessary considering any constraints I might have placed on you) so that anyone can read what you've written and understood it. You should strive to be specific and complete in responding to the questions. Your answers should be analytic, thoughtful and insightful, and should provide an insightful connection between ideas. The writing should be tight and crisp with varied sentence structure and a serious, professional tone.
Check this out . . .
The elite journal Science ran a special section entitled "Soils—The Final Frontier" in June 2004. We will read several articles from the special section in Lesson 12; the following three provide further insight and knowledge on the topic of soil ecology and soil biotic processes.
- Pennisi, E., 2004, The secret life of fungi, Science, 304, 1620–1622.
- Wardle, D., et al., 2004, Ecological linkages between aboveground and belowground biota, Science, 304, 1629–1633.
- Young, I., and Crawford, J., 2004, Interactions and self-organization in the soil-microbe complex, Science, 304, 1634–1637.
To learn about the effects of invasive earthworms on soils see Non-native invasive earthworms as agents of change in northern temperate forests [212].
Summary and Final Tasks
In this second lesson of the biota unit, you considered the complex interrelationship between climate and biota with the landscape and parent material that determine the flow of energy, water, and nutrients in biomes. You also learned that soil and Critical Zone processes can be distinctive to a biome or to a particular region of Earth. You looked at global-scale trends in these relationships and considered the various factors that may describe some of the disparities in these global-scale relationships. You also learned about the primary contributing factors to soil ecology and biodiversity and applied this knowledge to your study site. Finally, you learned where and how to access land cover maps.
Reminder—Complete all of the lesson tasks!
You have finished Lesson 11. Double-check the list of requirements on the Lesson 11 Overview page to make sure you have completed all of the activities listed there before beginning the next lesson.
Tell us about it!
If you have anything you'd like to comment on or add to, the lesson materials, feel free to share your thoughts with Tim. For example, what did you have the most trouble with in this lesson? Was there anything useful here that you'd like to try in your own classroom?
Unit 7, Lesson 12: Return to the Critical Zone
Lesson 12 Introduction
At this stage in your career, you should have encountered the term Earth system science, primarily used to describe the science (especially quantitative modeling) of the interactions between the atmosphere, hydrosphere and cryosphere, and biosphere. It should not require a huge leap in logic to see that the addition of lithosphere to that list provides all the components ("spheres") of the Critical Zone that we've studied this semester.
Check this out . . .
For a reminder and useful classroom video, see "Earth as a System [213]," a Quicktime video on the Teachers' Domain Web site.
Systems (in our case, the Critical Zone) consist of components (the "spheres"). The components are not isolated. Instead, they typically interact in complex ways; systems may also interact with other systems. These interactions, or linkages, are called couplings in Earth system science vocabulary. Positive couplings mean a change in one component, whether positive or negative, causes a change in the same direction in a linked component, whereas negative couplings mean the linked component undergoes change in the opposite direction. Feedback loops are circuits of change and response to change: negative feedback loops typically diminish the effects of change, whereas positive feedback loops usually amplify the change.
The state of a system is described using the characteristics of the system at a particular time. Changes to the state of a system are caused by (1) interactions between other systems and (2) interactions among the components within a system. An equilibrium state will not change unless the system is disturbed. Temporary disturbances to a system are called perturbations, whereas persistent disturbance is called forcing. When slight disturbances carry a system further from equilibrium it is said to be an unstable system.
Reading assignment
- Humanity now dominates the Earth and Critical Zone systems. Before you move on to the body of this lesson, return to your reading from Lesson 10, page 5 [193] (Campbell, Ch. 55) and review pages 1236–1242 to remind yourself how humans affect nutrient cycles, atmosphere, and precipitation chemistry, and the introduction of toxins. You may also want to study the two figures on p. 1243, since you are about to create your own qualitative Critical Zone system model.
- Read the short one-page statement about how human actions modify the physical environment [214], recognizing that our actions can be adaptive or excessive.
Lesson Overview
In this final lesson of the semester, you will be introduced to some of the basic concepts of system modeling. We will accomplish this through a series of readings and an activity. The readings will introduce you to the basics of system modeling and some of the specifics (including quantification) of human impacts to the biosphere, atmosphere, hydrosphere, lithosphere, and soil (i.e., the Critical Zone). Your final task for the semester will be to create a qualitative Critical Zone system model.
What will we learn about in Lesson 12?
- What is a system? What is the difference between quantitative and qualitative system modeling?
- How (and when) have humans altered global erosion rates?
- What are the consequences of human domination of ecosystems?
- How is human-induced climate change expected to alter the hydrologic cycle?
- What global-scale, human-induced changes can be observed in soils? What is the role of agriculture in these changes?
- What are some of the consequences of changes to our soils?
- Are there adaptive actions humanity can take to lessen negative impacts on the Critical Zone and soils?
What is due for Lesson 12?
Lesson 12 will take us one week to complete. As you work your way through these online materials for Lesson 12, you will encounter additional reading assignments and hands-on activities. The chart below provides an overview of the requirements for Lesson 12. For assignment details, refer to the lesson page noted.
Please refer to the Calendar in Canvas for specific time frames and due dates.
| ACTIVITY | LOCATION | SUBMISSION INFORMATION |
|---|---|---|
| Create qualitative Critical Zone system model | page 3 | Submit to the "Lesson 12 - CZ System Model" dropbox in Canvas |
Questions?
If you have any questions, please post them to our Questions? discussion forum (not e-mail), located under the Discussions tab in Canvas. I will check that discussion forum daily to respond. While you are there, feel free to post your own responses if you, too, are able to help out a classmate.
System Modeling
The goal of this final lesson is for you to create your own qualitative Critical Zone model, recognizing that the Critical Zone is a very complex system with human and natural components.
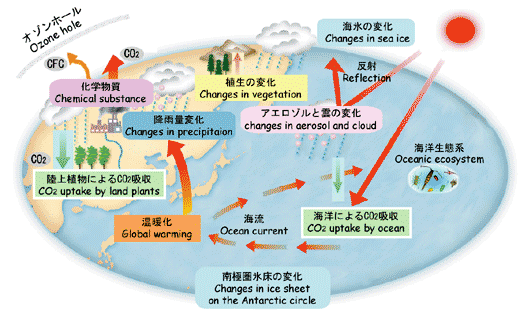
Activity
NOTE:
For this assignment, you may do your work by hand (e.g., pen/pencil and paper), in a word processing document, or using a drawing program of your choice. No matter what you choose, your work must be submitted in Word (.doc) or PDF (.pdf) format so I can open it.
- To solidify your concept of the Critical Zone as a system, please read the following article, located in Library Reserves.
- Brantley, S. L., Goldhaber, M. B., & Ragnarsdottir, K. V. (2007). Crossing disciplines and scales to understand the critical zone. Elements, 3(5), 307–14.
- While I outlined some of the most basic concepts of system modeling in the introduction to this lesson, more knowledge of approaches to system modeling is required to accomplish your model, so please read pages 1–19 in "System Behavior and System Modeling. [215]"
- As you read this, be aware that you will next read through a handful more documents describing some of the specifics of human influences to and alterations of the Critical Zone.
- Skip the preface and any mentions of the Stella II computer model. Also skip the exercises on pp. 6, 10, and 19, unless you feel you need the practice—but do not hand these in to me expecting a grade!
- Focus in on the text that describes: (1) the identification of system components and interactions of your system with other systems; (2) the identification of interactions between the components of your system; and, (3) qualitative and quantitative modeling.
- When you are ready to begin creating your model, work through the exercise described beginning on p. 2 of "System Behavior and System Modeling," using an outline format, adding arrows, labels, etc., as you progress deeper into your model. Feel free to work through their example for atmospheric carbon dioxide as a "thought" exercise if you choose, but the point of your effort should be to outline your own qualitative system definition of the Critical Zone.
- Continue through the exercise by building a conceptual model with a stylized drawing (p. 5). The drawing should include reservoirs, flows, valves, branches and interconnections where appropriate (p. 11).
- Extra credit: Can you plug numbers or equations into your conceptual model to create a quantitative model? If so, can you assess potential perturbations or forcings and the future effect of these on the global Critical Zone or Critical Zone at your study site?
- Scan or save your document as either a Microsoft Word or PDF file in the following format:
L12_cz_system_model_AccessAccountID_LastName.doc (or .pdf)
For example, student Elvis Aaron Presley's file would be named "L12_cz_system_model_AccessAccountID_LastName.doc"—this naming convention is important, as it will help me make sure I match each submission up with the right student!
Submitting your work
Upload your paper to the "Lesson 12 - CZ System Model" dropbox (in the lesson under the Modules tab) by the due date indicated on our Canvas calendar.
Grading Criteria
You will be graded on the quality of your writing. You should not simply write responses to the questions and submit them to me. Instead plan on writing a short stand-alone paragraph (or page or whatever you decide is necessary considering any constraints I might have placed on you) so that anyone can read what you've written and understood it. You should strive to be specific and complete in responding to the questions. Your answers should be analytic, thoughtful and insightful, and should provide an insightful connection between ideas. The writing should be tight and crisp with varied sentence structure and a serious, professional tone.
Check this out . . .
The activity entitled "Exploring environmental change [216]" provides an additional or optional mechanism for classroom introduction of the basic concepts of modeling an Earth system.
Human Impacts on the Critical Zone
Humanity's impact on the Critical Zone is immense and often mostly negative, in the sense that the characteristics of and processes in the zone are diminished by our actions. By now you should have a sense that there are consequences to these actions and that the current status of humanity's relationship to the Critical Zone is not sustainable.
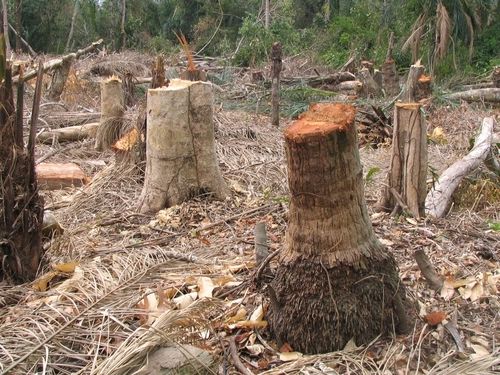
Reading assignment
To learn more about human interactions with the various components ("spheres") of the Critical Zone system, complete the following reading assignment. As you do so, be sure to search for information regarding the characteristics, processes, and couplings of each component that may help you build your qualitative Critical Zone system model.
Articles not directly linked are located in Library Reserves.
- Atmosphere and hydrosphere (climate and hydrology):
- Read the executive summary and browse the rest of this important report from the Intergovernmental Panel on Climate Change.
- Lithosphere and erosion:
- Wilkinson, B. H. (2005). Humans as geologic agents; a deep-time perspective. Geology (Boulder) em, 33(3), 161–4.
- Biosphere:
- Vitousek, P. M., Mooney, H. A., Lubchenco, J., & Melillo, J. M. (1997). Human domination of Earth's ecosystems. Science, 277(5325), 494–9.
Check this out . . .
To learn more about the basics of human population growth and effects on natural resources visit Population Education [219]. Pay particular attention to the "Environmental Connections" link and notice the teaching materials and tools, teacher services and workshops, and the free newsletter for teachers".
To consider an important view of tropical deforestation links to agriculture, food security and sustainability, see Iowa in the Amazon [220].
Human Impacts on Soil
Remember that your task in this lesson is to create a qualitative Critical Zone system model, not a soil system model. While soil lies at the "heart" of the CZ, the zone is more than soil—soil may be thought of as a component of the CZ system.
Reading assignment
Continue your readings of human interactions with the CZ by considering more specifically some of the effects we have on soil. Use this information to help build your CZ system model. (The articles below that are not directly linked are located in Library Reserves.)
- Richter, D. D. J. Humanity's Transformation of Earth's Soil: Pedology's New Frontier. Soil Science, 172(12), 957–67.
- Dan is a soil scientist at Duke and a member of the Critical Zone Exploration Network steering committee.
- Montgomery, D. R. (2007). Is agriculture eroding civilization's foundation? GSA Today, 17(10), 4–9. doi: 10.1130/GSAT01710A.1.
- Dave is a geomorphologist at the University of Washington. His book entitled "Dirt: The Erosion of Civilizations" is an excellent read if you have any interest in how past civilizations' abuse of soil resources led to their demise.
- Also see "Flood: Farming and Erosion" [221] (from Teachers' Domain) for a nice video discussion of the relationship between farming and erosion.
- In Lesson 11, you read some articles from a special section in a 2004 edition of the journal Science entitled "Soils—The Final Frontier." Read the remainder of the articles from the special section listed below.
- Sugden, A., Stone, R., & Ash, C. (2004). Ecology in the Underworld. Science, 304(5677), 1613–1615. See also the interactive version of the map from that article [222].
- Kaiser, J. (2004). Wounding Earth's Fragile Skin. Science, 304(5677), 1616–1618.
- Stokstad, E. (2004). Defrosting the Carbon Freezer of the North. Science, 304(5677), 1618–1620.
- Also, see the Teachers' Domain video entitled "Changing Arctic Landscape" [223] for a first-hand look at the effects of melting permafrost.
- McNeill, J. R., & Winiwarter, V. (2004). Breaking the Sod: Humankind, History, and Soil. Science, 304(5677), 1627–1629.
Considering Adaptive Actions in the Critical Zone
From the introduction to this lesson, remember that human actions can be adaptive or excessive—thus far, much of our activity has been excessive, but we have the capacity to adapt and to be sustainable.
Reading assignment
NOTE: The following readings are all available through Library Reserves.
- Read the following National Geographic article for a broad overview of excessive and adaptive actions by human society, including in the past. The article mentions activities leading to compaction, erosion, and loss of nutrients and organic matter, to name a few. Consider what human actions might be included in your Critical Zone system model.
- Mann, C. (2008). Our Good Earth. National Geographic, 214(3), 80–106.
- Continue your reading by considering the final article from the special "Soils—The Final Frontier" section from the journal Science. The article describes interactions between soil organic matter and atmospheric carbon dioxide and the global carbon cycle and explores human adaptive strategies that could increase soil organic matter content and fertility while also removing and storing carbon.
- Lal, R. (2004). Soil Carbon Sequestration Impacts on Global Climate Change and Food Security. Science, 304(5677), 1623–1627.
- Finally, read Jon Chorover's Elements article to learn about the role of soil biota and biogeochemical cycles in affecting the fate of contaminants in the Critical Zone. Jon is a soil scientist at the University of Arizona and is also a steering committee member for CZEN.
- Chorover, J., Kretzschmar, R., Garcia-Pichel, F., & Sparks, D. L. (2007). Soil biogeochemical processes within the critical zone. Elements, 3(5), 321–6.
Check it out . . .
Here are some additional resources that might be of interest:
- A National Geographic article entitled "Dirt Poor" follows the "Our Good Earth" article. Read this one for an example of the dire consequences of ignoring soil resources—in our own backyard!
- Bourne, J. (2008). Haiti Soil: Dirt Poor. National Geographic, 214(3), 108–11.
- View the video entitled "Organic Farming: Conserving Topsoil [224]" for an interesting look at one adaptive strategy.
Summary and Final Tasks
The Critical Zone is a complex system formed at the intersection of the lithosphere, biosphere, hydrosphere and atmosphere, and including soils. In this lesson, you've learned about system modeling and considered human impacts on the Critical Zone and soil and adaptive measures that society can take to sustain the Critical Zone and soil. You also attempted to qualitatively model the Critical Zone by considering the various processes within each component of the CZ and how they are linked to the other components.
Reminder—Complete all of the lesson tasks!
You have finished Lesson 12. Double-check the list of requirements on the Lesson 12 Overview page to make sure you have completed all of the activities listed there before beginning the next lesson.
Tell us about it!
If you have anything you'd like to comment on or add to, the lesson materials, feel free to share your thoughts with Tim. For example, what did you have the most trouble with in this lesson? Was there anything useful here that you'd like to try in your own classroom?
Links
[1] http://commons.wikimedia.org/wiki/Image:Mistassini_roadsign.jpg
[2] http://criticalzone.org/
[3] http://criticalzone.org/national/news/story/summary-video-about-the-us-czo-program/
[4] https://www.millenniumassessment.org/en/index.html
[5] https://www.ipcc.ch/report/ar5/
[6] http://books.nap.edu/openbook.php?record_id=9981&page=35
[7] http://www.czen.org/sites/default/files/CZEN_Booklet.pdf
[8] http://criticalzone.org
[9] http://www.czen.org/
[10] http://www.czen.org/sites/default/files/Sustaining-Earths-Critical-Zone_FINAL-290713.pdf
[11] http://www.nsf.gov
[12] http://www.nsf.gov/news/classroom/
[13] http://www.nasonline.org/about-nas/history/archives/milestones-in-NAS-history/organization-of-the-nrc.html
[14] https://www.myhaikuclass.com/arenick/sandiegovirtualfieldtrips1/cms_page/view/4096442
[15] https://www.e-education.psu.edu/earth530/sites/www.e-education.psu.edu.earth530/files/Earth530_Semester_Project_example.pdf
[16] https://www.e-education.psu.edu/earth530/sites/www.e-education.psu.edu.earth530/files/Earth_530_semesterproject__example2.pdf
[17] http://www.thefreedictionary.com/soil
[18] https://cordis.europa.eu/project/rcn/84933_en.html
[19] https://www.nal.usda.gov/topics/soil-resource-management
[20] http://soils.usda.gov/education/
[21] http://forces.si.edu/soils/
[22] https://www.bafu.admin.ch/bafu/en/home/topics/soil/publications-studies/publications/soil-a-precious-natural-resource.html
[23] http://www.earthscienceworld.org/images
[24] http://soilerosion.net/
[25] https://www.youtube.com/watch?v=YucUMhaIDww
[26] https://www.e-education.psu.edu/earth530/1647
[27] https://www.youtube.com/watch?v=mLVFevmwWWE
[28] https://www.e-education.psu.edu/earth530/1644
[29] https://www.youtube.com/watch?v=r8itOXeLm54
[30] https://www.e-education.psu.edu/earth530/1646
[31] https://www.youtube.com/watch?v=UnwS5QmR_AE
[32] https://www.e-education.psu.edu/earth530/1645
[33] http://www.globe.gov/do-globe/globe-teachers-guide/soil-pedosphere;jsessionid=4884A1A6CFBBA7F9275AA2A5EE53D9EC?p_p_id=globegovteacherguideportlet_WAR_globegovcmsportlet_INSTANCE_5esR&p_p_lifecycle=0&p_p_state=normal&p_p_mode=view&p_p_col_id=column-1&p_p_col_count=1&_globegovteacherguideportlet_WAR_globegovcmsportlet_INSTANCE_5esR_protocolCat=372023
[34] http://en.wikipedia.org/wiki/Soil_profile
[35] http://ufdc.ufl.edu/l/IR00003107/00001
[36] http://nesoil.com/properties/color/index.htm
[37] http://passel.unl.edu/pages/informationmodule.php?idinformationmodule=1130447039&topicorder=4&maxto=10
[38] http://en.wikipedia.org/wiki/Soil_survey
[39] http://www.nrcs.usda.gov/wps/portal/nrcs/site/national/home/
[40] http://websoilsurvey.nrcs.usda.gov/app/
[41] http://en.wikipedia.org/wiki/Soil_classification
[42] https://www.nrcs.usda.gov/wps/portal/nrcs/detail/soils/edu/?cid=nrcs142p2_053588
[43] https://nhptv.pbslearningmedia.org/resource/ess05.sci.ess.earthsys.soils/soils-around-the-world/#.WZOv64qQzBI
[44] http://www.ars.usda.gov/main/main.htm
[45] http://www.ars.usda.gov/Services/docs.htm?docid=1274
[46] http://www.enviroliteracy.org/article.php/244.html
[47] https://www.e-education.psu.edu/earth530/node/1650
[48] https://www.nasa.gov/goddard
[49] http://www.ipcc.ch/
[50] http://www.teachersdomain.org/resource/ess05.sci.ess.watcyc.oceancur/
[51] http://en.wikipedia.org/wiki/Climate
[52] http://www.blueplanetbiomes.org/climate.htm
[53] http://www.teachersdomain.org/resource/ess05.sci.ess.watcyc.convective/
[54] http://www.pbslearningmedia.org/resource/ipy07.sci.ess.watcyc.albedo/earths-albedo-and-global-warming/
[55] http://www.ncdc.noaa.gov/paleo/ctl/about1a.html
[56] https://www.nesdis.noaa.gov/content/peeling-back-layers-atmosphere
[57] http://www.climatechange2013.org/images/uploads/WGIAR5_WGI-12Doc2b_FinalDraft_Chapter01.pdf
[58] https://www.ipcc.ch/report/sr15/glossary/
[59] http://en.wikipedia.org/wiki/Atmospheric_chemistry
[60] https://climate.ncsu.edu/edu/home
[61] https://www.metoffice.gov.uk/
[62] http://en.wikipedia.org/wiki/Primary_production
[63] http://www.pbslearningmedia.org/resource/b1943ed9-9781-4d75-872f-ee5b26fe28a6/the-roots-of-the-carbon-cycle/
[64] http://www.epa.gov/climatechange/science/causes.html
[65] https://19january2017snapshot.epa.gov/climate-change-science/causes-climate-change_.html
[66] https://grimstad.uia.no/puls/climatechange2/nng01/07nng01.htm
[67] http://www.epa.gov/climatechange/policy/
[68] https://19january2017snapshot.epa.gov/climatechange/evaluating-climate-policy-options-costs-and-benefits_.html
[69] https://toolkit.climate.gov/
[70] http://www.epa.gov/climatechange/emissions/ind_calculator.html
[71] http://www.carbonfootprint.com/calculator.aspx
[72] http://greenfootstep.org/
[73] http://www.footprintnetwork.org/en/index.php/GFN/
[74] http://www.livescience.com/4180-sahara-desert-lush-populated.html
[75] http://en.wikipedia.org/wiki/Svalbard
[76] http://www.pbslearningmedia.org/resource/tdc02.sci.life.cell.stetteroxygen/life-before-oxygen/
[77] http://www.ncdc.noaa.gov/paleo/paleo.html
[78] http://www.epa.gov/climatechange/science/pastcc.html
[79] https://climate.nasa.gov/evidence/
[80] http://www.epa.gov/climatechange/science/recentcc.html
[81] https://19january2017snapshot.epa.gov/climate-research_.html
[82] http://www.pbslearningmedia.org/resource/ess05.sci.ess.earthsys.esglaciers/earth-system-ice-and-global-warming/
[83] https://e-education.psu.edu/earth530/node/1649
[84] http://www.teachersdomain.org/resource/ess05.sci.ess.earthsys.glaciers/
[85] http://www.pbslearningmedia.org/resource/ipy07.sci.ess.earthsys.glacierphoto/documenting-glacial-change/
[86] http://www.teachersdomain.org/resources/ipy07/sci/ess/earthsys/glacierphoto/index.html
[87] http://www.dcnr.pa.gov/Geology/GeologyOfPA/GlacialGeology/Pages/default.aspx
[88] http://en.wikipedia.org/wiki/Laterite
[89] http://books.nap.edu/openbook.php?record_id=10136&page=19
[90] http://www.epa.gov/climatechange/science/futurecc.html
[91] https://19january2017snapshot.epa.gov/climate-change-science/future-climate-change_.html
[92] http://gisclimatechange.ucar.edu/inspector
[93] https://www.ipcc.ch/site/assets/uploads/2018/02/WG1AR5_Chapter11_FINAL.pdf
[94] http://www.explainingclimatechange.ca
[95] https://www.ncdc.noaa.gov/monitoring-references/maps/us-climate-regions.php
[96] http://www.grida.no/climate/ipcc/regional/174.htm
[97] http://cpo.noaa.gov/Meet-the-Divisions/Earth-System-Science-and-Modeling/MAPP/High-Resolution-Regional-Climate-Modeling
[98] https://www.c2es.org/document/regional-impacts-of-climate-change-four-case-studies-in-the-united-states/
[99] https://www.ucsusa.org/resources/confronting-climate-change-us-northeast
[100] https://www.e-education.psu.edu/earth530/sites/www.e-education.psu.edu.earth530/files/file/onlineDiscussionRubric.pdf
[101] http://elements.geoscienceworld.org/cgi/reprint/3/5/333
[102] http://www.teachersdomain.org/resource/ess05.sci.ess.watcyc.lifeessential/
[103] https://water.usgs.gov/edu/watercycle.html
[104] http://en.wikipedia.org/wiki/Precipitation_(meteorology)#Ways_of_precipitation
[105] http://en.wikipedia.org/wiki/Atmospheric_circulation
[106] https://www.quora.com/Why-are-deserts-dry
[107] http://en.wikipedia.org/wiki/Monsoon
[108] http://en.wikipedia.org/wiki/Cryosphere
[109] http://earthobservatory.nasa.gov/Features/Water/
[110] http://www.epa.gov/safewater/kids/flash/flash_watercycle.html
[111] http://www.epa.gov/safewater/kids/
[112] http://www.teachersdomain.org/resource/ess05.sci.ess.watcyc.lp_watercycle/
[113] https://www.nsf.gov/news/news_summ.jsp?cntn_id=191016
[114] http://wikiwatershed.org/
[115] http://pubs.usgs.gov/wsp/wsp2254/
[116] http://en.wikipedia.org/wiki/Water_resources
[117] http://extension.usu.edu/waterquality/
[118] https://waterdata.usgs.gov/nwis
[119] http://water.usgs.gov/osw/streamstats/
[120] https://www.pbslearningmedia.org/resource/watsol.sci.ess.water.amdren/acid-mine-drainage-remediation/
[121] https://www.pbslearningmedia.org/resource/btl10.ela.early.itsaph/its-a-p-h/
[122] https://toxics.usgs.gov/
[123] https://climate.nasa.gov/quizzes/soilmoisture-quiz/
[124] http://www.waterencyclopedia.com/Ge-Hy/Groundwater.html
[125] http://water.usgs.gov/ogw/basics.html
[126] http://en.wikipedia.org/wiki/Aquifers
[127] https://water.usgs.gov/edu/earthgwdecline.html
[128] http://water.usgs.gov/education.html
[129] http://www.whymap.org
[130] http://waterdata.usgs.gov/nwis/gw
[131] http://www.earth4567.com
[132] http://www.dcnr.state.pa.us/topogeo/classroom/index.aspx
[133] http://Geology.com/articles/what-is-geology.shtml
[134] http://en.wikipedia.org/wiki/Geology
[135] http://Geology.about.com/
[136] https://www.uwsp.edu/Pages/default.aspx
[137] http://www.classzone.com/books/earth_science/terc/content/investigations/es0602/es0602page01.cfm
[138] http://en.wikipedia.org/wiki/Plate_tectonics
[139] https://visibleearth.nasa.gov/
[140] http://visibleearth.nasa.gov/view_cat.php?categoryID=1402
[141] http://pubs.usgs.gov/gip/geotime/
[142] http://pubs.usgs.gov/gip/geotime/time.html
[143] http://www.indiana.edu/%7Egeol105b/1425chap6.htm
[144] http://serc.carleton.edu/research_on_learning/synthesis/time.html
[145] http://en.wikipedia.org/wiki/Biogeomorphology
[146] http://www.teachersdomain.org/resource/ess05.sci.ess.earthsys.erosion/
[147] http://en.wikipedia.org/wiki/Weathering
[148] http://en.wikipedia.org/wiki/Erosion
[149] http://en.wikipedia.org/wiki/Deposition_%28sediment%29
[150] http://ngmdb.usgs.gov
[151] http://en.wikipedia.org/wiki/Isostasy
[152] http://en.wikipedia.org/wiki/Geomorphology
[153] http://en.wikipedia.org/wiki/Fluvial
[154] https://ntrs.nasa.gov/archive/nasa/casi.ntrs.nasa.gov/19870008706.pdf
[155] http://www.physicalgeography.net/fundamentals/10z.html
[156] http://www.physicalgeography.net/fundamentals/10ah.html
[157] http://www.dtic.mil/cgi-bin/GetTRDoc?AD=ADA244855&Location=U2&doc=GetTRDoc.pdf
[158] http://www.earthonlinemedia.com/ebooks/tpe_3e/glacial_systems/outline.html
[159] http://www.revisionworld.co.uk/a2-us-grades-11-12/geography/glacial-environments/glacial-processes-landforms
[160] https://editors.eol.org/eoearth/wiki/Periglacial_processes_and_landforms
[161] https://en.wikipedia.org/wiki/Glaciers_on_Mars
[162] http://www.elcamino.edu/faculty/mreed/physical/101%20Powerpoint/glaciers.ppt
[163] http://www.thecanadianencyclopedia.ca/en/article/karst-landform/
[164] http://www4.uwsp.edu/geo/faculty/lemke/geomorphology/lectures/07_karst.html
[165] http://www.teachersdomain.org/ext/ess05_int_caveintro/index.htm
[166] http://www.pbslearningmedia.org/resource/ess05.sci.ess.earthsys.caveintro/caves-and-karst/
[167] http://www.tulane.edu/%7Egeol113/COASTAL-PROCESSES-1a.htm
[168] http://geobytesgcse.blogspot.com/2007/08/coastal-erosion-landforms-features-and.html
[169] http://www.physicalgeography.net/fundamentals/10ac.html
[170] http://www.physicalgeography.net/fundamentals/10ac_2.html
[171] http://www.scribd.com/doc/305249/Coastal-Erosion-Processes-and-Landforms
[172] http://priede.bf.lu.lv/GIS/.Descriptions/RST/Sect17/nicktutor_17-4.shtml
[173] http://geoinfo.amu.edu.pl/wpk/rst/rst/Sect17/Sect17_5.html
[174] http://eros.usgs.gov/
[175] http://landsatlook.usgs.gov/
[176] http://fermi.jhuapl.edu/states/states.html
[177] http://www.flashearth.com/
[178] http://www.ssec.wisc.edu/sose/pirs_activity.html
[179] https://www.pasda.psu.edu/
[180] http://www.terraserver.com/
[181] http://www.nasa.gov/audience/foreducators/topnav/materials/listbytype/Blue_Marble_Matches.html
[182] http://en.wikipedia.org/wiki/Soil_biodiversity
[183] http://en.wikipedia.org/wiki/Cretaceous%E2%80%93Tertiary_extinction_event
[184] https://editors.eol.org/eoearth/wiki/Biodiversity_(main)
[185] https://www.tuhsd.org/
[186] http://en.wikibooks.org/wiki/General_Biology/Classification_of_Living_Things/Classification_and_Domains_of_Life
[187] http://www.diffen.com/difference/Autotroph_vs_Heterotroph
[188] http://en.wikipedia.org/wiki/Trophic_level
[189] http://soilweb200.landfood.ubc.ca/soil-biology/soil-organisms/
[190] http://krupp.wcc.hawaii.edu/BIOL200/powerpnt/pdffiles/classification.pdf
[191] https://www.e-education.psu.edu/earth530/sites/www.e-education.psu.edu.earth530/files/file/Campbell_ch52.pdf
[192] https://www.e-education.psu.edu/earth530/sites/www.e-education.psu.edu.earth530/files/file/readings/Bio_of_plants_cp29.pdf
[193] https://www.e-education.psu.edu/earth530/sites/www.e-education.psu.edu.earth530/files/file/Campbell_ch55.pdf
[194] https://78462f86-a-512471e5-s-sites.googlegroups.com/a/idakub.com/www/CV/publications/2014_Costanza_GlobalValueUpdate.pdf?attachauth=ANoY7cou1-4uiW7cINrfJeUffVtUQiqsYEkZB56AasPSIGzU1bz88fb7y9CV8Zs5LALppP62pbowvYRjAx1g5DKFkg4nNWf411u69cFlUo4EOG3jQIjWtjNthlQlnBKuMXHBDKU4A-Cjoon1iPdcGBp9oj1hj1pxs6aHbCe8hcL-fVjmwUON6DWH4JXeHTGebLV5LfX0ymLXX3cT89tYEyZ0mo6A6jrlXNA_n0n_yy1k3oBNdBo-CIUjhc8eMnGwOPdfaM5FLhVw&attredirects=0
[195] http://www.nature.com/nature/journal/v387/n6630/pdf/387253a0.pdf
[196] http://staging.community-wealth.org/sites/clone.community-wealth.org/files/downloads/article-costanza.pdf
[197] http://www.loe.org/shows/segments.html?programID=14-P13-00025&segmentID=4
[198] https://dl.sciencesocieties.org/publications/vzj/abstracts/14/1/vzj2014.10.0142
[199] http://oncampus.richmond.edu/academics/education/projects/webunits/biomes/biomes.html
[200] http://www.teachersdomain.org/resource/ess05.sci.ess.watcyc.biomemap/
[201] https://www.e-education.psu.edu/earth530/node/1601
[202] https://www.biology-pages.info/B/Biomes.html
[203] https://www.e-education.psu.edu/earth530/content/l11_p2.html
[204] http://www.eduplace.com/kids/socsci/books/applications/imaps/maps/g2_u2/index.html
[205] http://www.hhmi.org/biointeractive/biomeviewer
[206] http://www.state.tn.us/twra/gis/maps/tnlc.pdf
[207] http://pubs.usgs.gov/fs/2012/3020/
[208] http://viewer.nationalmap.gov/viewer/
[209] https://www.mrlc.gov/data/legends/national-land-cover-database-2001-nlcd2001-legend
[210] https://www.mrlc.gov/data/legends/national-land-cover-database-2016-nlcd2016-legend
[211] http://en.wikipedia.org/wiki/Earthworm
[212] https://esajournals.onlinelibrary.wiley.com/doi/abs/10.1890/1540-9295%282004%29002%5B0427%3ANIEAAO%5D2.0.CO%3B2
[213] http://www.teachersdomain.org/resource/ess05.sci.ess.earthsys.hologlobe/
[214] https://www.nationalgeographic.org/standards/national-geography-standards/14/
[215] https://www.ucar.edu/search?q=system+behavior+and+system+modeling
[216] http://www.teachersdomain.org/resource/echo07.sci.life.coast.lpenvironment/
[217] http://www.worldproutassembly.org/archives/2006/04/the_causes_of_t.html
[218] https://www.ipcc.ch/report/ar5/wg2/freshwater-resources/
[219] http://www.populationeducation.org
[220] http://www.nytimes.com/2013/11/25/opinion/iowa-in-the-amazon.html?pagewanted=all&_r=0
[221] http://www.teachersdomain.org/resource/ess05.sci.ess.earthsys.flooderosion/
[222] http://www.sciencemag.org/cgi/content/full/304/5677/1616/DC1
[223] http://www.teachersdomain.org/resource/ipy07.sci.ess.earthsys.arcticland/
[224] http://www.teachersdomain.org/resource/ess05.sci.ess.earthsys.organic/