Unit 3, Lesson 5: Climate (3)
Lesson 5 Introduction
Lesson Overview
The atmosphere is a complex portion of the Earth system that greatly influences Critical Zone processes. It should be clear to you now that a wide range of climate states have existed in Earth history that fall outside of the realm of human experience. Further, you now know that these climates of the past—paleoclimates—provide us with great insight into present-day atmospheric processes and that paleoclimatic variations led to changes in Critical Zone processes of the past.
In Lessons 3 and 4, you studied modern and ancient atmospheric processes at a planetary scale. In Lesson 5 you will further explore predictive modeling of future climate change and what our best scientists and computer models predict will happen to atmospheric carbon dioxide levels, temperature and precipitation, storms, and sea level in Earth's not-too-distant future
Watch these Videos!
To better understand some of the very basic general concepts of climate modeling, I will take advantage of the nearby presence of my colleague Dave Pollard, an internationally known paleoclimate modeler and co-author of the GENESIS global climate model (GCM). Dave's depth and breadth of knowledge of computer codes, GCMs and paleoclimate will be obvious as you watch the series of videos we created and will help you to better understand and digest the readings I have assigned in this lesson.
Video: Part 1: Meet Dave Pollard (02:50)
See Transcript: Meet Dave Pollard
TIM WHITE: Hello. Welcome to my office. Perhaps now when you're communicating with me you can imagine this is where I operate from. But we're really here today because a colleague and neighbor of mine, Dave Pollard, is a paleoclimatologic modeler, and so we're going to go over to Dave's office and have a little conversation with him.
Hey Dave.
DAVID POLLARD: Hi, Tim.
TIM: How you doing?
DAVID: Fine.
TIM: You have a couple minutes to have a chat?
DAVID: Sure. Come on in.
TIM: Thanks. So when did you start climate modeling?
DAVID: I first started the simple climate modeling in grad school. I did a simple couple glacier ice sheet model of the Pleistocene ice ages. And that's when it started.
TIM: And then your post doc?
DAVID: I did a post doc in Oregon State, and I worked on-- for the first time there-- on global climate models. The big, complex, global models that Larry Gates used then. Applied to the quaternary ice ages. I later worked for NCAR, which is in Boulder, Colorado. It stands for the National Center for Atmospheric Research. They do a lot of different things there. The division I worked in was called climate and global dynamics, which mainly developed community climate global climate model that people use a lot in the United States and internationally for paleoclimate and modern and future climate modeling.
TIM: And I suppose it was at that time you created or coded Genesis?
DAVID: While I was there, my group decided to develop a global climate model specifically aimed at the paleoclimate modeling community, and so we built GCM, which stands for Global Climate Model, or General Circulation Model, and we called it Genesis. And that was in the 1980s and 1990s, and quite a lot of paleoclimate modelers used it at that time. In the late 1990s, I moved to Penn State. There was a dynamic group here led by Eric Baron at the time doing a lot of paleoclimate modeling work, and I joined that. And since then, I've worked here on Genesis climate model and also a lot on ice sheet modeling, which maybe we'll talk about a little later.
Video: Part 2: Modelling Climates (05:25)
See Transcript: Modeling Climates
TIM WHITE: You've used the term climate modeling quite a bit in describing yourself, so maybe this is a good time to tell us-- from your perspective, what is climate modeling?
DAVID POLLARD, Sr. Research Associate, Earth and Environmental Systems Institute: Well, climate modeling, and in particular global climate models, are really large computer codes. They're quite like the codes that are used for weather forecasting by the National Weather Services. But they're simplified a little bit so that they can be run instead of over a few days where you're interested in really getting the weather right tomorrow in the next four or five days so that you can run them over 10 years if you like or 100 years to get a projection of the average climate. They still have all the storms and the weather events in them simplified a little bit so they're efficient enough to run for those long-time scales.
And the other thing that's different about them is that they have a lot of other components. They're coupled to other things that interact with the weather over that time scale like snow. The thickness of snow, the temperature and amount of moisture in the soil, oceans, the effect of vegetation. That sort of thing.
How Do Climate Models Work?
Some things you have to just prescribe from observations, but then a lot of it is in the physics of the equations themselves. The things you prescribe are the amounts of sunlight coming in at the top of the atmosphere, which is determined from the current orbit the seasonal cycle of the Earth around the sun. The amount of carbon dioxide and other gases in the atmosphere. The types of vegetation that distributed around the globe.
That sort of thing. And then, when you run the model, just about everything else that you can think of to do with the weather is predicted from the equations. Air speeds, temperatures, humidities, they're all in the physics.
Climate Models and Soil
TIM: Do soils play a role in the models?
DAVID: Yes. For global climate modeling, you generally have a model of the top few meters of soil, which includes most of the critical zone. Not ground water, but the upper soil layers, which includes the seasonal cycle of temperature going down to about a meter. And what these models predict in the physics is the soil temperature and the soil moisture. The amounts of water in the pores.
TIM: And what about surface water like lakes or rivers? Are they in the model?
DAVID: Usually not explicitly. You don't predict river flow, for instance. You're not going to get the speed of the Mississippi current, but what is predicted is the local runoff averaged over soil areas. And then what you can do from that is deduce the average river output integrated over the whole Mississippi basin, for instance. And lakes are just prescribed, usually.
TIM: What about ice?
DAVID: Well, there's the seasonal snow pack coming and going, how it melts in the spring and then forms in the fall and winter, is predicted from the amounts of snowfall falling from the atmosphere. And sea ice is also predicted, which is of interest recently, because of the rapidly receding cover in the Arctic, for instance. That's included in these climate models when they apply it to the future.
But the big ice sheets, like Greenland and Antarctica today, they're prescribed. Those time scales of the variations of thousands to tens of thousands of years and these global climate models can only be run realistically, with computer power that we have for decades or a few hundred years at most at a time. So you have to prescribe these long-term features like ice sheets.
Computer Power & Coupled Modelling
Coupled modeling, which I do quite a bit, where you use tricks, really, to run these global climate models only for a few decades and then couple them to separate models of the ice sheets where you can try and then run just the ice sheet model over thousands, ten thousands, or even millions of years to predict their variations in the past.
Video: Part 3: Modelling Modern & Ancient Climates (06:00)
See Transcript: Modelling Modern & Ancient Climates
TIM WHITE: You've told us a lot about climate modeling in general, and you've alluded to some of your work in paleoclimate modeling. And I wondered if you could perhaps tell us a little bit more about some of the differences between modeling ancient climates and modern climate.
DAVE POLLARD, Sr. Research Associate, Earth and Environmental Systems Institute: Sure. You actually use the same physical model, which is a good thing. You want to use exactly the same physics in the model, be it just the general circulation model, as works for the present. And just shift that and apply that to the past. But to do that, the main thing you have to do is to change the boundary conditions.
Then that means the layouts of the components as they varied very much, if you go far back, due to plate tectonics. The amounts of carbon dioxide in the atmosphere, which could be four times, eight times, or more if you go back to the Cretaceous, say, 100 million years ago. Then if you're interested in orbits, and Milankovitch orbital perturbations over the ice ages, for instance, you set different orbital parameters. The eccentricity, the precession, and obliquity of the Earth around the Sun.
So there's a handful of those things, about four or five changes to the external boundary conditions, that you impose on the GCM. And then you simply run it, just like you would for the present, except you're simulating the climate 100 million years ago, say.
How are Ancient Climate Models Relevant Today?
So do these paleoclimate simulations have any relevance to the future and to society's concerns? And I think the answer's definitely yes. We're about to enter, in the next few centuries to millennia, unprecedented increases in greenhouse gases, which are going to warm the climate tremendously.
Now, we can attempt to just model that with models based on the present day, but if we can go back in the past to when greenhouse gases were the same levels as we anticipate, two to three to four times what they are today, that gives us an analogy. And just a means of testing the models to see if they're doing the right job for the past. And then we'll have more confidence for them in the future.
For instance, the last time that greenhouse gases were three to four times present-day amounts was in the-- before about 40 million years ago. 100 million to 40 million years ago. And we can simulate those conditions and compare with paleoclimate data that we have for those periods and see if the models are doing a reasonable job.
Another example concerns parts of the present-day ice sheets, for instance, West Antarctica and also Greenland. And it's quite hard to model those. But we've coupled ice sheet and climate models to see if they are vulnerable if they're in danger of totally disintegrating, for instance, in the case of West Antarctica, in the next 1,000 years due to increases in ocean and air temperatures caused by humans. But we can look in the past to see if those parts of the ice sheets have collapsed or not. And when they have, what were the climates that caused that, and try to simulate those with our coupled models.
Another great thing about these models is helping to communicate to the public what's really going to happen. The three-dimensionality of them means that you can make nice graphics and animation, and also run them forward in time to produce movies. And that sort of visual has a big impact and potency for the public to really see what might happen.
For instance, we can run these ice sheet models and watch the ice sheets coming and going over tens of thousands of years and through ice age cycles. And also how they might recede in the future. And so that's a great way of communicating to the public much better than dry tables and thousands of just figures that you might think.
TIM: Well, this is great. Let's have a look at some examples of your work.
DAVE: OK.
Modeling the Ice Sheets
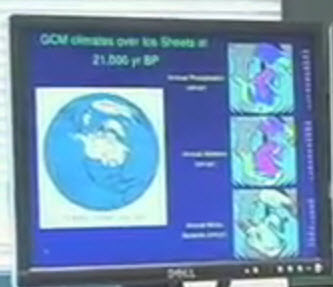
This shows work I've done coupling global climate models with ice sheet models. And this particular experiment was aimed at the last glacial maximum, 21,000 years ago-- really recently, geologic time, when ice sheets covered a lot of the known hemispheric continents, almost all of Canada, with kilometers thick ice sheets. And it's a real mystery why they came and why they went away again over very short geologic time periods.
And the purpose of this experiment was just to see if the global climate model could produce reasonable snowfall and snow melt patterns over these ice sheets. And that's what you need to do if you think about the long term evolution of them, because what is the net annual input of mass onto the surface versus the melt? That controls whether they recede or advance. So I use the global climate model with these boundary conditions to produce maps of snowfall, snow melt, and the net balance.
TIM: We've actually discussed this episode in the class. And during this time, part of Pennsylvania was covered with ice. But I'm curious, were you able to adequately model the ice sheet?
DAVE: Yes. These amounts of snowfall and snow melt are quite reasonable from what we can deduce about what they should be at the last glacial maximum, which is actually since the ice sheets were at their maximum, they weren't rapidly receding or growing. The net input of mass should be close to zero. And that's how it works out in these simulations.
But the atmosphere and climate system are more complex than we've considered thus far. Perhaps you gained some insight into this concept when considering the ancient climate-relevant deposits and the relationship between greenhouse paleosol and modern oxisol distributions. Therefore, we will consider, in more detail, the differences in climate between regions, specifically looking at predictions of regional climate change in the United States. You will think and write about how these predictions may affect the Critical Zone within a region.
Finally, we will close Lesson 5, and Unit 3, with some readings that link Earth's atmosphere to soil and provide predictions of changes in soil that we may expect as a result of climate change.
What will we learn about in Lesson 5?
- Regional climate change in the United States
- Links between the atmosphere and soil
- Predictions of changes to soil associated with climate change
- Future climate change
- Predictive models
- Atmospheric carbon dioxide content
- Temperature and precipitation
- Storminess
- Sea level
- Predictive models
What is due for Lesson 5?
Lesson 5 will take us one week to complete. As you work your way through these online materials for Lesson 5, you will encounter additional reading assignments and hands-on exercises and activities. The chart below provides an overview of the requirements for Lesson 5. For assignment details, refer to the lesson page noted.
Please refer to the Calendar in Canvas for specific time frames and due dates.
| ACTIVITY | LOCATION | SUBMISSION INFORMATION |
|---|---|---|
| Discussions on regional climate issues | page 3 | Participate in the Lesson 5 - Regional Climate team and class discussion forums in Canvas |
| Short (2-page) paper on links to the Critical Zone | page 4 | Post to the Lesson 5 - Links to the Critical Zone dropbox in Canvas |
| Discussion - Teaching and Learning About Atmosphere and Climate | page 5 | Participate in the Unit 3 - Teaching and Learning About Atmosphere and Climate discussion forum in Canvas |
Questions?
If you have any questions, please post them to our Questions? discussion forum (not e-mail), located under the Discussions tab in Canvas. I will check that discussion forum daily to respond. While you are there, feel free to post your own responses if you, too, are able to help out a classmate.
Future Climate Change Predictions and Model Evaluation
Future climate change projections are based on our understanding of the atmosphere, ocean, and climate system as it is mathematically represented in powerful computer models of the globe that reconstruct physical and chemical processes. These models are tested by their ability to accurately represent modern climate conditions and by using paleoclimate proxy data to "ground truth" model output for past climate conditions. In this manner, scientists can determine whether or not models accurately reconstruct the full range of climate extremes that can occur in Earth's climate system.
Many models have been applied to determine Earth's near-future climate. The results of these modeling efforts can then be applied to anticipating changes in Critical Zone processes, many of which are extremely relevant to the health of human society and all life on our planet.
Reading assignment
To learn more about future climate change predictions, please read the "Future Climate Change [1]" section of the United States EPA Web site (but instead go here [2]).
Also, visit the Climate Inspector [3] page in the U.S. Climate Resilience Toolkit to view future climate simulations from one of the leading global climate models.
Want to learn more?
(Optional) Read Chapter 11, Near-term Climate Change: Projections and Predictability [4], in Climate Change 2013: The Physical Science Basis, IPCC.
- Do not worry about the details.
- Read the Executive Summary.
- Browse the figures, noting the range in predictions dependent upon the model being considered; I find Figure 9.14 to be particularly enlightening.
- The General Summary and Figure 9.31 also provide good overviews.
Struggling to teach climate change in your 9-12 classroom?
Check out: Visualizing and Understanding the Science of Climate Change [5]
Regional Climate Issues
To learn more about regional climate issues, complete the following learning activity.
See our course calendar in Canvas for specific activity due dates.
Activity
Directions
- To get started, read the following Web sites. Feel free to browse any of the links you find interesting. Your goal should be to gain a basic understanding of the term "regional climate" from a climate scientist's perspective.
- Regional Climate in the U.S. [6]
- Regional Impacts of Climate Change in North America [7] (Read the Executive Summary)
- Regional Climate Models [8]
- With your newfound understanding of regional climate, you will now proceed to read two important reports, one by the Pew Center on Global Climate Change and the other by the Union of Concerned Scientists (UCS), that discusses potential climate-change-related impacts on specific regions within the United States.
- Regional Impacts of climate change: Four Case Studies in the United States [9] (Pew Center on Global Climate Change)
- Confronting Climate Change in the U.S. Northeast [10] (Union of Concerned Scientists)
NOTE:
You don't have to read the entire reports . . . we are going to do this part of the activity in five (5) teams. Team membership will be provided by the start of this lesson week.
Here is how each team should proceed with the readings:
- Members of every team should read the Introduction to the Pew report (pages 1-7) and Chapter 1 in the UCS report (pages 1–9).
- Members of individual teams should then read the following:
- Team 1: pp. 10–29 in the UCS report describing regional climate change in the Northeast
- Team 2: pp. 8–21 in the Pew report on the Midwest
- Team 3: pp. 22–41 in the Pew report on the West
- Team 4: pp. 42–56 in the Pew report on the Gulf Coast
- Team 5: pp. 57–67 in the Pew report on the Chesapeake Bay
Submitting your work
Upon completion of the reading, you are to engage in a discussion of the readings, first within your team and then with the rest of the class. The team discussion component of this activity will take place over two days and will require you to participate multiple times over that period. Likewise, the class discussion will then take place over the subsequent two days. See our course calendar in Canvas for specific dates.
Team discussions
- Enter the special discussion forum created for your team in Canvas (e.g., "Lesson 5 - Regional Climate: Team 1 Discussion")
- You will see five postings already there, each containing one of the following questions:
- What regional effects to the Critical Zone are described in your region?
- Are there any regional characteristics that make your region more susceptible or resilient to climate change?
- What role does the Critical Zone play in climate change in your region?
- Are there any actions that can be taken to mitigate the regional effects?
- How might reductions in our nation’s greenhouse gas emissions lessen the regional effects, if at all?
- Respond to one question that hasn't already been chosen by another student. If all questions have already been addressed, then select a question where you can further the discussion and post there.
- Return to the discussion periodically to read your teammates postings and to respond by asking for clarification, asking a follow-up question, expanding on what has already been said, etc.
Class discussion
Once you have discussed these topics within your team, we will regroup to engage in a discussion with the entire class. This class discussion will take place in a separate discussion forum in Canvas titled "Lesson 5 - Regional Climate: Class Discussion."
- Before joining the class discussion, skim the discussions that have taken place in ALL of the team discussion spaces in order to acquaint yourself with the other topics and issues.
- Next, enter the "Regional Climate - Class Discussion" forum and post a response to each of the following questions. Remember, if there are already postings there from other students, then respond by asking for clarification, asking a follow-up question, expanding on what has already been said, etc.
- What will the net effect of climate change be on the nation’s Critical Zone?
- Consider the previous list of questions from a carbon trading perspective. Imagine that a national cap on total carbon dioxide emissions has been established, but that consideration can be made for the total carbon budget of your region. That is, your region can be classified based on its carbon sources and sinks—if your region is designated as a net carbon sink, then your region can emit more carbon dioxide than a region that is identified as a source of carbon dioxide—or you trade or sell carbon credits to a region that is a net carbon source. Do you think your region is a net source or sink? How did you come to this conclusion? How will your region’s carbon budget be affected by climate change? Will the actions of other regions positively or negatively affect the carbon budget in your region? The Critical Zone?
Grading criteria
You will be graded on the quality of your participation. See the grading rubric [11] for specifics on how this assignment will be graded.
Links to the Critical Zone
As we progress through the semester, you will learn that all of the various "spheres" that overlap in the Critical Zone, and all of the state factors of soil formation, are complexly interrelated—it is difficult to tease out the effects of a single factor or "sphere," on the Critical Zone. Nonetheless, it is worthwhile to assess aspects of Critical Zone science associated with a single "sphere," if for no other reason than we can draw on the accumulated knowledge of various scientific sub-disciplines that have focused on an individual "sphere." More importantly, though, is the fact that my brain best understands and learns simple concepts, so we will more closely consider the effects of a single variable, the atmosphere, on the Critical Zone to complete this lesson.
Activity
NOTE:
For this assignment, you will need to record your work on a word processing document. Your work must be submitted in Word (.doc) or PDF (.pdf) format so I can open it. In addition, documents must be double-spaced and typed in 12 point Times Roman font.
Directions
- Before we consider atmospheric effects on soils and predictions of changes to soils associated with climate change, please re-read pages 19–20 from Brantley et al. (2006). These pages will remind you of the complex interactions between the biosphere, lithosphere, hydrosphere, and atmosphere before you focus on atmospheric effects.
- Brantley, S., White, T., White, A., Sparks, D., Richter, D., Pregitzer, K., et al. (2006). Frontiers in exploration of the Critical Zone [12]. In Frontiers in exploration of the Critical Zone: Report of a workshop sponsored by the National Science Foundation (NSF). (pp. 1–30). Newark, DE. Retrieved 16 June 2008.
- Next, read Derry, L. A., & O. A. Chadwick. (2007). Contributions from Earth's Atmosphere to Soil. [13] ELEMENTS, 3(5): 333–38. (This article is available online through Library Reserves.)
As you learn about aerosol inputs to soils, particularly on isolated ocean islands where strong atmospheric fluxes can be contrasted to bedrock (parent material) signatures, note that Lou and Oliver are both steering committee members for the Critical Zone Exploration Network.
As you read the article, consider whether or not the soils you studied in your Web Soil Survey activity may have significant atmospheric inputs. (You will be asked to submit your answers to these questions below.)- Are the inputs natural or anthropogenic?
- Do the inputs provide vital components to the soil or do they degrade the soil?
- In either case, what would happen if the inputs were increased or decreased?
- Continue reading the two short articles from Soils on a Warmer Earth. I want you to leave these readings with the general sense that many soil scientists expect soils to be altered, in some cases drastically, because of climate change, and that the soil changes are expected to vary regionally. Most of these changes entail variations in soil moisture and temperature, but higher leaching and erosion rates are expected under conditions of elevated rainfall, whereas increased salinization is expected in regions susceptible to drier climate. Also, note that some soils are considered to be more "resilient" than others.
- Brinkman, R. (1990). Resilience against climate change? Soil minerals, transformations and surface properties, Eh, pH. In H. W. Scharpenseel & M. Shoemaker (Eds.), Soils on a Warmer Earth (pp. 51–60). Elsevier Publishing Company.
- Szabolcs, I. (1990). Impact of climate change on soil attributes: Influence on salinization and alkalinization. In H. W. Scharpenseel & M. Shoemaker (Eds.), Soils on a Warmer Earth (pp. 61–69). Elsevier Publishing Company.
- Complete this activity by considering the following questions with respect to your Web Soil Survey results. (You will be asked to submit your answers to these questions below.)
- What changes do you expect in your study soil as Earth's climate warms?
- How might these changes cascade through the hydrosphere and biosphere?
- Will they be beneficial?
- Are there any management strategies worth considering now before the changes occur?
- Combine your responses to the questions in steps 2 and 4 into a single paper that is no more than two double-spaced pages in length.
- Save your work as either a Microsoft Word or PDF file in the following format:
L5_links_AccessAccountID_LastName.doc (or .pdf).
For example, student Elvis Aaron Presley's file would be named "L5_links_eap1_presley.doc"—this naming convention is important, as it will help me make sure I match each submission up with the right student!
Submitting your work
Submit your work to the Lesson 5 - Links to the Critical Zone dropbox in Canvas by the due date indicated on our Canvas calendar. (See the Modules tab in Canvas)
Grading criteria
You will be graded on the quality of your writing. You should not simply write responses to the questions and submit them to me. Instead plan on writing a short stand-alone paragraph (or page or whatever you decide is necessary considering any constraints I might have placed on you) so that anyone can read what you've written and understood it. You should strive to be specific and complete in responding to the questions. Your answers should be analytic, thoughtful and insightful, and should provide an insightful connection between ideas. The writing should be tight and crisp with varied sentence structure and a serious, professional tone.
Teaching and Learning About Atmosphere and Climate
Let's take some time to reflect on what we've covered in this unit!
Activity
Directions
For this activity, I want you to consider how you might adapt the materials of this unit to your own classroom. Since this is a discussion activity, you will need to enter the discussion forum more than once in order to read and respond to others' postings.
Submitting your work
- Enter the "Teaching and Learning About Atmosphere and Climate" discussion forum in Canvas.
- Post your ideas for how the materials we covered in this unit might be adapted for your own classroom.
- Read postings by other EARTH 530 students.
- Respond to at least one other posting by asking for clarification, asking a follow-up question, expanding on what has already been said, etc.
Grading criteria
You will be graded on the quality of your participation. See the grading rubric [14] for specifics on how this assignment will be graded.
Summary and Final Tasks
This has been a long unit with a lot of reading and writing. By now though you should have a strong basic understanding of atmospheric processes and the full range of climate change that can occur on Earth, on both the global and regional level. You should also understand the overwhelming scientific information indicating that climate change is being driven by anthropogenic causes, that this change is occurring very rapidly, and that the change will affect the Critical Zone and soil resources. All is not lost however—the scientific community has begun to discuss various management strategies to deal with potential degradation of the Critical Zone. Whether you realize it nor not, you can apply this newfound knowledge to modify your own behaviors and help to develop strategies that will allow society to survive and perhaps thrive under warmer Earth conditions—perhaps your students will learn from you and do the same.
In the next unit we will focus on the hydrologic cycle, and surface and ground water resources, which are all intimately tied to the atmospheric processes you have just studied and mastered.
Reminder—Complete all of the lesson tasks!
You have finished Lesson 5. Double-check the list of requirements on the Lesson 5 Overview page to make sure you have completed all of the activities listed there before beginning the next lesson.
Tell us about it!
If you have anything you'd like to comment on or add to, the lesson materials, feel free to share your thoughts with Tim. For example, what did you have the most trouble with in this lesson? Was there anything useful here that you'd like to try in your own classroom?