Plate Motion and Activity 1
Let's do something with Plate Tectonics and ask how fast plates move relative to one another? The answer can be found by using plate rotation vectors. Stick with me for a minute or two. This looks more complicated at first blush than it really is. For our purposes, we just need the ability to plug numbers into an equation --so we need to follow the parameter definitions and the equation.
Want to learn more?
See "Simple Euler Poles [1]."
The motion of a point on one tectonic plate relative to another plate can be described by the relative velocity vector v. The velocity v has magnitude and direction and is given by the cross product of the angular velocity vector ω and the plate rotation vector r . The equation looks like this, where the "x" means cross-product. The reason we can't just use distance=rate*time is because we are describing the motion on the surface of a sphere as opposed to making the assumption that it's all flat and distances are simply linear.
v = ω x r
For example, according to one of the accepted models for plate motion (NUVEL 1), the velocity of the North American Plate relative to the Pacific Plate is given by the rotation pole at: 48.7° N 78.2° W and angular velocity 7.8x10⁻⁷ degrees/year (that is: 0.00000078 deg/year.) Therefore, a point on the Pacific plate near Parkfield California, which is at 35.9° N 120.5° W, is moving at 47.6 mm/yr relative to the rest of North America. How long will it take for this point to reach the present location of San Francisco?
How does this calculation work? Download this pdf file for the details [2]. That file contains some useful background. The last page is the example above.
NOTE: Parkfield CA is the site of a National Science Foundation project called EarthScope [3] that has drilled into the San Andreas Fault. See SAFOD Observatory [4] for more details on the drilling project.
One of the first sketches to show tectonic plates
Note the three types of plate boundaries (compare to the figure on the previous page) and the definitions of lithosphere, asthenosphere, and mesosphere. Lithosphere means the rigid part and thus the bottom of it is defined by an isotherm (do you know why?). The base of the lithosphere is typically taken as 1300° C. Note that the plate thickens as it moves away from a divergent spreading center. Mid-ocean ridge systems are hot (they are volcanoes!) and thus ridges are relatively buoyant, which means that they have relatively higher elevation than regions around them. Ocean depth increases systematically with distance away from mid-ocean ridge systems. We'll look at this more closely in Activity 3.
Note in the sketch below that the Earth and its plates are portrayed as a block instead of a sphere. If you think spherical geometry is difficult to work with, you are right. It's hard to visualize in your head and not so easy to sketch, either.
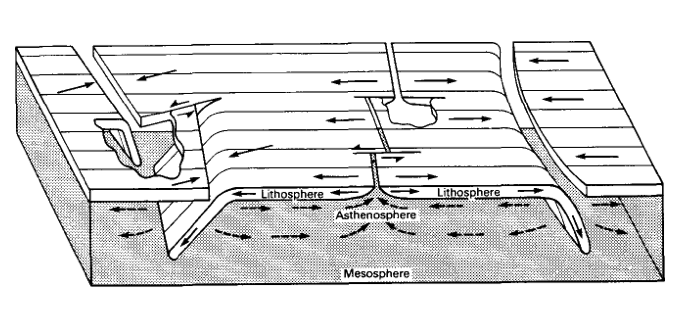
Plate motion vectors
You can always use vector algebra to calculate linear velocity v from the position vector r and the angular velocity vector ω, but there's an easier way to get the magnitude of the velocity by using the solid angle between the pole of rotation and the location of interest (see below). The solid angle can be obtained using spherical trigonometry:
cos a = cos b cos c + sin b sin c cos A
where a is the solid angle of interest, b is the co-latitude of the location on Earth's surface, c is the co-latitude of the plate rotation pole and A is the surface angle between the pole and the location (that is: A is the difference between the longitude of the pole and the longitude of the location).
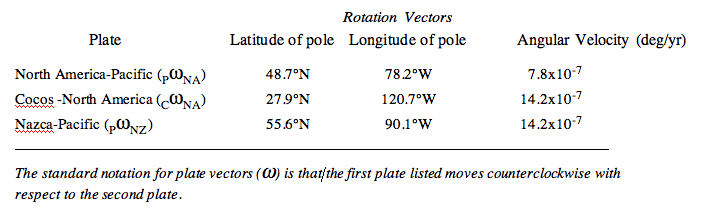
Plate Motion Vectors
Credit:Prissy.US
Click for text description of the plate motion vectors table.
Text Description of Rotation Vectors Table
| Plate | Latitude of pole | Longitude of pole | Angular Velocity (deg/yr) |
|---|---|---|---|
| North America-Pacific (PNA) | 48.7°N | 78.2°W | 7.8x10⁻⁷ |
| Cocos-North America (CNA) | 27.9°N | 120.7°W | 14.2x10⁻⁷ |
| Nazca-Pacific (PNZ) | 55.6°N | 90.1°W | 14.2x10⁻⁷ |
The standard notation for plate vectors () is that/ the first plate listed moves counterclockwise with respect to the second plate.
Some background on Spherical Trigonometry
To work with plate motion vectors, and to calculate the linear velocity of points on Earth's surface, we need to know the distances between various points on the globe. A useful analogy is that of linear and angular velocities associated with Earth's daily rotation. That is, the angular velocity is the same everywhere on Earth. All points rotate through 360° (2 pi radians) in 24 hours. But the linear velocity, on Earth's surface, depends on where you are relative to the rotation axis. If you're at the North Pole, then you cover only a small distance, whereas if you're at the equator, then you cover a distance equal to Earth's full circumference in 24 hours (2 pi R). As Earth rotates each day, the linear velocity of points at the Equator is much larger than points near the poles. The same type of thing happens with plate motions. Points that are close to the pole of rotation move with lower linear velocity than points that are farther from the pole. So, we need to calculate the distance between each point and the pole. These next two figures will help show how this works. Remember, for our purposes, we just need to be able to plug numbers into an equation, so we need to follow the parameter definitions and the equation.
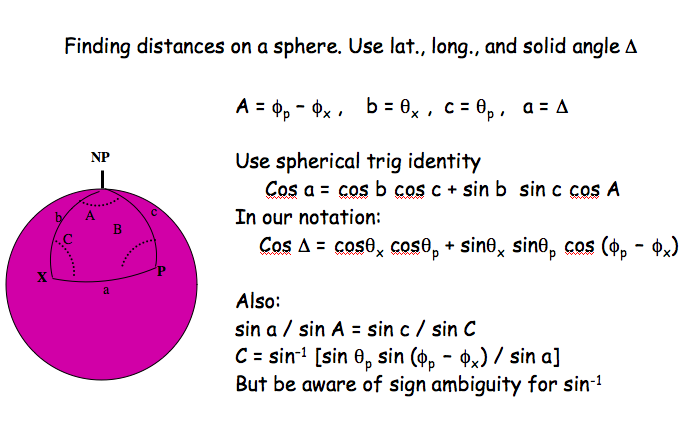
Click for text description of the spherical trigonometry image.
Use spherical trig identity
In our notation:
Also:
But be aware of sign ambiguity for sin-1
In the diagram above, upper case letters refer to surface angles and lower case letters refer to solid angles, measured between lines that extend from the Earth's center to the surface. For a point X at, say, latitude 20° N, the angle b is 70°, because b is measured from the north pole along a line of longitude. In the calculation, it's standard to use the 'co-latitude' b and c. Note that it's easy to get b and c, based on their latitudes. But the same is not true for the solid angle a. That's why we need spherical trig. Surface angles are perhaps more familiar. They are obtained from latitude and are therefore nothing more than a larger-scale version of the angle between the first-base line and the third-base line on a baseball diamond.
Here's an example that will help to fix ideas. Do you follow? If not, please post a question on Canvas.
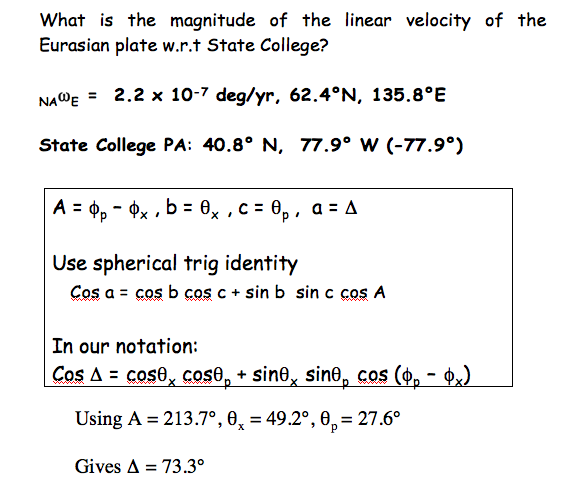
Click for text description of the spherical trigonometry example image.
What is the magnitude of the linear velocity of the Eurasian plate w.r.t State College?
State College PA: 40.8°N, 77.9°W (-77.9°)
Use spherical trig identity
In our notation:
Check: Can you verify 73.3 deg. for this example? If not, make sure you're using co-latitude and that your answer is in degrees. Still having trouble? Then have a look at this [5].
Magnitude of linear plate velocity
Once you have the angular distance between the points (Δ), you can get the linear velocity using v = ω R sin Δ. See the last page of this pdf file for a worked example [6].
Activity 1
NOTE: For this assignment, you will need to record your work on a word processing document. Your work is best submitted in Word (.doc), or PDF (.pdf) format so I can open it.
Directions
- Find an analog for Earth's internal structure and measure the relative thicknesses of the layers. Here is an image that goes along with mine (a major league baseball), see details of my numbers on the previous page:
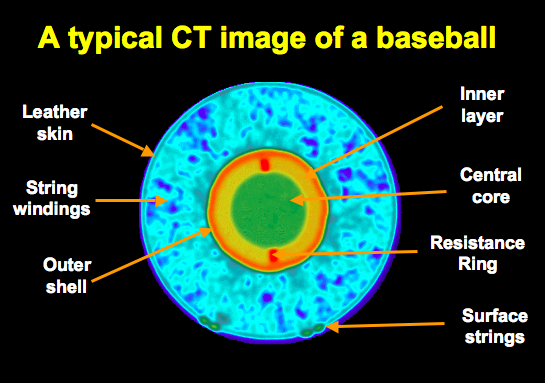 A typical CT image of a baseball
(Are you a fan? Here's a short set of ppt images showing how baseballs have changed over the years.) [7] - Using the formula given on the previous page, calculate Earth's radius at your location. Here's how: look up the latitude of where you are, and then plug-and-chug. This is the relevant equation, so you don't have to go back and find it again: in which Re is the equatorial radius=6378.14 km and lambda is your latitude, and f is the Earth's ellipticity: can be written: where Rp is polar radius=6356.75 km.
- Now, we're ready for a real problem. Calculate the rate of motion between the Pacific Plate and the North American Plate at Hollywood, CA. (I worked the example of the Golden Gate Bridge for you.) I expect that you will show enough of your work so that I can follow how you did the calculation. At the least, you should list all of the parameters and factors used in your calculation. Even better is to paste in your calculation from Google or elsewhere, as in this example: http://www3.geosc.psu.edu/~cjm38/540/sphericaltrigExample.html [5]
- 37.8 N 122.5 W (the golden gate bridge) [8]
- 34.1° N 118.3° W (Hollywood, CA)
- Check both sites using the plate motion calculator [9] at the UNAVCO Web site.
NOTE: To start, you can enter just the latitude and longitude of the point of interest and hit submit. You'll get an answer, with default parameters. Hmm, does it work to just copy/paste in the numbers above? What happens if you write 122.5 W vs. -122.5? Can you include the ° symbols?
For our example problem, you should set the Reference to "PA Pacific" when doing the Golden Gate case, and "North America" when doing Hollywood (what happens if you choose Pacific for the Hollywood case?). You can also try NNR (no net rotation). Play around with this a bit. It's useful!
Under "Model" select "All of the above" so that you can see the range of predictions. Tell me your thoughts on why there are differences in the predicted rates of motions. What happens if you use a different frame of reference?
- Go to the UNAVCO Web site [10] and determine a plate motion rate using their GPS data for the Mission Viejo, CA station. Do two things: calculate a linear velocity like we did in #3, having read the latitude and longitude of this station on its web page. Then use the plots of GPS data to calculate an approximate linear velocity using the Pythagorean theorem, as in north2 + east2 = total2. The link will take you to the UNAVCO page for Mission Viejo, CA (SBCC). (Note: The folks at UNAVCO sometimes modify their web page. If you have trouble finding the data, use this file [11]).
- You have now calculated plate motion at three different places on the North American plate with respect to the Pacific plate using spherical trigonometry. You have compared those calculations to two other methods (using UNAVCO's calculator and using properties of right triangles). Discuss in a few sentences the similarities/differences between the different calculated values and whether you think the differences are due to rounding errors, geographic location, other assumptions, and so forth. If you wanted to make an estimate the quickest way, which method would you use? If you wanted the most accuracy, which would you choose?
- Save your document as either a Microsoft Word or PDF file in the following format:
L2_activity1_AccessAccountID_LastName.doc (or .pdf).
For example, student Elvis Aaron Presley's file would be named "L2_activity1_eap1_presley.pdf"—this naming convention is important, as it will help me make sure I match each submission up with the right student!
Submitting your work
Upload your paper to the "Lesson 2 - Activity 1" dropbox in Canvas by the due date indicated on our Course Schedule.
Grading criteria
See the grading rubric [12] for specifics on how this assignment will be graded.