Lesson 4
Lesson 4 Introduction
The Global Thermostat. The Ocean-Atmosphere-Climate Connection
About Lesson 4
In this lesson, we have the ambitious task of tackling the heat distribution on Earth and it's role in dictating ocean circulation, atmospheric circulation, and Earth's climate.
By the end of this lesson you should have a deeper understanding of the role of the oceans and atmosphere in heat transfer on Earth, the structure of the oceans including surface water and deep water, thermo-haline circulation including patterns and the factors that drive flow, the Coriolis effect and Ekman transport, large-scale atmospheric circulation, oceanic gyres, and boundary currents in the ocean basins.
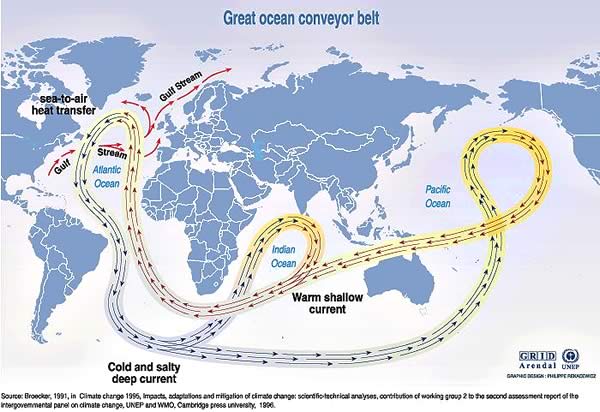
This figure incorporates many of the topics we will cover in Lesson 4. Note the Gulf stream in the North Atlantic and the sea-to-air heat transfer associated with it. Also note the three dimensional nature of ocean current flow (the conveyor), which includes warm surface currents and deep currents.
What will we learn in Lesson 4?
By the end of Lesson 4, you should be able to:
- Describe the solar energy budget for Earth including variations with latitude of energy input and output.
- Explain how heat is transferred from low to high latitudes by the oceans and the atmosphere.
- Explain the roles of latent heat and sensible heat in energy transfer by ocean currents.
- Describe the pattern of global winds and its relationship to heat transfer.
- Describe the primary structure of ocean waters as a function of depth, including the changes in average temperature and salinity.
- Explain the main factors that determine surface and deep ocean currents.
- Explain the Coriolis effect, it's origin, and it's influence on global winds and ocean currents
- Describe how the Coriolis effect and Ekman transport influence ocean surface currents
- Describe the 'ocean conveyor' and it's role in global heat transfer and climate regulation
- Use on-line resources to construct maps of ocean temperature and salinity
What is due for Lesson 4?
The chart below provides an overview of the requirements for Lesson 4. For assignment details, refer to the lesson page noted. See the Course Schedule (located in the Resources menu) for assignment due dates.
| REQUIREMENT | LOCATION | SUBMITTED FOR GRADING? |
|---|---|---|
| Activity 1: Pressure Belts | page 1 | Yes |
| Activity 2: Ocean Currents and Density | page 4 | Yes |
| Activity 3: Gyres and Surface Currents | page 5 | Yes |
Questions?
Post them to our Questions? discussion forum on Canvas or get in touch by email.
Overview, Solar Energy, Pressure, & Wind Belts
The connections between atmospheric circulation, ocean currents and Earth's climate are both simple and wonderfully complex. We could easily spend the whole semester studying these topics and developing the background for ocean circulation, but we won't. Instead, we'll hit the high points and build a background for understanding ocean currents and thermo-haline circulation. It makes sense to start with atmospheric circulation because ocean surface currents are driven by wind. The basic pattern of surface ocean circulation, including the large-scale gyres, is caused by wind and the factors that produce large-scale wind patterns. We need to start by seeing how solar energy input on Earth and poleward transport of heat by winds sets up large-scale atmospheric cells that produce Easterly and Westerly winds in three main bands from the equator to the poles. The Coriolis effect, produced by Earth's rotation and conservation of momentum, plays an important role here. Ocean structure also plays an important role and we need to look at density driven circulation in the ocean as produced by temperature and salinity: so-called thermohaline circulation. Ocean circulation is three-dimensional and both surface currents and deep water currents play an important role in heat transport. Large-scale ocean currents are impacted by the Coriolis effect, and depth-variations in coupling between surface flow and wind stress produce another important effect, known as Ekman transport, which we will discuss. Ultimately, when we put all the pieces together, the goal is to arrive at a coherent picture of how solar energy, winds, and ocean circulation combine to produce a global thermostat for Earth.
It's all about Blowing Hot Air
This image shows large-scale atmospheric circulation on Earth. Note the three-dimensionality of the circulation. On the right-hand side of the image the arrows show vertical and horizontal air flow as part of six convection cells, three in each of the Northern and Southern hemispheres. The central part of the image shows surface winds blowing from the east (the Trade winds) or the west (The Westerlies) --note that the Polar Easterlies are not easily seen in this image.

Hadley circulation
One of the most important things to understand from this image is that everything is driven by unequal solar heating as a function of latitude. The energy from our Sun is focused on the equatorial region and spread comparatively thinly over the polar regions. This is true on an average annual basis, Earth receives more solar energy at the equator than at the poles. As a result, the land, water, and air, over the equator are warm, and air rises over the equator. This warm air rises through the atmosphere and flows poleward as an upper atmosphere wind that is, essentially, an air-mail package of heat known as a Hadley Cell. The image here has arrows showing circulation in a vertical plane along a line of longitude (just to the east of the African continent) but, of course, this circulation occurs at all longitudes. Hadley circulation is 3D; heat moves poleward in upper atmosphere winds and there is a return flow from north to south (in the Northern hemisphere) that sets up the Northeasterly Trade winds (with the help of the Coriolis effect, as we'll see below).
Pressure belts
The Hadley Cell is set up by rising air over the equator. It begins with warming of air surrounding the equator, which creates a large region of lower surface pressures (due in part to the fact that columns of warm air weigh less than columns of cold air). This belt of equatorial low pressure causes air to be drawn together in a region called the Intertropical Convergence Zone (ITCZ). The convergence of warm, moist air over the equator transports large volumes of air aloft, to the top of the troposphere. This air is confined vertically by the base of the stratosphere and thus spreads out north and south toward the poles.
Because of Earth's spherical shape, the poleward-flowing air is compressed into an increasingly smaller volume as it moves away from the equatorial region. The airmasses also cool as they move poleward. The buildup of cool air aloft causes surface pressures to rise because surface pressure depends on the weight of the entire atmospheric column. The mass convergence and cooling also cause air mass densification, which forces some of the air aloft to sink. At some point, normally ~ 30 deg. North/South, the increase in surface pressures reaches a maximum, marking a belt of subtropical high pressure. Sinking air is dry and characterized by a lack of clouds and precipitation. These regions of subtropical high pressure systems are known for their tranquil weather. Air masses flowing equatorward from these high pressure belts form the Trade Winds that feed the ITCZ, thus completing the Hadley Cell circulation. Similar thinking explains the existence and wind circulation in the Ferrel Cell (labeled the 'mid-latitude' cell in this image) and the Polar Cell.
Activity 1: Pressure Belts
Let's think about the global pattern of atmospheric pressure. Hadley circulation implies a systematic pattern of pressure variation as a function of latitute. One question we could ask involves differences in air masses within a Hadley cell. Referring to the figure above: how do air masses differ between the ascending limbs of a Hadley Cell, over the equator, compared to the descending limb at 30 deg. North?
- Atmospheric Pressure [1] Start by skimming this page. Look at Figures 7d-1 and 7d-4 and read the associated text. (Note: The animation for 7d-4 may open in a separate Quicktime window or be downloaded to your desktop)
- Using these data, let's calculate the average density for air at 30 deg. North compared to that at the equator. You can assume that the atmosphere extends to the 70 km, which is within the Mesosphere. A useful formula for the relationship between pressure, p, density, ρ, gravity, g, and height, h, is: p = ρ g h
- Let's assume that the average air pressure over the equator at Earth's surface is roughly 101.3 kPa (recall: 1 Pa = 1 Newton per square-meter). Does this jive with what you see in figure 7d-4? In this case, what is the average density of air if the column is 70 km tall?
- Now calculate the density at 30 deg. north, assuming an average surface pressure of 102.5 kPa.
- Comment on how air pressure varies as a function of time throughout the year (hint, look at the animation on the web page that you just read).
- Thinking back to what you know about heat capacity and latent heat, do these differences in density make sense relative to your expectations for heat transfer by large-scale winds? Is the air at 30 deg. north likely to be colder/warmer/denser compared to that at the equator?
Submitting your work
Save your document as either a Microsoft Word or PDF file in the following format:
L4_Activity1_AccessAccountID_LastName.doc (or .pages or .pdf)
For example, student Elvis Aaron Presley's file would be named "L4_Activity1_eap1_presley.doc".
Put the file in the DropBox under Lesson 4 on Canvas.
Grading Criteria
See the grading rubric [2] for specifics on how this assignment will be graded.
Redistributing Earth's Heat, Wind, & Currents
Heat redistribution
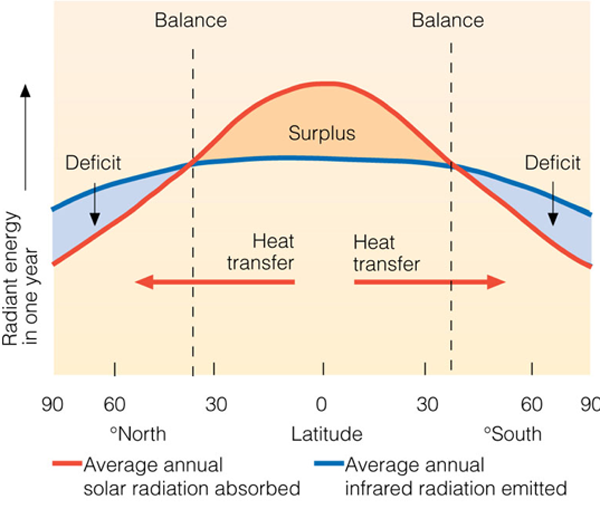
Earth's heat budget exhibits important variations with latitude. Heat input via solar radiation varies systematically with sun angle, and thus when averaged over a year, we find a simple relationship between latitude and heat absorbed, with more heat received in the equitorial region than in polar regions. The figure below shows this variation along with average annual radiation output from Earth. The dashed lines show the points at which input (heat absorbed at Earth's surface) is equal to output (heat lost via long-wavelength radiation).
Here's a useful animation for thinking about sun-angle variations throughout the year [3].
Now have a look at the figure below. This figure has important implications for wind generation and ocean currents because both are driven by temperature differences, and by heat input between the equatorial and polar regions. Winds and ocean currents play a major role in moving the surplus heat from the equatorial regions to the polar regions. Without this heat transfer, the polar regions of Earth would get colder every year and regions between ~ 35 N and 35 S would get warmer every year. Energy transfer occurs via sensible heat and via latent heat. As you'll recall from Lesson 3, latent heat of evaporation for water is very large compared to heat capacity, so it is no surprise that latent heat is the dominant process, with sensible heat transfer accounting for only a few percent of the heat flux, from ocean to atmosphere, associated with latent heat.
Wind and ocean currents
Winds and ocean currents play a big role in redistributing heat.
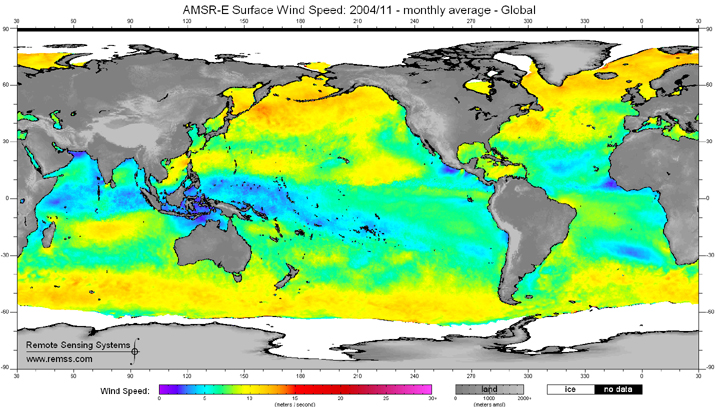
This figure shows sea surface wind speed, as derived from a NASA's satellite (Aqua) for the month of November, 2004. The large-scale pattern of surface ocean currents is set up by winds. Note the variations with latitude. Look back at the Hadley circulation and think about the location of the easterlies/westerlies compared to what you see here.
Reading assignment
Read the link below.
- The Atlantic heat conveyor slows [6] Are we heading toward The Day After Tomorrow?
Coriolis and Ekman Transport
For large scale winds and ocean currents, the Coriolis effect is an important consideration because it changes the net direction of heat transport.
Coriolis Effect The Coriolis effect is due to an inertial force that is important in a rotating frame of reference. As you know from Newton's laws of motion, bodies in motion stay in motion unless acted upon by external forces. So, a wind blowing from north to south should go in a straight line, and in fact, it does. The problem is that this straight line does not look straight when referenced to a spinning Earth. There are many on-line resources for the Coriolis effect, so I won't try to duplicate visualizations here, but there are a few things to get straight before looking at a few of them.
- The Coriolis force is given by the Coriolis acceleration times the mass of the object in motion. This is the familiar F = m a.
- The Coriolis acceleration is proportional to the cross product between the (linear) velocity of the moving object and the angular velocity of the rotating frame of reference. On Earth, the angular velocity is given by 360 deg/24 Hr. or 2 π (radians) per 24 Hrs, which is equal to 1.454e-4 radians per sec. The formula is: ac = - 2ω x v
- As you recall from plate tectonics and spherical trigonometry, the magnitude of a cross product like this can be obtained from the magnitude of each vector ( ω and v ) times the sin of the angle between them.
Thus, the magnitude of ac = ω v sinΔ where bold indicates magnitude and Δ is the solid angle between the vectors. For a three-dimensional body, this angle is a solid angle, and we can use the formulas developed from plate tectonics and spherical trigonometry to determine the solid angle. But fortunately, we don't need to use these, because the rotation axis corresponds to Earth's north pole, thus, we can just use the latitude.
If you want more background and examples, I can recommend the Wikipedia page [7] which is very well done.
I can also recommend: Coriolis explained [8]
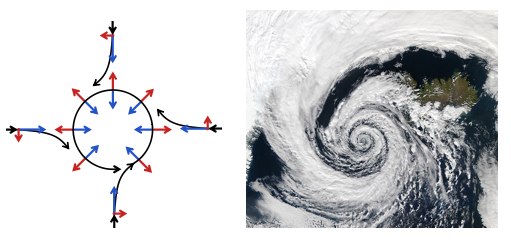
The left panel of the figure below is is an excellent summary of how the Coriolis effect (red arrows) combines with pressure driven wind (blue arrows) to produce the anticlockwise rotation (black arrows) around a low pressure system in the Northern Hemisphere What is the wind pattern, and sense of rotation, around a low pressure system in the Southern Hemisphere?
The right panel is a wonderful image of the wind pattern around a Low Pressure system over Iceland. Note the counterclockwise nature of the coiling pattern of the clouds. Does this look familiar from images that you've seen for hurricanes?
Reading
Read the link below.
- Coriolis Effect. [11] Thinking about Hadley circulation (and the image above), why does a north wind (i.e., a wind from the north) in the Northern hemisphere, such as in a Hadley Cell, blow toward the southwest?
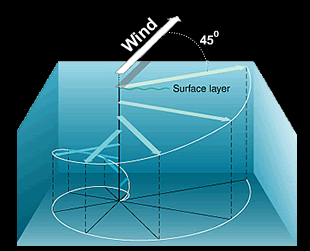
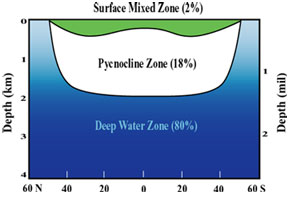
Ekman Transport Water in the ocean can be divided roughly into three regions based on density: surface water, the pycnocline, and deep water. The pycnocline (also called the thermocline or halocline: recall that seawater density (pycno) is determined by temperature (thermo) and salinity (halo). Winds drive surface currents in the ocean, and these currents are effected by the Coriolis effect. But surface flow causes motion in the water below, so things get a bit more complicated. The physical properties of Surface Waters vary smoothly from the ocean surface to the pycnocline, but for the purposes of this discussion, it's useful to imagine that the surface zone is composed of several layers of water. The top-most layer is driven by wind. Motion in this layer drives flow in the layer below, and so on, such that wind driven motion at the top, ultimately, drives flow in all of the layers below. Now here's the complication: each one of our 'layers' is influenced by the Coriolis effect. This sets up a spiral, with motion in each successively deeper layer bent somewhat to the right (in the Northern Hemisphere) relative to the forcing from above.
Read more about Ekman Transport here [12]
Ocean Circulation: Surface Water and Deep Water
Global ocean currents and thermohaline circulation
Reading assignment
Read the link below.
- Broecker, GSA today [13] What If the Conveyor Were to Shut Down? Reflections on a Possible Outcome of the Great Global Experiment
Recall from Lesson 3 that water density increases with increasing salinity and decreasing temperature. Water density varies throughout the ocean and the water at the bottom of the ocean is densest, of course. Ocean-atmosphere interactions have important implications for global ocean currents. For example, think about what would happen if a large scale surface current continually lost heat. The colder it got the denser the water would be, and eventually that water would become dense enough to sink, and become deep water. Now lets add in evaporation. Imagine that water was continually evaporated from our surface current. This would make it saltier, which would increase the density. Eventually, the density would increase enough for the water to sink and become deep water.
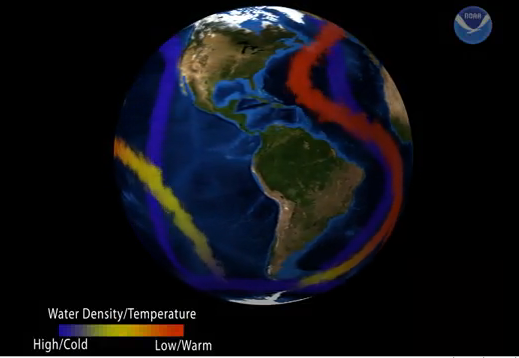
This is exactly what happens in the North Atlantic. But, if deep water forms in one place, then surface water has to form somewhere else; we can't push water into the deep ocean without something coming back to the surface, and in fact, surface water forms in various places in the ocean.
Look at the image above, and then back at the figure at the top of page 1 of this lesson. On page 1, the arrows are red for surface currents and blue for deep currents. The colors are a bit hard for me to see, but note that in the North Atlantic, a surface current flows north and a deep current flows south. This means that deep water forms in the North Atlantic.
It's important to appreciate that any Figure drawn at this scale, the entire ocean, is approximate. Don't take everything you see in these figures as the gospel. For a different perspective, have a look at this animation. [14]
The figure below shows the general structure of water masses as a function of depth in the ocean.
Activity 2
Why does surface water sink in the North Atlantic? Let's calculate the density differences between surface waters in the tropics vs. where deep water forms in the north.
Go to the Windows to the Universe [16] is web site and read the information there (under: Density of Ocean Water)
Then click on the links in the second paragraph for ("the temperature [17] of the water and the salinity of the water [18]....")
Use those images to determine Temperature and Salinity in the North Atlantic off the coast of Florida and off the coast of Ireland.
For temperature, you'll need to click on the link for "Sea Surface Temperature Image [19]," which is under the heading "Related Links." If you have trouble finding it, click here [17]
For salinity, you can just click on "the salinity of the water" and then on the map at the top of the page.
The colors are a bit tricky to distinguish, but do your best and report the values you chose.
- Calculate the density of the water masses off the coast of Florida and off the coast of Ireland. Make sure to record your values for temperature and salinity. You can use the Ocean Water Density Calculator [20] for the density calculation
- Comment. Is this about what you expected? How are water densities normally determined in the ocean?
Submitting your work
Please put your answers in a file and drop that in the dropbox for Lesson 4, Activity 2 on Canvas.
Save your document as either a Microsoft Word or PDF file in the following format:
L4_Activity2_AccessAccountID_LastName.doc (or .pages or .pdf)
For example, student Elvis Aaron Presley's file would be named "L4_Activity2_eap1_presley.doc".
Grading criteria
See the grading rubric [2] for specifics on how this assignment will be graded.
Gyres and Surface Currents
The global pattern of winds together with the Coriolis Effect and Ekman Transport produce large-scale currents in the world ocean. Ocean surface currents organize into Gyres that are characterized by circulation at the scale of the ocean basin. The figure below shows the basic pattern. Note that gyres circulate clockwise in the northern Hemisphere and counter-clockwise in the Southern Hemisphere.
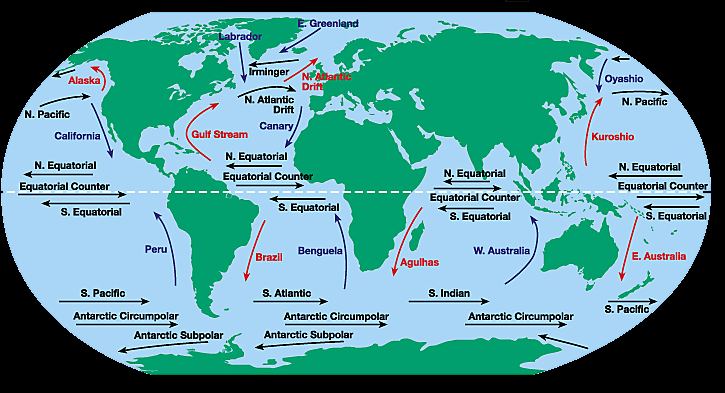
The influence of the Coriolis effect on ocean currents increases with increasing latitude, so the equatorial currents are similar in each ocean basin, although their flow direction (east to west) is consistent with the sense of flow in the large-scale gyres within each ocean basin. But the variation of Coriolis forcing as a function of latitude has a pronounced affect on surface currents. The poleward currents on the Western side of each ocean basin are distinctly different from those on the Eastern side of the ocean basin.
Western Boundary Currents are swift, narrow and deep relative to Eastern Boundary Currents, which are slower, broader and shallower than WBC's. Western Boundary Currents tend to carry heat from the equator poleward, so think back to where we started in this Lesson; everything is driven by differential solar heating. The excess heat received in the equatorial regions drives everything, including the strong Western Boundary Currents such as the familiar Gulf Stream and the East Australian Current (from Finding Nemo fame).
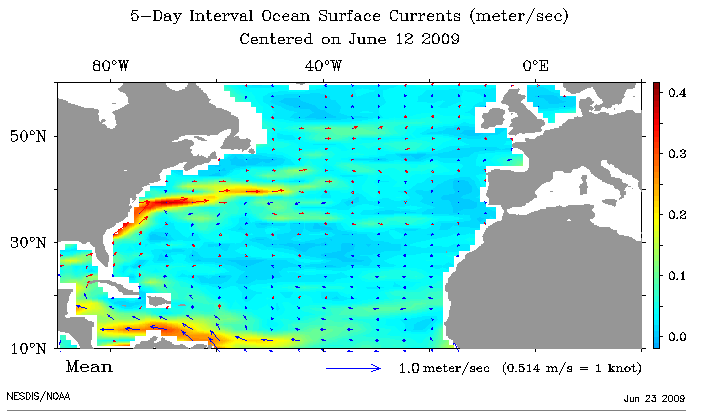
The figure below shows surface current information for the North Atlantic. The color scale is flow velocity in m/s, and the arrow along the bottom shows a 1 m/s scale bar (vector). Note the narrowness of the Gulf Stream.
Look here for more info on the Gulf Stream. [21]
Activity 3
Let's make our own maps and use them to calculate some things about heat transport. For this activity we will use ESR (Earth and Space Research) out of Seattle, WA. They have great research projects like OSCAR (Ocean Surface Current Analyses Real-Time) which suites our purposes nicely. Let's visit them HERE [22]. There's some good background information about OSCAR there, but we will be using the link "OSCAR on SOTO", with SOTO standing for "State of the Ocean". Once you click on "OSCAR on SOTO", you will open up a really cool interactive map. I encourage you to play around with it for a bit to see what kind of data it is capable of conveying (we could have used this for our density calculations for Activity 2!) Once you're done playing, check out "Ocean Current Speed", but then settle on "Ocean Current Vectors".
->Note: This web site is mostly gone. Some of it is available here: https://www.esr.org/research/oscar/overview/ [23]
- Make and save (using "Grab" on a Mac or another print-screen application) a few maps of surface currents where you look at seasonal variations as well as flow directions and the basic pattern of ocean-basin scale gyres.
- Choose your favorite map and tell me why you chose it in a few sentences. What did you learn from it? Put your map in a file, along with your comments.
- And now for a couple of calculations.
- Calculate an estimate of the volume of water that flowed poleward in the Gulf Stream during all of June 2016.
- Calculate an estimate of how much heat was transported by the Gulf Stream in June 2016 (You can choose to estimate sensible heat and/or latent heat)
There are multiple ways one can do these, just make sure I can follow your train of thought through each/both. Your calculations should:
- incorporate the max velocity of the Gulf Stream from June 2016
- assume that the depth of the current is 1 km
- estimate the width of the Gulf Stream from your map
- use OSCAR to find temperature estimates
Submitting your work
Please put your answers in a file and drop that in the dropbox for Activity 3 on Canvas.
Save your document as either a Microsoft Word or PDF file in the following format:
L4_Activity3_AccessAccountID_LastName.doc (or .pages or .pdf)
For example, student Elvis Aaron Presley's file would be named "L4_Activity3_eap1_presley.doc".
Grading criteria
See the grading rubric [2] for specifics on how this assignment will be graded.
Additional Resources
Want to explore these topics more? Here are some resources that might interest you.
Various Web site with links to resources aimed at teachers and students:
- General Oceanographic Data in a form that can be used to make maps and plots [24]
- University Corporation for Atmospheric Research (UCAR) [25] Note the Teacher Resources linked at the top of the page
- NASA Earth Science satellite [26]: Hover on "NASA Science for" to select "Educators"
Tell us about it!
Have another Web site on this topic that you have found useful? Share it in the Comment area below!
Don't see the "Comment" area below? You need to be logged in to this site first! Do so by using the link at the top of the left-hand menu bar. Once you have logged in, you may need to refresh the page in order to see the comment area below.
Summary & Final Tasks
Reminder - Complete all of the lesson tasks!
You have finished Lesson 4. Double-check the list of requirements on the first page of this lesson ("Lesson 4" in the menu bar) to make sure you have completed all of the activities listed there before beginning the next lesson.
Once you've completed all lesson tasks, make sure you enter the "Teaching and Learning" discussion in Canvas and tell us how you would teach a topic from this lesson in your own classroom
Tell us about it!
If you have anything you'd like to comment on, or add to, the lesson materials, feel free to post your thoughts below. For example, what did you have the most trouble with in this lesson? Was there anything useful here that you'd like to try in your own classroom?
Don't see the "Comment" area below? You need to be logged in to this site first! Do so by using the link at the top of the left-hand menu bar. Once you have logged in, you may need to refresh the page in order to see the comment area below.