Lesson 5
Lesson 5 Introduction
The Sea is Rising, the Sea is Rising
About Lesson 5
We will complete Lesson 5 in one week. The topic is vast, and perhaps worthy of a course in itself: climate change and its impact on sea level and the coastal zone. Our plan is to first study the methods, data, and observations related to past, present and future sea level change, then evaluate the impact of sea level change on the coastal zone. We will examine the interplay of data and models as well --inasmuch as future predictions are model based. Along the way, you will learn a little something about coastal evolution. Critical reading and evaluation of data are again key components of the Lesson. As you might surmise, future sea level rise is a controversial topic. We'll have some fun with the blogosphere and media distortion of scientific results.
What will we learn in Lesson 5?
By the end of Lesson 5, you should be able to:
- Explain the implications of global warming for sea level change
- Discuss the components of predicted future sea level rise
- Outline the impacts of sea level rise on the coastal zone
- Explain why beaches are dynamic features subject to continual change.
- Explain the origin of coastal estuaries and their history over the past 18 thousand years
- Relate the history of climate, continental ice sheets, and sea level of the past
What is due for Lesson 5?
As you work your way through these online materials for Lesson 5, you will encounter additional reading assignments and hands-on exercises and activities. The chart below provides an overview of the requirements for Lesson 5. For assignment details, refer to the lesson page noted.
| REQUIREMENT | LOCATION | SUBMITTED FOR GRADING? |
|---|---|---|
| Reading: Sea Level Rise, After the Ice Melted and Today | page 1 | |
|
Reading: IPCC Report: Observations: Oceanic Climate Change and Sea Level (this is a biggie!) Activity 1: Questions regarding sea level mechanisms and timing |
page 2 Canvas |
Essential Background Reading Yes, Canvas Dropbox |
|
Reading: "Birth of the modern Chesapeake Bay estuary" Activity 2: Questions regarding methods and implications |
page 4 Canvas |
Yes, Canvas Dropbox |
Questions?
Post them to our Questions discussion forum on Canvas or get in touch by email.
Buying Beach Property?
Yes, here is an essential question. Perhaps today's economy is not encouraging, so none of you are rushing out to purchase that beachfront house for the summer. But, let's assume that you have a cool million (or two) dollars languishing in your accounts--perhaps Bernard Madoff has just provided you a return on your investment! Would you go to your favorite coastal area, engage a real estate agent, and put in a bid for one of the many properties now available? Remember, buying when the market is down can make for good investments. Or would it in this case? The question is "what would you look for in a coastal property?"
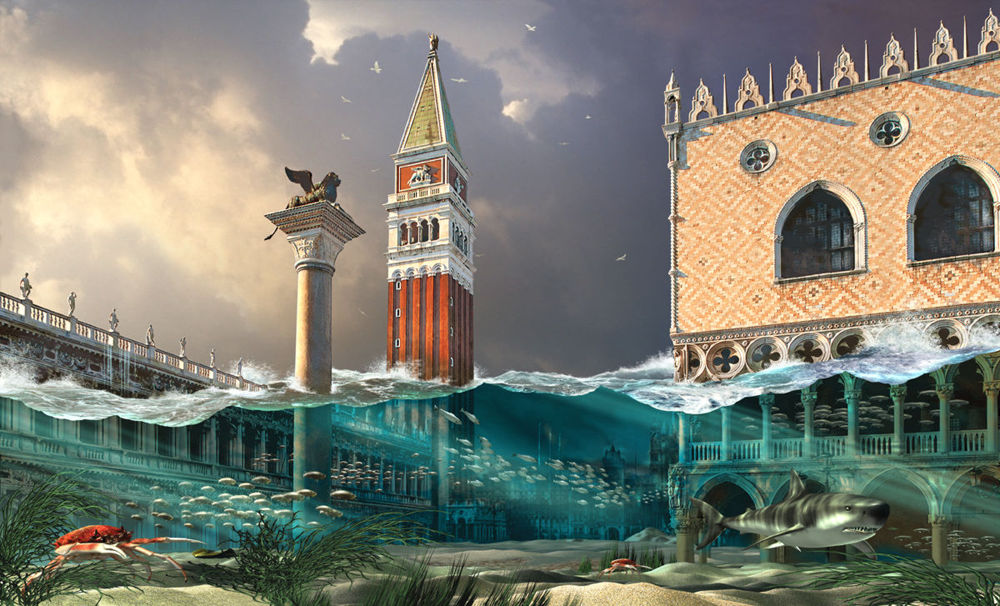
Rather than answering that directly, let's embark on a consideration of the controversial topics of global climate change and resulting sea level change. Perhaps, after a reasonably intensive study of controls on sea level and predictions for the future, you will get cold feet on the coastal property purchase. Let's hope that it's not because you are standing inches deep in cold seawater in your living room! This fanciful artist's conception of Venice after a meter of sea level rise is not so far from reality. Engineers are, as we speak, planning an elaborate system of gates to prevent flooding of Venice while still allowing seawater to cycle through the adjacent wetland estuaries.
Reading--for an overview of global sea level change over the past 18 thousand years or so
Click on the links below.
T [1]he Great Ice Meltdown and Rising Seas: Lessons for Tomorrow [2] By Vivien Gornitz — June 2012
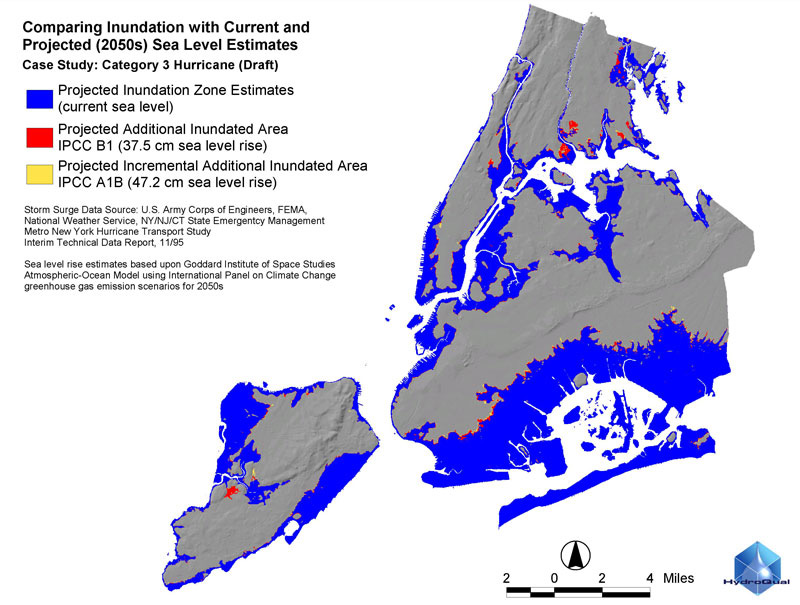
Why is an understanding of future sea level so critical? It's the economy, it lives in the balance...! Think about the implications of meters of sea level rise in a short period of time. According to modeling studies, a category three hurricane (not the most severe by any means), given a certain critical storm track to the west of Manhattan, could create a storm-surge (more on this in a later lesson) of up to 6 meters at JFK Airport, 7 meters at the Lincoln Tunnel entrance, 8 meters at the Battery, and 5 meters at La Guardia Airport. The numbers could be larger if the storm passage coincides with high tide and if one considers the height of waves riding on the surge. What if sea level were, on average, a meter or two higher? Catastrophic flooding, loss of property, life and enormous cleanup costs. Certainly, hurricanes have affected New York City in the past. One made landfall at Jamaica Bay on Sept. 3, 1821 with a 13-foot storm surge, causing widespread flooding in lower Manhattan. The "Great Hurricane of 1938," [3] a category three storm, tracked across central Long Island and southern New England on Sept. 21, 1938. The storm pushed a 25-35 foot high wall of water ahead of it, sweeping away protective barrier dunes and buildings. Some 700 people lost their lives during this storm. Things could be worse with any rise in sea level. The image below projects flooding associated with a Category 3 hurricane, as described above, with projections for additional flooding anticipated with given rises in sea level through 2050. Looks as though these "experts" might expect as much as 47 cm rise in the next 40 years. Hmmm, that's just over 1 mm per year. What is the present rate of rise? Is it expected to slow? On to the next phase of this lesson.
The Sea Also Rises--global change!
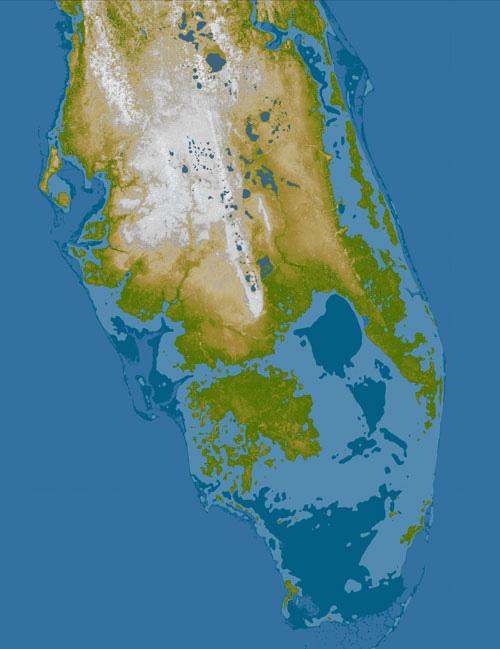
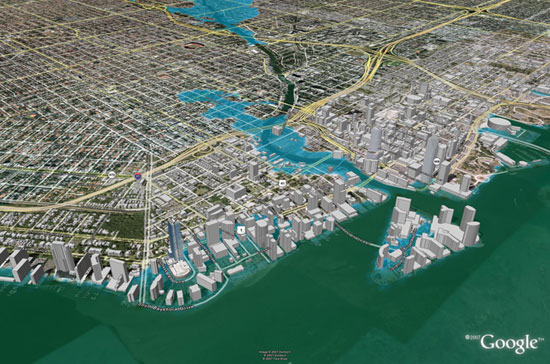
So, here is the (late?) great state of Florida flooded by a 5-meter rise in sea level (dark blue) and a 10-meter rise (light blue). Yes, far in the future, but not beyond imagination should, for example, the Greenland ice sheet completely melt back. Miami is gone, Tampa is gone...At what cost? When you take a look at a map of elevations around Miami, for example, you find that much development has occurred at heights above sea level of only 1 meter or so (see next chapter). Amazing! Could we ever do anything to save this region--short of building an elaborate set of dikes (like those protecting New Orleans today!) or somehow reversing the effects of global warming? What's going to happen to the folks in Holland?
Sea level changes on a global, as well as local, basis because of a number of factors. We are presently most concerned with rising sea level that results primarily from warming of seawater (why?), melting of continental glaciers and ice sheets (but not sea ice. Why?). How do we know that sea level has changed in the past, and how do we monitor sea level change at present?
Reading 2
Time to delve into something you've certainly seen in the news -- the well-known IPCC (Intergovernmental Panel on Climate Change) Report. This section of Working Group 1 discusses sea level change related to climate change. This is a "consensus" report from numerous scientists--experts in their fields. We're going to look mainly at the most recent Report (Fifth Assessment Report, AR5; 2013) and you might also want to look briefly at the 2007 IPCC Report.
You can find the full set of reports on the ipcc [4] website [4].
You will read Sections of Chapter 13, including the Executive Summary and Section 13.1 on Sea Level. You should also scan over other parts of Chapter 13, to get a sense of the overall content. This will provide an essential background in preparation for the first activity, so read carefully and make sure you understand the data, techniques and concepts. Feel free to post comments/questions below to the class with questions if there is something you do not understand.
When you are finished reading, you will go on to the next part in this Lesson to begin Activity 1.
Sea Level--what do we know about the past and future?
Activity 1
After reading the assigned articles and examining the figures above, answer the following questions. You may simply provide a list of elements, when appropriate. Elaborate if you like.
- How much sea level rise has occurred since about 18 thousand years ago and why (generally)?
- How do geologists estimate sea level history, at least for the last glacial through the Holocene (last 18 thousand years)?
- What methods are used to estimate rates of change of sea level at present and in the historical past? Provide an estimate of their accuracy.
- What are the major components of present sea level rise and their relative importance?
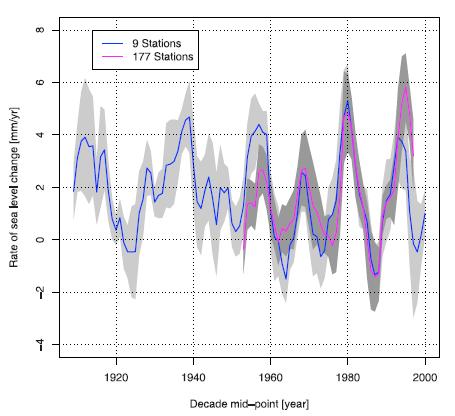
- In Figure 2 (above), why is there so much noise about the smoothed curve?
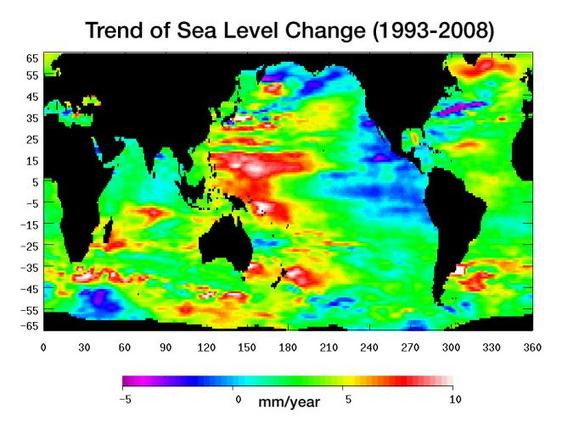
- In Figure 3, why do certain anomalies occur (explain in terms of circulation, winds, etc.--use principles from Lesson 4)?
- explain the large area of red to white color in the western Pacific on each side of the Equator
- explain the large area of light blue to dark blue in the eastern Pacific straddling the Equator
- speculate about the origin of the swath of blue to magenta projecting to the northeast from the margin of the eastern U.S.
- What is the "best" estimate as to the amount of sea level rise that will occur in the next half century? Why did you choose this number? What assumptions are you making when you state a number such as this? Provide an estimate of uncertainty based on the assumptions. Do you believe that this will come to pass?
- Think about the IPCC Report that you read. It represents a "scientific consensus." What does "consensus" mean in this regard? Do you view this term as controversial? Just because the "majority" of scientists accept this concept of global warming and sea level change, should we base our present and future actions on this hypothesis? Why or why not?
Submitting your work
Please put your answers in a file and drop that in the dropbox on Canvas.
Save your document as either a Microsoft Word or PDF file in the following format:
L5_Activity1_AccessAccountID_LastName.doc (or .pages or .pdf)
For example, student Elvis Aaron Presley's file would be named "L5_Activity1_eap1_presley.doc".
Grading criteria
See the grading rubric [7] for specifics on how this assignment will be graded.
Not All Sea Level Change is Bad (or Is It?)
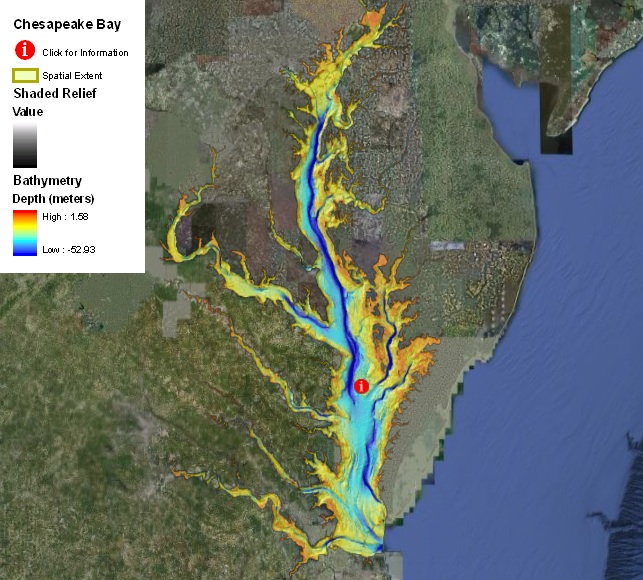
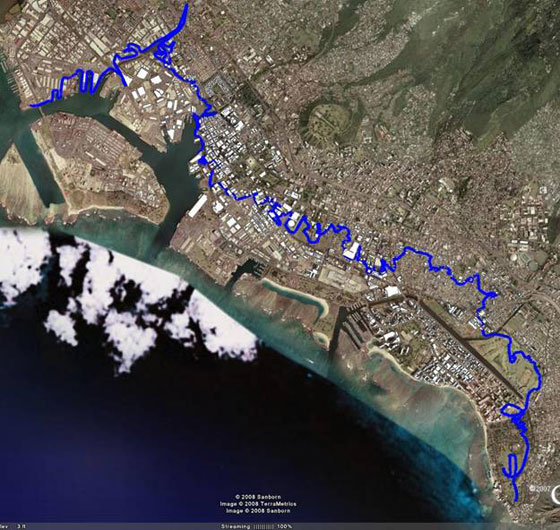
You can use Google Earth to explore your own digital map of water depths like the one above. Just download a file at NOAA's NCEI Bathymetry [8] site and, once downloaded, select the ".kmz" file. Files are quite large, but very elucidating (try to find something near your house or favorite beach!).
Note the deepest value of nearly 53 meters in the estuary above. Why do the deeper channels tend to hug the east side of the estuary? Is this Coriolis?
In this portion of Lesson 5, we will examine one role of sea level rise in coastal evolution--that of the formation of estuaries. Of course, estuaries are an important feature of the coastal region because they provide water routes to inland regions for shipping, defense, etc., and because they are typically nurseries for the larvae and immature stages of many marine organisms as well as being important fisheries. In this course we will concentrate on the Chesapeake Bay estuary because of its proximity to most of the class and importance to the economy of the mid-Atlantic region. Those in University Park, PA have a direct connection to the Chesapeake because they live in the Susquehanna River watershed which ultimately dumps into the Chesapeake Bay. We'll begin here with a study of the formation of this estuary, and in subsequent lessons we will explore the ecosystem itself and the problems it faces now.
Reading
Click on the links below to access a scientific article on the origin of Chesapeake Bay. Read this paper and think about the evidence that these scientists use to reconstruct the early history of this estuary and the timing and impact of sea level changes. Note the importance of the 8.2 thousand year "event."
Activity 2: Formation of the Chesapeake Bay Estuary
Let's outline some aspects of the work of a sedimentary geologist who is trying to reconstruct the timing and early history of an estuary. Answer the questions below to provide an overview of their approach and methods. Again, for some questions a short answer or list will suffice, but support your conclusion with further discussion if appropriate. Submit your ms word or pdf document as outlined below and drop into the Canvas dropbox for Lesson 5.
- What technique(s) allows the authors to establish absolute ages for the sedimentary layers in the estuary?
- Why is the estuary so deep? (e.g., what created the estuary morphology originally, and in response to what?)
- What is the most likely age of the establishment of the Chesapeake Bay estuary? What caused this event? (think back to your earlier reading on the origin of certain sea level changes in the past 18 thousand years).
- What evidence did the authors use to demonstrate that this was truly an "estuary"?
- How did the authors reconstruct sea level history at Site 5? (see Fig. 4 in the Bratton article)
- If the deepest part of Chesapeake Bay is around 53 meters, does this fit with the timing for flooding of the estuary by sea level rise argued in the Bratton et al. paper? (hint: examine an illustration for the history of sea level over the past 18 thousand years in one of the first two papers assigned for this lesson). If not, how could this discrepancy be explained?
Submitting your work
Save your document as either a Microsoft Word or PDF file in the following format:
L5_Activity2_AccessAccountID_LastName.doc (or .pages or .pdf)
For example, student Elvis Aaron Presley's file would be named "L5_Activity2_eap1_presley.doc".
Grading criteria
See the grading rubric [7] for specifics on how this assignment will be graded.
The Sea Also Rises--or Does It?
Let's evaluate some of the data sets required to establish the history of sea level changes. This history can provide a perspective on more recent rates of change. Inasmuch as it is our goal to encourage you and your students to critically evaluate scientific hypotheses and data, this is another in a series of issues that deserves deeper study. In particular, this is an opportunity to see how the media respond to various issues and how individuals might distort conclusions of scientific papers, or selectively extract certain data or plots, to further their own objectives. It will not surprise you to find that there are skeptics regarding the predictions of the IPCC Report and others. We will examine some of them and attempt to analyze their methods and misstatements or misleading conclusions. You can have some fun with this and perhaps think about how it would tie in with teaching goals.
Reading
This is the scientific paper published in 2007 by S.J. Holgate, a reputable scientist studying sea level changes at the Proudman Oceanographic Laboratory, Liverpool, UK (wonder if he listens to "Yellow Submarine" when he writes his papers?). The paper is a critical evaluation of tide gauge data used in reconstructing sea level history. You will need to read this paper to understand how tide gauges are used and their strengths and weaknesses. The paper also emphasizes spatial statistics, which are an important consideration in global reconstructions.
- Holgate, 2007 [10]
Consequences of Sea Level Rise
Think again about the economic and human consequences of sea level rise. Developed areas would be flooded at great cost, or, we would have to spend inordinate amounts of "public" money to protect them. In areas such as Bangaladesh, sea level rise would wipe out agricultural production and cause huge loss of life (which already occurs during cyclones in the Indian Ocean).
Sea level rise will inexorably cause the coastal zone to "step back" just as has occurred over the past 18 thousand years as wave attack erodes cliffs and moves sand from beaches farther onshore and offshore. Our favorite barrier island beaches will evolve, but the houses on them will be destroyed or moved back at great cost.
Additional Resources
Here are several more web sites. We highly recommend the Real Climate site as a resource to understand the nature of arguments for and against human-induced global warming and its consequences. This is a moderated site, but allows dissenting viewpoints. Very balanced.
- The Real Climate page (excellent discussions, pro and con) [11]
- Sea Change: How High Will the Sea Rise? [12]
- NOVA - "Mountain of Ice: If the Ice Melts" [13]
Tell us about it!
Have another reading or Web site on these topics that you have found useful? Share it in the Comment area below!
Summary & Final Tasks
Reminder - Complete all of the lesson tasks!
You have finished Lesson 5. Double-check the list of requirements on the Lesson 5 Overview page to make sure you have completed all of the activities listed there before beginning the next lesson.
Once you've completed all lesson tasks, make sure you enter the "Teaching and Learning" discussion in Canvas and tell us how you would teach a topic from this lesson in your own classroom
Tell us about it!
If you have anything you'd like to comment on, or add to, the lesson materials, feel free to post your thoughts below. For example, what did you have the most trouble with in this lesson? Was there anything useful here that you'd like to try in your own classroom? Is climate change a topic you and your students are interested in? Do your students have much interest in or opinions about the politics/science of global climate change?