Lesson 12 - Topical Issues, Part 3: Changes in the Electricity Business
Lesson 12 Overview
In this lesson, we will look at the economics of the electricity industry, which is one of the largest and most pervasive energy markets in the world today. We will describe the supply and demand fundamentals, how prices are established, and what drives changes in prices. We will then look at some topics that will affect this industry in the near future:
- The boom in the production of natural gas in the US, and what this means for the power sector.
- The drive to enlarge the share of electricity generated by renewable sources of energy.
- The future of the nuclear power industry in the wake of the recent Japanese earthquake and tsunami and ensuing nuclear accident.
What will we learn?
By the end of this lesson, you should be able to:
- describe the electricity "value chain";
- draw, label and explain the key components of a supply and demand diagram for electricity;
- explain what a generation stack is;
- describe what is meant by the term "load shape";
- list and describe various environmental regulations affecting the coal-fired electricity generation sector;
- describe the effects of these regulations on electricity prices;
- explain what "renewable portfolio standards" are.
What is due for Lesson 12?
This lesson will take us one week to complete. Please refer to Canvas for specific time frames and due dates. There are a number of required activities in this lesson. The chart below provides an overview of those activities that must be submitted for this lesson. For assignment details, refer to the lesson page noted.
| Requirements | Submitting Your Work |
|---|---|
| Reading: A number of web links concerning course reading can be found in this lesson. Please read all that are shown as required. | Not submitted |
| Lesson Quiz and Homework | Submitted in Canvas |
The Fundamentals of Electricity Markets
Electricity is a form of energy transportation and utilization that is central to our way of life today - for most of us, life without electricity would be unimaginable. We all have had the experience of a blackout, and productive life generally comes to a halt when this happens - everything shuts down and we wait for the power to come back on before being able to do almost anything.
Electricity is what we call a "secondary" energy source - it is energy that is released from some other source, and converted by mankind into electricity for transportation and end-use. Aside from lightning and static electricity, there is precious little electricity in nature - no electricity mines or wells - and that which does exist in nature is not very suitable for human use. Instead, some other form of energy is converted to electricity. The most common sources of energy are as follows:
- Chemical energy, released by burning fossil fuels such as coal, oil and natural gas, or biomass such as wood.
- Nuclear energy, which is released by the nuclear decay of radioactive elements such as uranium and plutonium.
- Potential energy, which is released by the forces of gravity pulling something towards earth. The most common form of potential energy that is converted to electricity is that stored in water.
- Kinetic energy, or the energy of some moving particle. The most common form of kinetic energy conversion is the windmill, which converts the energy of moving air into electricity.
- Solar energy, in which energy radiated from the sun is captured and converted to electricity.
It can be generalized that all of these forms of energy come from the sun, some directly and some by very circuitous routes.
Recommended Reading
For more background on the rudiments of electricity, please read the "Electricity Explained" section of the US Energy Information Administration's "Energy Explained" web page. Please be sure to read the whole thing, including all of the subpages, which will give you a thorough overview of most of what we will be talking about in this lesson.
The Electricity Value Chain
There are several steps involved in getting electricity to the end user. It is typically broken up into four steps, as follows:
- Primary energy acquisition,
- Generation,
- Transmission, and
- Distribution.
The first step, primary energy acquisition, refers to obtaining the "primary" naturally-occurring energy that will be converted to electricity. As mentioned above, for the most part in the US, this involves purchasing coal, natural gas, or uranium. These are all large, often global, industries unto themselves, and we certainly do not have time to examine these industries in depth in this lesson. If you are an Energy Business and Finance Major, or if you are enrolled in the Energy & Sustainability Policy degree program, you will learn a lot more about the structure and operation of the primary energy industries. These industries all have their own "value chain", by which I mean steps, stages, or processes that involve some enterprise that adds value to a naturally occurring resource. For example, for gasoline, the value chain looks something like this:
- Exploration: finding oil in the ground;
- Development: drilling wells and building gathering systems;
- Production: operating wells to get the oil out of the ground;
- Field processing: eliminating undesired components, such as water, sulfur, and carbon dioxide, at or near the wellhead;
- Transportation: moving the crude oil from the oilfield to the refinery, usually by tanker or pipeline;
- Refining: converting the crude oil into useful products like gasoline, diesel, heating oil, and jet fuel;
- Distribution: moving the products from the refineries to retail locations; and
- Retailing: selling the product to end-users, who then burn it to obtain energy for heating, transportation, or electricity generation.
Each one of these eight steps involves many more substeps, each of which can provide a person with a lifetime of learning opportunities and employment. Fortunately for us, the electricity value chain is a bit shorter - as listed above, after we have obtained fuel, electricity consists of three things: generation, transmission, and distribution. We will now take a look at the economics of each of these stages, going in reverse order.
First a diagram, illustrating the different parts of the system. This is borrowed from the website of PECO Energy, the utility in Philadelphia, which is part of one of the companies that I used to work for, Exelon.
As you can see, there are five numbered parts to Figure 12.1:
- The power plant, where primary energy from fuel is converted to electricity using a generator.
- High-voltage transmission lines, which efficiently move electricity over large distances from power plants to end users. These are necessary because today most power plants are built in remote places far from where people live, since a power plant is seldom a good thing to live beside.
- A substation is the link between the transmission system and the distribution system. It "steps down" the voltage to lower levels suitable for distributing to end users.
- Transformers reduce the voltage further to levels that can be used by appliances and machines operated by end users.
- Local distribution wires move this low-voltage power to end-use locations, otherwise known as homes, schools, and businesses.
Distribution
In the above diagram, parts 3, 4, and 5 represent the distribution system. In economic terms, distribution systems are natural monopolies. If we go back to our discussion of natural monopolies in the section on market power, we know that natural monopolies are usually network systems with very high initial capital costs and a very low marginal cost to serving every extra customer, or in this case, delivering the next watt of electricity. We know that a natural monopoly is an "equilibrium" outcome for this sort of market, and that a single supplier can serve each new customer at a lower cost than if there were competitors. For this reason, distribution systems, such as PECO in Philadelphia, Duquesne in Pittsburgh, ConEd in New York and ComEd in Chicago, are regulated at the state level by public utility commissions. They are allowed to charge prices that will give them an approved rate of return on their assets - typically 8-12%. Thus, there is not really much of a market at work here.
Transmission
Like distribution, transmission is somewhat of a natural monopoly - duplication of service requires large capital expenditures that will be very difficult to recover in a competitive market. Because transmission typically operates over long distances, and frequently over state lines, it is regulated at the federal level by the Federal Energy Regulatory Commission, FERC.
Generation
Unlike transmission or distribution, generation is not a natural monopoly. While the marginal cost curves and, hence, supply curves for transmission and distribution services are generally downward sloping over the applicable range of operation, the same is not true for the consumption of electrical energy. It is instructive to think of generation as the place where energy in the form of electricity is created, and the transmission and distribution systems as networks for delivering. Here, we are talking about the manufacturing and consumption of electrical energy. The supply curve for the manufacturing of electrical energy is not downward sloping, at least not over the applicable range of demand. Instead, the supply curve is very much upward sloping.
In reality, the market for electrical energy, which I will simply refer to as the market for power from here on, is perhaps the closest to a textbook example of a supply and demand diagram as we will see in any market. That is, the supply curves and demand curves are very much observable, and the intersection of the two, which sets the price, is not a result of trial-and-error and bargaining between consumer and seller, but is, in fact, the result of a complicated mathematical operation based upon costs and demand curves that are specified in rather exacting detail by the suppliers and demanders.
In the past, electricity was a "vertically integrated" industry, meaning that one company owned every stage of the production process. Utilities used to own their own generation, transmission, and distribution. However, because generation is actually a competitive market with upward-sloping supply curves, it does not need to be regulated as part of a "rate case," as is the case for distribution and transmission. So, in most of the country, in the 1980s and 1990s, the generation part of the system was sold off or spun off into separate companies. These companies are called "merchant generators" or "unregulated generators," because they are selling at marginal cost into a competitive marketplace, bidding against other firms. They are not natural monopolies that need to be controlled by public utility commissions. This is the case in most of the country, including the Northeast, Midwest, Texas, and California. It is not the case in the Southeast, Rocky Mountain states or Northwest - in those parts of the country, generation is still owned by utilities and still regulated by utility commissions. There is lots of evidence that markets systems for generation deliver lower costs and better service, but many areas are comfortable keeping generation under the control of utility commissions. They are trading off lower costs and potential innovations for stability and less price volatility.
In a competitive market, each generator enters bids for how much of its output power it wants to sell at what price. That is, each generator gives an individual supply curve to the system operator. The system operator is a quasi-governmental non-profit firm that is responsible for collecting all of the bids, arranging them in ascending order of price, and then figuring out which power plants shall be turned on, and when. This is done on a "day-ahead" basis, where generators enter their bids for tomorrow and, after a few hours of computer runs, are told if and when they will be expected to turn on the next day.
When we add together each individual supply curve, we are left with an aggregate supply curve that is called a "generation stack" - literally, all of the generators are "stacked up" in ascending order of marginal cost, and only the lowest cost ones necessary to meet expected demand will be turned on the next day.
The following diagram is a typical generation stack for the "PJM" electricity market. PJM is the name of the market which started around the Philadelphia area, with the initials "PJM" standing for "Pennsylvania-Jersey-Maryland", parts of which were covered by this market. PJM has since grown to cover a region that spans from New Jersey as far west as Illinois and as far south as North Carolina.
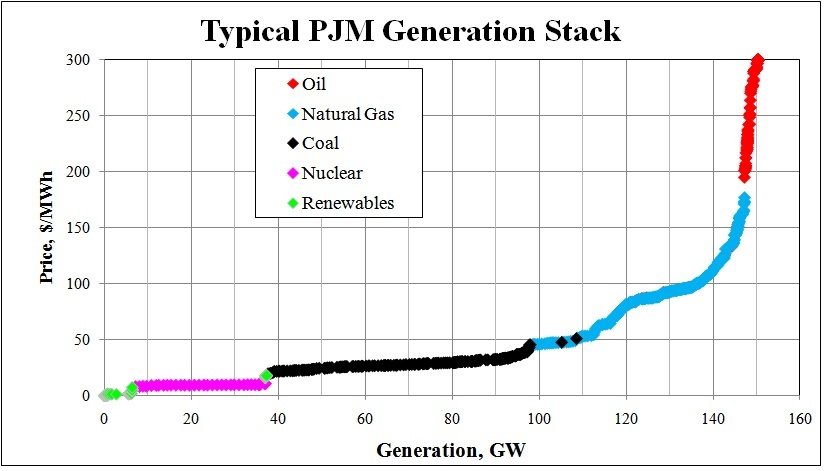
One important thing to note: the above diagram describes what an electricity supply curve looked like in about 2008. Things have changed a lot since then, and we will talk about those changes in the next two sections of this lesson.
In the above figure, each dot represents a power plant, and they are sorted in ascending order of marginal cost. You should be able to see some patterns. In green, we have the renewable generation, which has very low marginal costs. This should make some sense - hydro, solar, and wind power get their "fuel" - rainfall, the sun, and the wind - for free, so the marginal cost of producing a little bit more hydro, solar, or wind power is essentially zero. In purple, we have nuclear power, which has a pretty low marginal cost, because the fuel contains a very large amount of energy for a small mass. The black units are coal-fired. Coal has a variety of components to its marginal cost - most of the cost is fuel, but these plants also have to either buy emissions permits or run emissions-control equipment, which raises costs. In blue, we have natural gas units, which are typically more expensive to run than coal units because natural gas is normally more expensive than coal. At the top of the stack, in red, we have oil-powered units. These are generally very small, so they are not very efficient, and oil costs a lot of money today, so these units can be very expensive - in this case, about 6 to 10 times as expensive as a typical coal unit.
The Demand Curve
In electricity markets, the demand side is called the "load". The load is simply the sum of all demands for electricity in a market at any given time. The demand curve for electricity is considered to be a vertical line, which was previously described as a perfectly inelastic demand curve. Why is this so? When we flip on a TV or computer at home, or when a factory starts a machine, or an office or store opens and turns on the lights, we are assuming that the power will be there, instantly. Because load is changing instantly, we assume that whatever is being asked for RIGHT NOW is a fixed, and not a variable value. Whatever the load is, it must be served, meaning that it does not change according to what the price is. It does change from minute to minute, and hour to hour, and across seasons, but for every interval, it can be assumed constant, and if it is a constant, it will be a vertical line on the supply-demand graph. Thus, the price of electricity varies continuously as the intersection of the supply curve and the continuously-moving demand curve shifts about. In real-life, this calculation is done every five minutes, so in a typical wholesale electricity market like PJM, there will be 12 prices per hour, changing once every five minutes.
Load changes continuously as people turn stuff on and off, as temperature changes, as the natural light comes and goes, and so on. This pattern of changing load is called a "load shape". We can have daily load shapes, weekly ones, and annual ones. The following diagram shows the path of load for three different weeks at three different times of year in 2009.
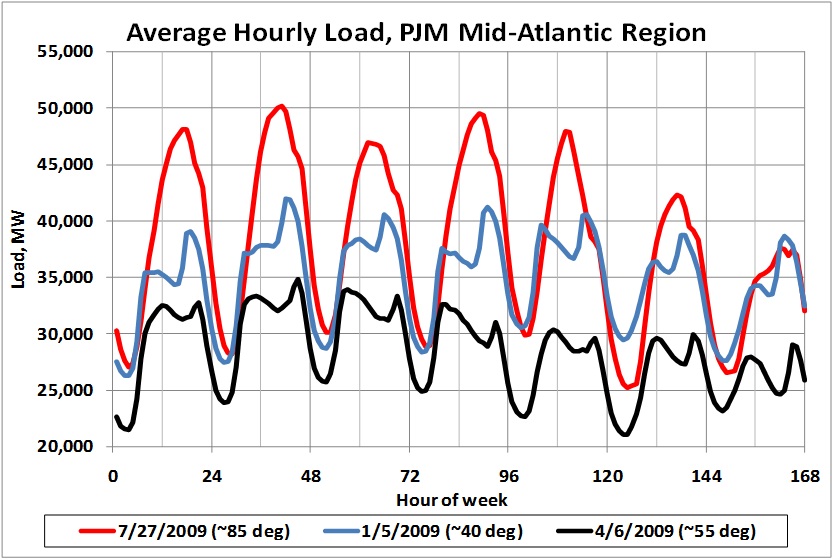
In the above figure, some patterns should be obvious. By the way, this diagram starts at hour 1 of the week, which would be 1 am on Monday morning. Hour 120 corresponds to midnight Friday night. You can see seven distinct peaks and dips, representing high load during daytime and low load at night, between midnight and 6 am. In the winter and spring, we have two peaks each day, representing the morning (breakfast) and evening (dinner) periods. In the summer (the red line), there is a single peak which occurs at about 3-5 pm. This represents the time of day when air-conditioning is most used. In the spring (black line), loads are lower than either summer or winter, as there is less heating and lighting load than winter and less cooling load than summer. Typically, loads are lower on weekends, when offices and schools are mostly closed.
Pricing
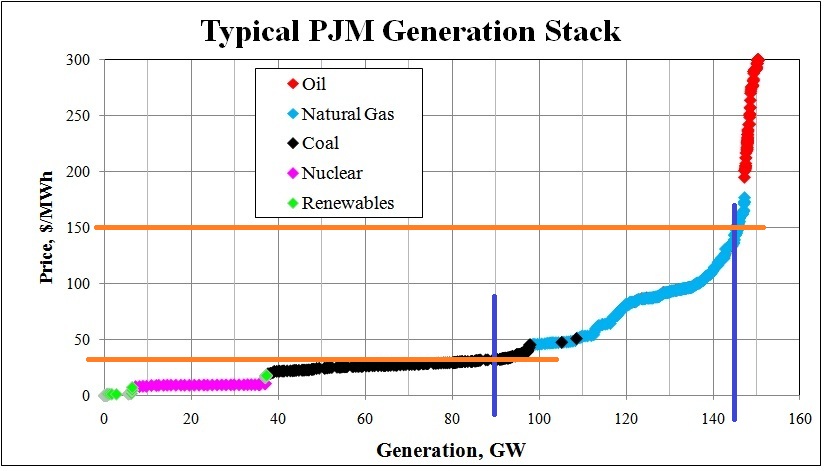
Looking at the generation stack, you can see how price is calculated. If load is about 90 GW (Gigawatts), which is the amount of power consumed by about 75 million homes on an annual average basis, we draw a vertical line at 90 GW (in blue, below) and then draw a line across at the intersection with the stack (the orange line). As you can see, the lower orange line intersects the price axis at about \$35 per Megawatt-hour (MWh). Now, if it is a hot summer day and lots of air conditioning is being used, then, for the same system, we might see a load of 145 GW. In this case, draw the blue vertical demand line, and then project the orange line over, and you see we get a price of about \$150 per MWh. This explains why power prices can be so volatile, varying from close to zero at some hours up to, possibly, several thousands of dollars, all within the same day.
Environmental Regulations and Coal-Fired Generation
Coal is a dirty fuel:
- It contains sulfur, which forms sulfur dioxide (SO2) in the combustion process, which goes into the air where it mixes with water vapor and forms H2SO4, better known as sulfuric acid, a corrosive and toxic substance that was responsible for many lakes and rivers in the northeastern US becoming bereft of marine life in the 1950s and 60s. Sulfuric acid has also led to corrosion and damage of a large number of buildings, bridges, and other infrastructure.
- As part of the combustion process, oxides of nitrogen, NO and NO2 (known collectively as NOx) are formed. These are precursors for the formation of tropospheric (low-level) ozone, which is a substance that causes asthma and other lung irritation. High concentrations of low-level ozone have been strongly linked to higher mortality rates.
- The exhaust gases created from burning coal carry a lot of particulate matter into the environment, because as a form of sedimentary rock, coal contains lots of non-combustible inorganic matter (sand, for example). These minute particles are a precursor to photochemical smog, another soup of chemicals that has serious negative effects on the respiratory systems of human beings, especially the young, old, and infirm.
- Coal contains many heavy metals and radioactive minerals, such as mercury, vanadium, and uranium. Upon burning, these can travel into the atmosphere, where they are ingested by human beings. Exposure of humans to heavy metals is linked to developmental disabilities, especially in children.
- Coal emits more carbon dioxide per unit of energy than any other fossil fuel. This was discussed in more depth in Lesson 10. While many people believe that emissions of carbon dioxide from fossil-fuel combustion do not cause anthropogenic global warming, there is a great deal of evidence that temperatures have been warming due to the greenhouse effect, which is a broadly accepted scientific phenomenon.
- Coal burning generates a lot of toxic ash, which must then be disposed of.
Because of these factors, there is a growing opposition to the use of coal as a fuel for electricity generation. This opposition is beginning to manifest itself in a set of regulations being developed and released by the US Environmental Protection Agency.
We will talk more about these regulations in a moment, but first, let us take a look at the role of coal in the US generation sector.
In 2018, we mine about 750 million tons of coal per year in the United States (click here for the most recent data). This equates to about 4,600 lbs per year for each of the 326 million people in this country. Almost all of this coal is burned to create electricity in the US. A small percentage goes to steel-making and other industrial processes, and a small amount is exported, but about 95% is burned to generate electricity. Thus, about 12.6 pounds of coal is burned per person, every day of the year to make electricity.
How much of our electricity comes from coal? The following chart gives the breakdown of generation by fuel source.
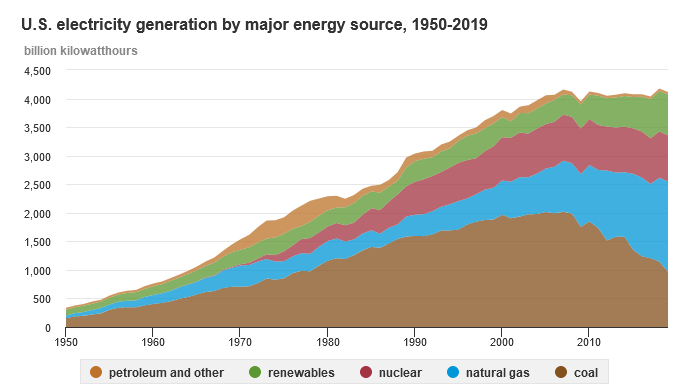
According to EIA, coal supplies about 24% of the electricity (in 2019) we consume in this country, and until very recently, it was over half.
Looking back at the generation stack diagram in the previous section, you can see that coal also forms one of the lower-cost parts of the supply curve.
Thus, we have come to rely upon coal to provide a large chunk of comparatively cheap electricity for us. Many people would like to replace coal-fired generation with cleaner sources of generation, especially renewable energy, but, as you can see from the above graph, we would have to multiply the quantity of electricity coming from renewables by six times the current total to be able to replace coal.
Environmental Regulations Affecting Coal
The Clean Air Transport Rule
This is a regulation, which was released in July 2010, that sets new limits on SO2 and NOx emissions.
Recommended Reading
Please read this presentation from the EPA summarizing the new Air Transport Rule.
We spoke earlier in the course about the permit trading program that was enacted by the Clean Air Act Amendments of 1990, which was very successful in reducing the amount of these pollutants emitted by power plants. It was felt by many in the environmental field that the benefits of this program had hit a plateau, and for further reduction in emissions and improvements in air quality to occur, a newer, more stringent rule would be required. This is that rule. It limits the market for permit trading to within states, and not between states, meaning that plants within a state would have to collectively meet some firm emissions caps, and not buy permits from other generators out of state. There will also be fewer permits issued than under the old program.
Coal Ash Rule
As mentioned above, coal combustion generates a lot of solid waste, in the form of ash, that must be disposed of. Much of this ash is held in liquid form in holding ponds before final disposal, often in dedicated landfills, or in old coal mines, or as a component of cement. In December of 2008, a retaining wall in a holding pond at a TVA power plant in Kingston, Tennessee failed. Over a billion gallons of liquid ash spilt into a river and flooded over 300 acres of neighboring land.
Recommended Reading
A good summary of the incident can be found at this Wikipedia page.
In the wake of this event, the EPA decided to issue a rule concerning the handling and disposal of coal ash. In 2010, they released a proposed rule with two possible paths of action - either the ash will be classified as a hazardous waste, which would make it subject to stringent, and extremely expensive disposal procedures, or a less strict interpretation of the rule would classify the ash as a special waste, which would be much less expensive to deal with. The final form of the rule is yet to be announced, but it is likely that it will be the less stringent interpretation of the two.
Recommended Reading
The EPA has put together a PowerPoint presentation with a summary description of the proposed Coal Ash Rule. Please read this presentation. Reviewing this FAQ would also be useful.
Toxics Rule
In the Clean Air Act Amendments of 1990, two general classes of pollutants were created. One classification is that of "criteria pollutants." This is a list of six pollutants that are allowed at certain concentrations. These are:
- Ozone
- Particulate matter
- Carbon monoxide
- Oxides of nitrogen
- Sulfur dioxide
- Lead
These are pollutants which have an accepted allowable background concentration. It is not technically or economically feasible to attempt to eliminate all traces of these pollutants from the environment, but, instead, we seek to control them to an acceptable, albeit low, level. The general standard mechanism for attacking these pollutants is what is called "best available control technology", or BACT, which allows some consideration of economics into the definition of "best".
Recommended Reading
More on these at this EPA page: Six Common Air Pollutants
The other set of pollutants are what are known as Hazardous Air Pollutants, or HAPs. This is a specific list of 187 chemical compounds, sometimes known simply as "toxics".
Recommended Reading
Here is the EPA site on this issue: Pollutants and Sources.
For these compounds, the law prescribes the use of "maximum available control technology", or MACT. This is sort of a zero-tolerance approach, meaning that emitters of these chemicals must use the most effective method of reducing the emissions, without consideration to the cost. For coal-burning power plants, the most important toxic pollutant is mercury. In April 2011, the EPA released a new toxics rule for coal-burning power plants.
Recommended Reading
The EPA has not yet released a simple summary of the rule, but a good summary has been put out by the Natural Resources Defense Council. Please read.
Clean Water Act Rules
Coal-fired power-plants burn the coal to boil water. The steam then drives turbines, which are connected to electricity generators not unlike the alternator in your car (except in scale!) The steam is then recycled back to the boiler, but in order to be pumped back to the boiler, it has to be condensed to liquid water, so as not to damage the water pumps. For this, power plants generally use rivers or streams as sources of cooling water. In the process of sucking hundreds of thousands of gallons per hour into the plants, a lot of fish get killed, either by impinging on the filter screens on the water intakes, or by being sucked through the screens and sent through the heat exchangers. Furthermore, the warming of rivers and streams by discharged power-plant cooling water can cause serious distress to marine life by upsetting their natural habitat.
Recommended Reading
In order to minimize the negative effects on marine life, the EPA is in the process of issuing rules under the authority of the Clean Water Act. The proposed rule is here. Please read.
Carbon Rules
In 2007, several states sued the EPA, demanding that the EPA regulate emissions of carbon dioxide under the authority of the Clean Air Act. This case went to the Supreme Court, which found for the states. Therefore, the Supreme Court of the United States ordered the EPA to issue regulations concerning the emissions of carbon dioxide, both from stationary sources (power plants, steel mills, and so on) and mobile sources - cars and trucks.
Recommended Reading
I should make it clear that the EPA did not, and does not want to regulate carbon under the Clean Air Act. This is not the appropriate law; it was not written with carbon in mind, and using it as a pathway to carbon regulation would be extremely burdensome on society. The EPA would like Congress to create a law written specifically for the purpose of addressing carbon emissions and their role in climate change. The House of Representatives passed such a law, the Waxman-Markey Bill in 2009, but many of the people who voted for this law were defeated in the 2010 mid-term elections, and it was never brought to the Senate for a vote. The bill died with the previous session of Congress. It is highly unlikely that Congress will address this issue any time in the foreseeable future. In the meantime, the EPA is attempting to follow the orders of the Supreme Court and regulate carbon emissions under the auspices of the Clean Air Act.
Recommended Reading
Once again, the clearest summary of the EPA rules can be found at the NRDC.
I will warn you that the NRDC is an unapologetic pro-environment group, and their writings will be in clear support of these environmental regulations. There are plenty of other public-policy advocacy organizations that take a different view, such as the Heritage Foundation, the American Enterprise Institute and the Cato Foundation. I do not wish to present any particular political point of view - I am an economist, not a political analyst - I only wish to give you the clearest explanation of these often cumbersome and legalistic rules, and that is often found at the NRDC site.
So, we have five current or proposed rules that will affect the operation of coal-fired power plants:
- The Air Transport Rule.
- The Coal Ash Rule.
- The Toxics Rule.
- The Clean Water Act impingement rule.
- The Carbon Rule.
This set of rules is viewed by many in the coal business as a "death of a thousand cuts". What will be the likely economic effects? There are two possibilities. The first is that a great many coal-fired power plants will retire, as they will not be able to afford the cost of installing all of the necessary equipment for scrubbing and controlling these emissions.
There are about 300 GW of coal-fired power plants in the US. There have been many analyses done, and it is very likely that between 20 GW and 80 GW of these plants will be forced out of business by 2015. This will "shorten up" the coal part of the stack, meaning that more of the time, power will have to be served by higher-priced gas units. This is akin to moving the supply curve to the left.
The second effect will be to raise the cost of coal-fired generation. By requiring more equipment, more permits, more scrubbers, and such, these plants will cost more to operate. This will raise up the coal part of the stack, making many of these plants more expensive than gas. This will have the effect of moving the supply curve upwards.
We should remember from Lesson 4 what this will do. We know that moving the supply curve to the left is functionally the same as moving it upwards. Moving the supply curve upwards results in a lower quantity of consumption, and at a higher price. I will also remind you about the notion of internalizing externalities: when we do this, we strive to include the "social costs" into the economic transaction, and effectively, what we are striving to do is to move the supply curve up, and to the left, so that we move from the "private" equilibrium to the socially optimal equilibrium.
That is the goal of these regulations: to internalize the external costs on the environment that come from burning coal. It remains to be seen whether the general public is willing to pay the price of this action, in the form of higher electricity costs.
Renewable Portfolio Standards
Reading Assignment
Please read this EIA page on renewable energy.
We can see from the pie chart in the previous section of this lesson that renewable energy supplies a small fraction of electricity in the United States. However, it would be very beneficial for us to increase the share of generation coming from renewables. The primary motivation is to reduce the amount of power generated by burning coal, which has a large number of negative side-effects as described in the previous section.
There are a few points that can be made from examining this graph.
- Despite peaking in 2007, coal has declined to about 24% in 2019.
- Natural gas share has grown by nearly 90% since the start of the shale gas boom in 2005, and has surpassed coal as the most popular generation fuel, 38% in 2019.
- Nuclear energy has been quite stable, as no new plants have been built since the 1980s (20% in 2019).
- The amount of energy generated by hydroelectric facilities is trending downwards as we remove more and more dams and return more rivers to their natural state.
- Petroleum use for power generation is rapidly trending towards zero as the price of crude oil climbs.
- After being flat for many years, renewable energy has grown considerably recently. Average annual growth over the past decade has been over 12%.
However, because it was starting from a very low point, even this impressive growth still means that renewables are responsible for 18% of all electricity generated in the US in 2019.
When we speak of renewable generation, we are speaking of the following things:
- Biomass, such as wood, wood waste, agricultural products, and black liquor from paper making;
- Biogenic municipal waste or, in other words, organic trash;
- Geothermal energy;
- Tidal and wave energy;
- Landfill gas, captured from the decay of garbage in dumps;
- Solar energy;
- Wind.
While hydro is a renewable energy, it is generally considered to be in a separate class. The vast majority of renewables installed in the US over the past five years are in the form of wind power. The great appeal of wind and solar power is that the marginal cost of operating these facilities is close to zero - the fuel is free and non-polluting.
So, why are we not having more of these forms of generation built, if it is basically "free energy"? There are three basic problems:
- Capital costs are very high.
- Resources are located far from people.
- Resources are not controllable.
Capital Costs
There is an abundance of wind and solar energy in our environment. Several academics have done studies and have discovered that the amount of solar energy hitting the planet is many, many times greater than the amount of electricity we consume. The same is true for the energy contained in the wind - it contains perhaps 50 times as much energy as the world consumes in electricity. The problem with all of this energy is that it is at a very low concentration - it is broadly spread out. The greatest benefits of uranium, oil, and coal are that they have a very high energy density - they pack a lot of punch from a small package. This makes them convenient to use - I can spend 10 minutes putting 20 gallons of diesel in my car and then be able to operate the car for 10 hours or more without refueling.
Wind and solar are very diffuse. To be concentrated up to levels that are useful for people to use, a lot of equipment taking up a lot of space is required. A nuclear power plant that generates 2,500 MW of power might sit on 1,000 acres, but to get the same power from windmills, we would need to put up about 1,000 separate windmills, each on occupying 40 acres of land, for a total of 40,000 acres. If I put 1,000 square feet of solar panels on my roof, it would generate about 10 kW, or about 1/25th the power generated by my car. So, for renewables to work on the sort of scale we need, we need to build a lot of them - many windmills or many solar panels.
The table below lists the approximate costs of constructing different types of power plant. These data were generated by the EIAS, and can be found at this link.
| Plant type | \$/kW |
|---|---|
| Coal-burning steam turbine | 3,500 |
| Gas-burning jet engine | 1,000 |
| Gas-burning combined cycle | 1,000 |
| Nuclear-powered steam turbine | 6,000 |
| Onshore wind turbine | 1,900 |
| Solar (photovoltaic panel) | 2,600 |
The costs above are given in units of dollars per kilowatt of capacity to generate electricity, meaning that all different sources can be compared on the same scale. As you can see, wind turbines cost more than gas-fired plants, and solar plants cost somewhere between gas-fired and nuclear plants. It should be pointed out that solar energy has seen declining capital costs over the past few years, as the cost of manufacturing solar photovoltaic cells have fallen significantly recently. In 2008, solar cost more than nuclear plants on a per kW basis. You may have read about the "Solyndra Scandal", whereby a US solar equipment manufacturer recently declared bankruptcy after receiving several hundred millions of dollars in federal subsidies. The bankruptcy of Solyndra was caused directly by the falling price of solar panels.
The aforementioned capital costs make it difficult for investors to earn a good return on such facilities. By selling power at normal market rates, these plants typically do not pay for themselves for many years. Thinking back to the opportunity cost concept, there is probably another place where a person can invest money that will give a better return. If you can invest money elsewhere and make more money with less risk, why would you build renewable power plants?
Resource Location
In the United States, large numbers of people tend to be gathered near the coasts, be they the Atlantic, Pacific, Great Lakes, or Gulf of Mexico. Unfortunately, this is not where most of the wind and solar are. The following two maps show the locations of the most reliable wind power and the most solar energy available. These maps were obtained from the website of the National Renewable Energy Laboratory, which is located in Golden, Colorado.
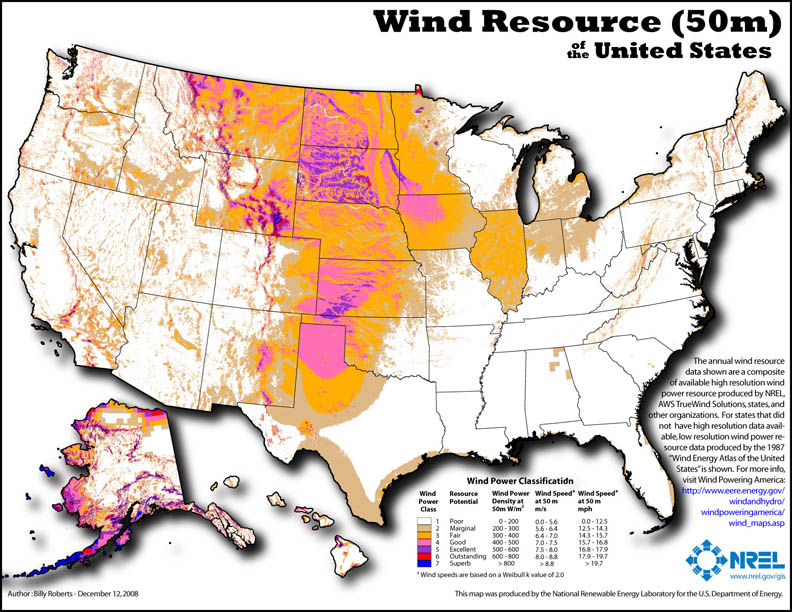
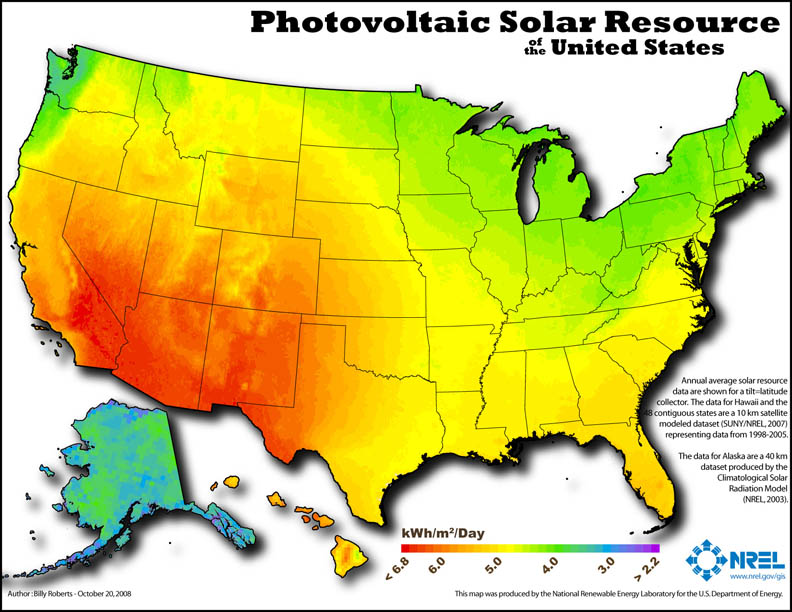
As can be seen, most of the best wind is in the Great Plains: the Dakotas, Iowa, Wyoming, Kansas, and Texas. For the most part, these are thinly populated places, far from most big cities. In fact, the only large cities that obtain a large share of their power from wind are Dallas/Fort Worth, Austin, and San Antonio, in Texas. Solar potential is largely concentrated in the southwest desert states and southern California. While there are certainly many people in California, it has proved difficult to build solar plants there, due to stringent environmental regulations.
If we wish to build lots of wind and solar in these thinly-populated places, we will have to build lots of transmission to move this power to population centers, and this is also a very expensive, bureaucratic, and politically difficult proposition. Just getting a few lines built in Texas has taken several years, with lots of wrangling over who pays for the transmission. Some people would like to see the cost of this transmission broadly socialized over as broad a population base as possible, whereas others would like the costs to be borne by people who stand to benefit directly, but it has proved difficult to figure out who benefits by how much, and then how to incentivize such people to purchase transmission strictly for renewable generation, especially when fossil-fuel generation is closer and does not need new transmission. This is a public goods problem.
Resource Reliability
One of the things we want from an electric system is controllability because this gives us reliability. When I turn on my TV, I expect there to be power for it, and when I do, the power company has to be ready to respond to generate that power to deliver to my house to serve my load. The same is true of everybody else. For this reason, electricity system operators need to be able to turn plants on and off as required by load. This is what is referred to in the industry as "dispatch". The problem with wind and solar is that they are not dispatchable - they cannot be turned on and off at will by power system operators. The wind blows when it blows, and clouds block the sun, and there is precious little that we can do about it. For this reason, we cannot have a system with too many renewables, because they cannot be reliably controlled, and if there are too many in a system, then the reliability of that system is difficult to maintain. And, as I said above, we value reliability in an electricity system above everything else.
The more renewables in an electricity system, the more fast-starting gas-fired backup generators are required. Once again, the issue arises: who gets to pay for these?
Another complicating factor: the wind tends to blow the most early in the morning hours, and mostly in the spring and fall. These happen to be times when the demand for electricity is at its lowest. If you can think of the super-hot dog days of summer, you realize that one of the defining characteristics is that the air is very still - no breezes to move the air around and cool us off. Thus, the wind is not there when we need it most and is there when we need it least. If we want to utilize the wind in a more reliable manner, we need to couple the wind with energy storage, which is another subject entirely, and a rather expensive one. At least, solar has the benefit of being present at times when we most need the power.
Incentivizing Renewable Energy
So, we like renewables because they are clean, domestically sourced, and have a very low marginal cost. But they are very expensive from a capital cost perspective, because we need a lot of equipment to concentrate the diffuse atmospheric energy up to a useful density, because we need to build expensive transmission lines from the remote sites of renewable generation to population centers, and because we need to build expensive backup generation or even more expensive energy storage to maintain the reliability we have grown accustomed to.
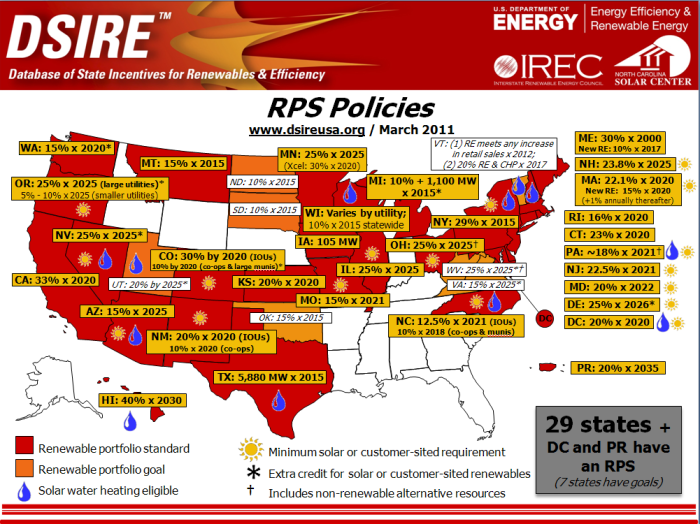
It's a wonder that any ever gets built! So, why is so much being built? Why is it growing at about 20% per year? Because of incentive programs. 29 states, plus the District of Columbia and Puerto Rico have incentives for the building of renewable generation. These programs are summarized on the following slide, from the Department of Energy's Database of State Incentives.
Recommended Reading
You can find much, much more detail of all of these programs at the DSIRE website.
The above slide displays states that have what is called a "renewable portfolio standard". What does this mean? It means that a certain portion of the power sold to end users in a state must come from renewable sources. This is how it works:
- A state government passes a rule saying that, for example, 25% of all electricity sold by a utility to end users must be from renewable sources.
- The government creates a device called a "renewable energy certificate", abbreviated "REC".
- When a company generates power from renewable sources, it is given a REC.
- When the company sells this power to a utility, it also sells the REC with the power - the utility has to buy the REC.
- The utility has to give the government a sum of RECs that is equivalent to 25% of the power they have sold. If they do not have enough RECs they have to pay a penalty, called an "alternate compliance payment (ACP)".
So, you can see the economics at work. Let's say that a utility has to pay \$600 per MWh in ACP for each REC they do not have, but which they need. Therefore, the utility is willing to pay up to \$600 for each MWh of RECs. So, the owner of renewable generation is given a REC by the government for each MWh of power he generates, and he is then able to sell it for some price that might be as high as \$600.
Now, an example: let's say I have spent about \$5,000 to install a 2 kW solar system on my roof. Where I live, in New Jersey, solar panels have an average capacity factor of about 14.5%, so my 2 kW system generates . Let's say I sell this electricity for the going rate - \$50 per MWh. So, I make \$125/year selling electricity. This is a pretty bad investment - I have spent \$5,000 to earn \$125 per year, or a return of about 2.5%.
But with a REC, instead of just earning the \$125 for selling electricity, I also get to sell 1.4 RECs for, say, \$550 each. Now I earn per year on my \$5,000 investment. That's a 18% rate of return - pretty good.
It also helps that the Federal Government gives me a tax credit that is worth 30% of the cost of the system, or \$1,500. So, in reality, I only paid \$3,500 after tax, and I am earning \$895 per year, for a return of 26%. which is a very good investment at any time. You can understand why I am looking at putting solar panels on my house!
The REC system has an appealing feature, in that as we get more renewables, there will be more RECs generated, and we know that as something becomes more available, the cost tends to drop - the supply curve is moving to the right. So, the more renewables, the lower the value of RECs, and the lower the incentive to build more renewables than the program is targeting.
Recommended Reading
For another overview of how RECs work, please see this site put together by the Union of Concerned Scientists.
The Future of Nuclear Power
Reading Assignment
For this section, please read the "Nuclear Explained" section at the EIA website.
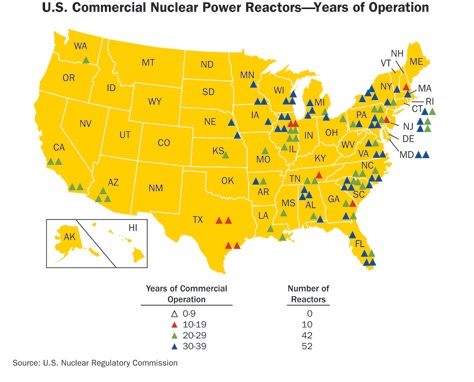
Nuclear power plays an important role in the nation's generation slate. There are 104 commercial nuclear reactors at 65 different sites in 31 states. These plants have a combined generation capability of about 100,000 MW. This is about 10% of the installed generation capacity in the country, but these plants provide about 20% of the electrical power consumed. This is due to the fact that these plants have very high capacity factors - collectively, about 90%. The capacity factor is the average hourly output as a fraction of the maximum possible output, so if a plant was running all of the time, its capacity factor would be 100%, if it ran half of the time, 50%, and so on. This number can be compared to coal generation, which has a capacity factor of about 67%, natural gas-fired plants at 26% and petroleum-fueled ones at 7%.
This 90% factor is more impressive when one considers that a reactor has to be taken out of service for about one month out of each 20 months in order to reload fuel into the reactor. This means that nuclear plants run about 95-97% of the time they are physically available. The result is that nuclear power plants provide lots of very reliable, low-cost, around-the-clock power and, as I have said several times, reliability is one of the most important attributes of the electrical system in the US.
Recommended Reading
Below is a map of the locations of all 104 reactors in the US. Please look at this list at the Nuclear Regulatory Commission website, with links to more information about each plant.
With population growing and the high probability that a lot of coal-fired generation will be taken out of service over the next ten years, there were expectations that we would see several new nuclear plants built by 2020. This is a bit of a turn-around from the line of thinking that was prevalent perhaps 10 years ago, when it was broadly assumed that the nuclear industry in the United States was basically dead, and that all of the existing plants would be retired upon the expiration of their original operating licenses, which were typically for periods of 25 to 40 years. Since all of the existing nuclear plants were built between 1969 and 1996, it was expected that the fleet would start shrinking in the 2000s, and be completely eliminated by 2040. This belief arose in the aftermath of two major nuclear accidents: the Three Mile Island accident in Harrisburg, PA in 1979, and the Chernobyl accident in the Soviet Union in 1986. After Three Mile Island, the construction, licensing and operations protocols in the United States became much stricter. About 60 plants that were planned in 1979 were subsequently cancelled. Construction at plants that were in the process of being built was slowed drastically, and inspections became much more stringent. No new plant was licensed for construction after 1979.
The Chernobyl accident, which was much more severe than the Three Mile Island accident, was, at the time, seen as the death knell for the nuclear industry in the US.
Recommended Reading
Good summaries of both accidents can be found at the following Wikipedia links. Please read if you are interested in learning more about these accidents.
It should be noted that Penn State has acquired a large collection of official documents, reports, photos and tapes concerning the Three Mile Island accident.
However, as we entered the 2000s, it began to be clear that retiring existing nuclear power plants would present some difficulties - primarily, that they would have to be replaced with similar quantities of generation. It was not clear what we would replace them with - coal was beginning to lose favor as the debate about climate change began to ramp up, gas was seen as a shrinking resource that was too valuable to use for making electricity, petroleum was getting to be too expensive, and nothing in the renewable area has the necessary scale to replace large volumes of reliable, dispatchable base-load power. Since Three Mile Island, the safety record of the US nuclear industry improved, and plants were being run at much higher capacity factors due to advances in management and engineering practices. Furthermore, most of the plants had been mostly or completely paid for. It began to make financial sense to avoid retiring these plants, and in the 2000s, the Nuclear Regulatory Commission began extending the operating licenses of existing facilities. The only plants that were retired were small ones that were too expensive to operate due to manpower requirements.
In the mid to late 2000s, there began to be talk of a "nuclear renaissance". For the first time in a quarter century, companies were beginning to talk about building new plants.
Recommended Reading
Given growing concerns about climate change, even many former enemies of nuclear power changed their position - please see this story from the Washington post.
Between 2007 and 2009, the NRC received license applications for 25 reactors at 15 sites from 13 companies.
However, almost all of these new applications are in doubt. The primary reason: economics. Nuclear power plants are expensive to build - estimates have run as high as \$7,500 per kW. For a new two-unit plant with 3,000 MW (or 3 million kilowatts) of generating capacity, that adds up to over \$22 billion. That is larger than the market value of almost every generating company in the US. Put another way, most companies would basically be betting the entire value of the company on successfully completing a new nuclear plant. Not surprisingly, a lot of CEOs are reluctant to take that bet. It should be noted that the \$7,500/kW figure is also hypothetical, derived from engineering estimates - there are no actual data to base it upon, because we have not built a new plant for so long. Most of the plants built in the 1970s and 1980s were plagued with massive cost over-runs, and there is no guarantee that this will not happen again. Several companies were bankrupted by the plants they tried to build in the first wave of nuclear, and the owners and managers of the generation companies all remember that.
Consider also that the construction and operating costs, while covered by the companies that own the plants, are not the only costs. For example, the amount of liability faced by a nuclear plant is limited by a law called the Price-Anderson Act. The plants collectively pay into an insurance fund to the tune of \$12 billion per year, but if an accident occurs and this insurance pool is depleted, the government picks up the rest of the tab. This law was passed in 1957 to incentivize the building of nuclear plants. It is highly unlikely that any plants would be able to obtain insurance without this act.
The other major cost relates to the disposal of spent nuclear fuel. The Federal Government has been trying to build a permanent deep-geological nuclear waste storage facility at Yucca Mountain in Nevada since 1978, but this project appears to be dead, despite expenditures of about \$20 billion of government money. There are no other plans in place, so spent nuclear fuel is currently stored at the power plants, where it is subject to the same levels of security as the reactor facilities. If and when a long-term solution is found, it will likely be paid for by the taxpayer, not the nuclear operators.
On March 11, 2011, a large earthquake off the coast of Japan triggered a tsunami that struck the Fukushima Dai-ichi power plant in Okuma, Japan. The plant, which was safely brought off-line when the earthquake struck, then lost all auxiliary power. This meant that the plant lost the ability to circulate cooling water through the reactors, which caused some of the cooling water to boil off, exposing radioactive nuclear fuel to the atmosphere and causing a major leak of radiation, the largest seen since the Chernobyl accident.
While the "nuclear renaissance" appeared to already be in rather ill health due to the aforementioned cost pressures, coupled with the expectation of low power prices for many years to come due to the new-found abundance of low-cost natural gas in the United States before Fukushima, it now appears to be all but dead. There are calls to revoke the licenses of many existing plants that share the same design as the Japanese plant. The governor of New York is demanding the retirement of the Indian Point reactors, 30 miles from New York City, their licenses expired in 2013 and 2015. After some negotiation, one of the two reactors eventaully permanently closed in early 2020 and the other is scheduled to be closed in 2021. In January 2010 the Vermont State Senate has refused to renew the state license of the Vermont Yankee plant in Vernon, VT, which was expiring in 2012. In early 2012 the owner of then power plant won a court case to veto the state decision and continued operations. However, the owner decided to close the plant due to the economic reasons in 2014. Anti-nuclear activists are again calling for the immediate retirement of the Diablo Canyon and San Onofre plants in California, both of which were built near the San Andreas Fault, which was the cause of several large earthquakes in California.
It remains to be seen what comes of these actions. The President and prominent politicians in both major parties have since reiterated their support for new and existing nuclear power. When looking forward, one must consider the economic factors. This is a classic case of trade-offs having to be made.
Retirement of existing power plants will likely have the following effects:
- Power will get more expensive, as nuclear power will be replaced by power that has a higher marginal cost - most likely, natural gas. This is another case of shifting the supply curve to the left, and we know that shifting an upwards-sloping supply curve to the left with a vertical (perfectly inelastic) demand curve will necessarily involve a higher equilibrium price.
- Electric grids will become less reliable, as the most reliable source of power will be replaced by plants that go off-line or require major maintenance much more frequently.
- Natural gas will get more expensive. Retiring nuclear plants will mean more gas will be burned to generate electricity. This will shift the demand curve for gas to the right, due to the substitution effect. This necessarily involves an increase in the equilibrium price, as was discussed in lesson 4. Since a large number of us burn natural gas to heat our homes, retiring nuclear plants will not only make our homes more expensive to power, it will also make them more expensive to heat.
For these reasons, I consider it unlikely that we will see any immediate retirements of nuclear plants, although I do consider it likely that agreements will be struck to close some of the more contentious plants in the next 5-10 years, with transition periods put in place to allow electrical system operators adapt to the changes in the structure of the market in their regions. But I have often been wrong about issues like this in the past.
Stay tuned...
Summary and Final Tasks
In this lesson, our final lesson of the course, we took a look at some of the issues facing one of the most important sources of energy used in our everyday lives, electricity. We examined the economic fundamentals behind various parts of the electricity value chain. We looked at the supply and demand aspects of the market. We then looked at some of the forces that are likely to shape the changes that are expected in this industry over the next ten years:
- The challenge to coal fired generation coming from a collection of new environmental regulations.
- The regulatory efforts to incentivize the creation and use of more renewable energy sources for electricity generation.
- The future of nuclear power in the wake of the recent Japanese nuclear accident.
If you log in to Canvas, you will find the task to be completed for this lesson: an online multiple choice quiz.
Have you completed everything?
You have reached the end of Lesson 12! Double check the list of requirements on the first page of this lesson to make sure you have completed all of the activities listed there.
Tell us about it!
If you have anything you'd like to comment on or add to the lesson materials, feel free to post your thoughts in the discussion forum in Canvas. For example, if there was a point that you had trouble understanding, ask about it.