
Reading Assignment
Read Chapter 9 (Pages 196-215). If you are using an earlier version of the text, read the chapter entitled "Price Takers and the Competitive Process", or, in much earlier versions, "The Firm Under Pure Competition." This is the chapter directly following "Costs and the Supply of Goods."
We have now defined the demand and supply curves and described where they "come from" and how they fit together, giving us a "market equilibrium," which is a combination of a price and quantity that we expect a market to move towards and stay at if there are no external disturbances. If we assume for a moment that we have a stable market that is at equilibrium, we will be able to take a look at how, and by how much, a market system improves wealth in a society. And remember, when I talk about wealth, I am not talking about money, but about the things that improve the quality of our lives. Money is merely a mechanism for interaction that allows us to exchange our labor and investments for goods that we derive utility from.
There are two reasons why we have trade in markets:
- People trying to maximize their utility
- Firms trying to maximize their profits, which increases what they can pay their owners, who can then convert these profits into utility-bearing goods to help maximize owner utility
A reminder: the demand curve is defined by the maximum amount a person is willing to pay for something, which equals the utility gained from consuming goods, which equals the wealth gained. (Wealth ≠ cash). An individual's maximum willingness to pay is sometimes called the "reservation price."
An Aside...
The law of one price. As mentioned above, we are going to assume that the market is in equilibrium. A follow on from this is that the amount of goods sold will equal Q* on the supply and demand diagram and that all of those goods will be priced at the equilibrium price, P*. That is, we are assuming that everybody pays the same price, P*. We call this the "law of one price," and it holds under our assumption of perfect competition. In real life, it is not always true, but as I have mentioned several times, it is a simplifying assumption that is not unreasonable and allows us to use a simple model to develop understanding. As we move through the course, this is one of the assumptions we will relax and look at the effects.
In a perfectly competitive market, we hold that an individual (a consumer, demander, or buyer) will freely enter into a market to exchange money for goods and that a firm (a producer, supplier, or seller) will take that cash in exchange for the good in question. In order for self-interested, non-coerced individuals and firms to enter into such a transaction, it must be in the self-interest of both, and by “in the self-interest,” we mean that each side will gain from the trade. The individual will exchange money for a good that gives him/her more utility than he/she gets from the money, and the firm will gain more money from the sale than it cost to make the good. Remember, people are utility maximizers (happiness maximizers), and firms are profit maximizers.
So, in a (theoretical, perfectly competitive) market, everybody gains something from participating in the market. In the real world, this still holds generally, although not universally, true: most people do not buy things they do not value, and most firms cannot continue to operate while losing money for very long.
The question we wish to ask now is, how much wealth (happiness + profits) is generated by a market? Well, before talking about wealth, let's quickly review the concepts of Consumer Surplus (CS) and Producer Surplus (PS).
A consumer’s net gain of wealth in a trade = maximum amount willing to pay – the purchase price.
(Remember, the maximum willingness to pay is the marginal utility obtained from consuming the good. A rational person will not pay more than the value he gets from the good.) Because we assume the law of one price, all consumers pay the same price, which happens to be the equilibrium price, P*.
Add this up for all buyers, and we have the total wealth created by the market for consumers. This is called Consumer Surplus.
The consumer surplus is the sum of the net wealth gain for each buyer in the market. If a buyer has a willingness to pay (henceforth referred to as WTP) \$10 and the price is \$7, then he has gained \$3 in wealth (\$10 - \$7). If a buyer has a WTP of \$7, he has just broken even (we might say that he is “indifferent” to making this purchase, as he has the same amount of utility whether he makes the trade or not.) If a buyer has a WTP of \$6.50, he would not willingly make the trade, because he is would be exchanging \$7 of money for \$6.50 worth of happiness, and nobody would rationally decrease their amount of happiness (given our assumptions of rational behavior and perfect information).
Note that WTP is the function defined as the demand curve.
So, the consumer surplus (we’ll call this CS to save typing time for me) for the entire market (all buyers added together) is the area between the demand curve and the equilibrium price, to the left of the equilibrium quantity, or the yellow shaded area in the following diagram:
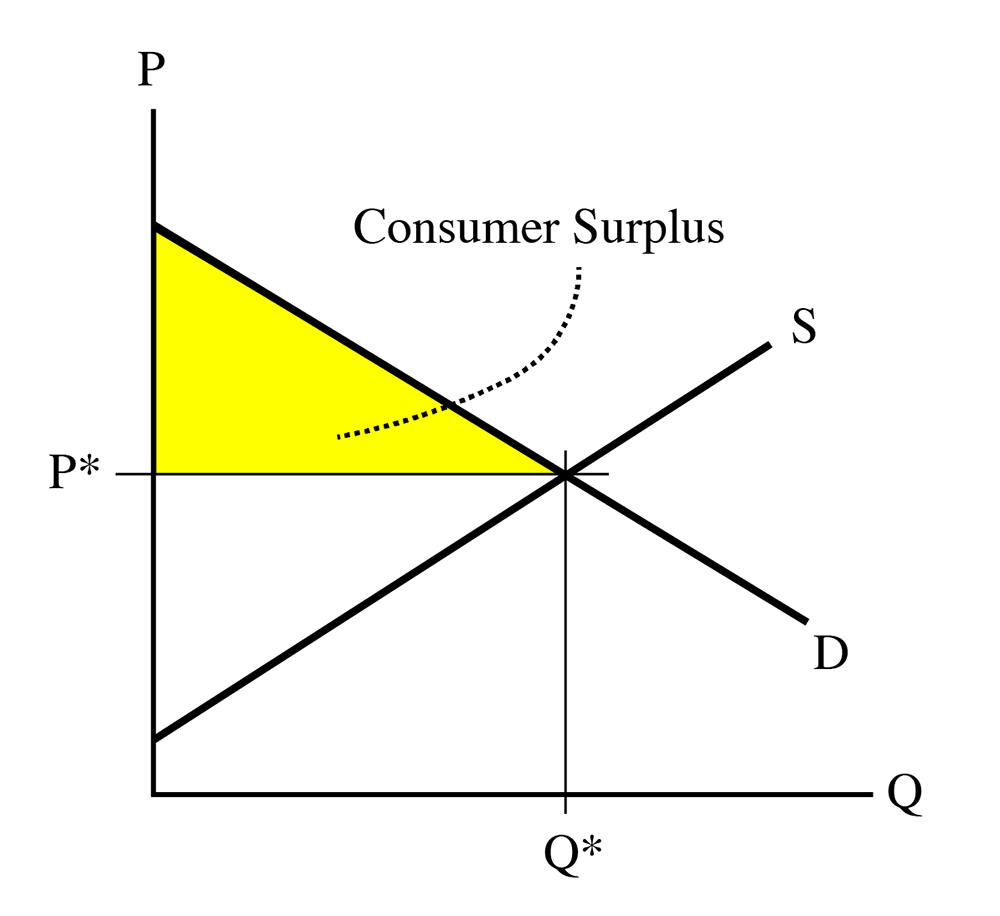
We do not have to worry about what happens to the right of the equilibrium quantity, Q*, because at this point, trades are not made, because the equilibrium price (a constant, and hence, a horizontal line) is above the willingness to pay (above the demand curve) to the right of the equilibrium point.
Now, let’s look at the supply side of the market. Remember our definition of the supply curve:
Supply curve = minimum amount a seller is willing to accept = marginal cost of producing a good.
A producer will not want to sell at below the marginal cost, because this will result in negative net revenue (, so , which equates to a LOSS!). So, any producer in the market will want to sell goods up to the point where price equals marginal cost.
Why? Because this is a profit-maximizing strategy.
Let’s spend a couple of minutes examining why this is. We can assume that we have an UPWARD SLOPING supply curve. In real life, supply curves are usually U-shaped, meaning that the marginal cost of the first few items is very high, then goes down to some minimum point, and then starts to slope upwards (that is, marginal cost will increase with the quantity produced.) Why would MC slope upwards? Because, as you start to add more resources to your production function (remember the previous lesson?), you will have to pay more to attract them away from some other use. There are some special cases where marginal cost is always sloping down – this is something called a natural monopoly that we will talk about later, and is quite common in some parts of the energy industry – but, for the time being, we can assume that near the equilibrium point, the supply curve will be upward sloping, which means that the marginal cost is increasing with increases in Q.
So, if , you are earning an accounting profit of , which is larger than 0. This means you will want to produce more of a good. As you produce more, it gets more expensive, because of the upward slope of the supply curve.
Let’s say we are producing at , with a marginal cost of . Given an equilibrium price P*, then Profit at . Now, we produce at , which means . Profit at , which is smaller than the profit at . The firm will want to keep producing more, and earning a positive but declining profit on each unit, up until we reach the point (call it unit “n”, or ) where . At this point, the accounting profit from marginal unit Qn is exactly zero. Every unit you have produced up to Qn has earned you a positive accounting profit, but now you have hit the point where , so .
As a producer, this is where you want to stop. If you make another unit, the marginal cost will be above the market equilibrium price, and you will make a negative profit (sometimes called a “loss” ) on the next unit. A rational actor will not want to make a loss, so he will prefer to stop at the point where .
This is what we call the “profit-maximizing condition”: profit is maximized when the quantity produced is sufficient to make . Make less than this quantity, and you are leaving money (and profit) on the table. Make more than this quantity, and you will be losing money on some items. In either case, making the quantity will give you the most amount of profit. Hence, the use of the term “profit-maximizing” condition.
I will point out here, again, that we are assuming a “Perfectly Competitive Market,” which is one in which there is perfect information, so every producer will know what his marginal costs are and what the market-clearing price, P*, will be. In real life, this is not true, and producers have to use their best judgment, intelligence, and experience to try to get as close to . But, for the time being, we can assume we have perfect information, just to make understanding of the basic concept a little simpler than real life.
A producer’s net gain of wealth in a trade for a single good = purchase price – minimum willingness to accept. This is the same as “equilibrium price minus marginal cost.”
To get the total profit generated from all goods sold in the market, add the “net gain” up for all goods from sellers, and we have the total wealth created by the market for producers. This is called Producer Surplus (PS).
The minimum willingness to accept (WTA) is defined as the marginal cost curve, which is also called the supply curve.
So, PS is the area between the equilibrium price and the supply curve:
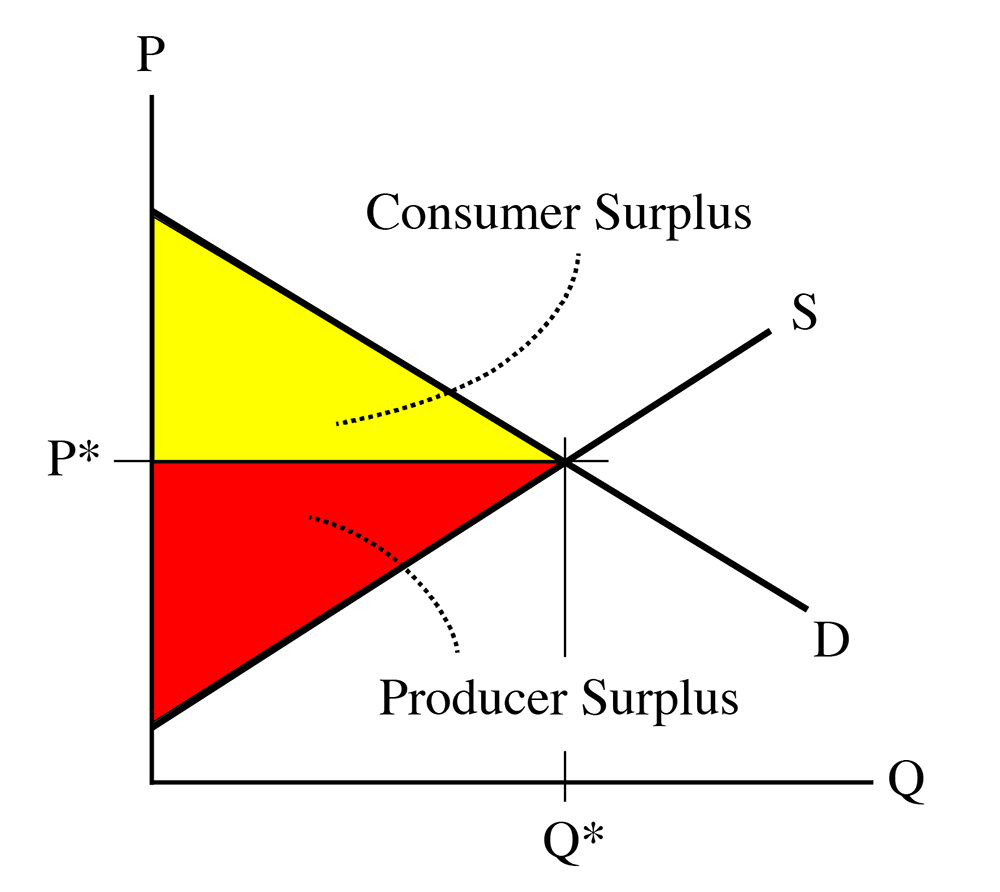
“The sum of consumer surplus and producer surplus is social surplus, also referred to as economic surplus or total surplus.” We also call it the total wealth created by a market.
The qualification about trade only taking place to the left of the equilibrium also applies here. No producer would want to sell to the right of the equilibrium, because the price received will be less than the marginal cost. And, also, the supply curve is above the demand curve, so the price demanded will be above the willingness to pay
The sum of the consumer surplus and the producer surplus is the total wealth created by a market.