
Now we have defined these two relationships: the demand curve, which defines the relationship between the maximum amount that somebody will pay for a certain quantity of goods, which is defined by the marginal utility derived from consuming that good, and the supply curve, which defines the relationship between the minimum amount that a firm is willing to accept for a certain quantity of goods, derived from the notion of marginal cost and declining marginal returns to a factor. For any given quantity of goods, these two curves define the limits of the price we expect to see for a good. The price should not be higher than the marginal utility, because a rational individual would not give away more utility (in the form of money) than the utility he or she would get from consuming the good. The price would not be below the marginal costs, because the firm would be losing money on production of the unit, and thus they would choose to not make the unit of the good in the first place.
So, we have a downward sloping demand curve and an upward sloping supply curve. Unless the supply curve is higher than the demand curve at the zero quantity, then the curves will intersect somewhere. In the case that the supply curve starts above the demand curve, this means that the cost of producing one good is higher than the highest amount of utility anybody gets from consuming that good, which is a trivial outcome: none of the good will be produced, and there will be no market for it. So, we can forget about this case (except and until the government gets involved...)
Below is an example of a supply and demand diagram:
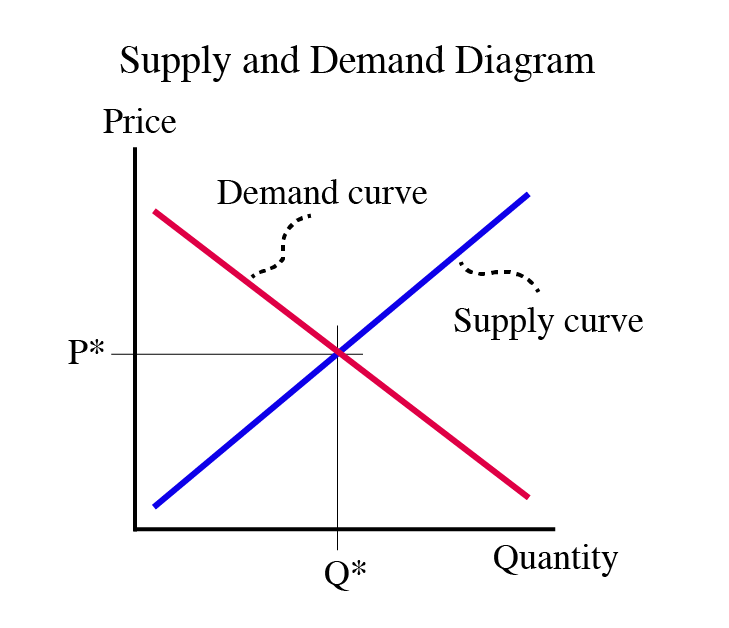
So, looking at Figure 4.1, the demand curve begins on the left, above the supply curve, and as quantity increases as the curves move to the right, they get closer and closer. Then they intersect. This intersection is the point where the utility of consumption of the marginal good is exactly the same as the cost of making it. If we go further to the right, the cost of production is higher than the utility of consumption. This means that for a quantity to the right of the intersection, nobody is willing to pay the full cost of production of the good, with the result that those goods will not be made.
The point where the supply and demand curves intersect is called the Market Equilibrium. An equilibrium is defined as some condition that is not prone to change from minor perturbances. If you drop a marble down the side of a salad bowl, the marble will settle at the bottom and will not move from the bottom unless there is a major disturbance. It is said to be in equilibrium. When a market is in equilibrium, it is not prone to change - it is at a "stable" amount of output at a "stable" price. Equilibrium is where we expect a market to be. Why? If the quantity of goods being produced is lower than the equilibrium quantity (if we are producing at the left of the equilibrium), then there are some people who are willing to pay more than the marginal cost of the good. This means that somebody can make a profit from making more of the good, so we expect production to increase until we hit the equilibrium point. If production is to the right of the equilibrium point, units are being made that nobody will buy, and firms will lose money on them. This incentivizes firms to make less of a good, once again driving the market towards equilibrium.
The equilibrium is not a number, but an ordered pair of numbers: a price and a quantity. We typically use the notation (Q*, P*) to describe an equilibrium. If I ask a question about a market equilibrium, and the answer is only a single number, it will be considered incomplete. An equilibrium consists of an equilibrium price, P*, and the quantity at which that price is observed, Q*. The equilibrium price is sometimes called the "market-clearing" price, meaning that it is the price where the market "clears" all of the goods in it: If the price is below the market clearing price, people will want to buy more, and more will be made. If the price is above the market-clearing price, more will want to be made by producers.
At any given point in time, we expect the market to be in equilibrium. Of course, a market, being the result of human wants, is always changing, and, in this context, you can think of the equilibrium as something that is always shifting, like a set of moving goalposts in a hockey game, but is something that the market is always striving to move towards. The equilibrium is like a magnet, always pulling the market towards it, but always moving, so the market is always chasing. We will talk more about these market dynamics in the next lesson.
Summarizing the supply and demand diagram:
- x-axis: measurement of quantity
- y-axis: measurement of price
- Demand curve: relationship between price and quantity people are willing to buy, derived from marginal utility of consumption
- Supply curve: relationship between price and quantity that firms are willing to sell, derived from marginal cost of production
- Intersection point of supply and demand curves: “market equilibrium”
Perfect Competition
Given all of the assumptions we have made to date, the market that is described above is what we call “perfect competition.” This does not exist in real life, but is a good starting place to study markets.
Perfect competition is based upon four assumptions:
- Nobody has market power. This means that nobody has the ability to change the market equilibrium price based on their own behavior. This means that there must be many buyers and many sellers. We also say “everybody is a price-taker,” which means that they must accept the market price, and they are not “price-setters.”
- Perfect information. This means two things – first, that everybody knows what their own choices are, and also that they know everything about the product.
- Product homogeneity. This means that in a specific market, all products are identical. In real life, no two things are identical, and people make “differentiation” between products. But, for purposes of modeling, we assume that certain groups of products are close enough to being the same.
- Free entry and exit. This means that people only make production and consumption decisions based upon their own free will. They are not forced to buy or sell things they do not want. It also means that people are not negatively affected by other people’s market decisions.
The closest we get to perfect competition is a large stock market like those in New York or London.
A perfectly competitive market gives the greatest possible wealth - we will show just how in the next lesson. Any market that fails to get this full amount is not perfect, and we say that we have a “market failure.” By “failure” we simply mean “not perfect.” All markets are in failure, but some more than others.
Many people wish to correct market failure, and to do this, they usually decide that government must act since no individual has enough power to correct the failures.
However, sometimes in their attempt to fix the problem, the government actually makes things worse (that is, they make the consumer and/or producer surplus even smaller). When this happens, we have what we call “government failure.” We have government failure when a government tries to fix a problem but only makes it worse. Even if the government has good intentions, it usually makes things worse.
Much of the rest of the course will look at deviations from this notion of perfectly competitive markets, that is, violations of one or more of our assumptions of perfect competition, and how these violations play out in real life. We will spend a lot of time looking at market failures, and ways in which we can deal with them, with a focus on how these things affect markets in the energy and resources spheres.
Take Aways
After working through the material on this page and reading the associated textbook content, you should be able to confidently:
- sketch out a supply and demand diagram, and identify the equilibrium;
- define and understand the four assumptions of “perfect competition”:
- nobody has market power
- perfect information
- product homogeneity
- free entry and exit
- understand the concepts of wealth maximization and market failure:
- when is wealth maximized?
- when is a market said to be in failure?