Lesson 5 - Market Power
Lesson 5 Overview
In the previous three lessons, we learned the fundamentals of supply and demand in the framework of perfect competition. In this lesson, we will begin to relax some of the assumptions of perfect competition, and see what happens in markets when some participants have what we call "market power." This will help explain what happens in some energy markets.
What will we learn?
By the end of this lesson, you should be able to:
- list and describe the assumptions that define "perfect competition;"
- understand and explain what is meant by the phrase "market power;"
- define "monopoly" and understand monopolistic behavior;
- show the differences between competitive and monopolistic equilibria;
- explain the effects of other types of market power;
- describe how we can measure market power;
- describe what a cartel is, and how it manages prices.
What is due for Lesson 5?
This lesson will take us one week to complete. Please refer to Canvas for specific time frames and due dates. There are a number of required activities in this lesson. The chart below provides an overview of those activities that must be submitted for this lesson. For assignment details, refer to the lesson page noted.
| Requirements | Submitting Your Work |
|---|---|
| Reading: (see lesson pages for exact assignments) | Not submitted |
Perfectly Competitive Markets
Reading Assignment
From Gwartney et al. please review the Chapter 9, "Price Takers and the Competitive Process."
From Greenlaw et al. please review the chapter 8,"Perfect Competition".
As mentioned earlier in the course, the kind of market we have been examining in the past few lessons, the simplified supply-and-demand diagram, and the underlying assumptions about rational utility maximization, supply being defined by marginal cost, and the law of one price, are all part of what we call "perfect competition.” As I have said, this is an idealization. It does not exist in real life, but is a good starting place to study markets.
When we talk about "perfect," we mean that this form of market gives the best possible outcome with respect to "aggregate wealth," which is just consumer surplus and producer surplus added together. There are many ways in which markets can generate less than optimal quantities of wealth - cost can be too high, people might not know certain information, costs can be borne by others, people can manipulate markets to charge a price that is either higher or lower than the market equilibrium, and so on. In real life, it is safe to say that there is no such thing as a perfect market; that, in every case, there is a distortion of some sort that adversely affects prices, quantities, or wealth. At this point, we will go over, once again, the four things that we assume for perfectly competitive markets to exist, and over the next few weeks we will look at what happens if one or more of these assumptions is violated.
If a market produces less than the optimal (maximum) amount of wealth, then we say we have "market failure." This sounds a bit extreme - anything less than perfection is called "failure." It's a good thing college isn't like this - anything less than 100% is a fail. So, we have to consider that there are "degrees" of market failure, just like there are degrees of success in a course. Getting 90% in a class is better than getting 40%. My car having a broken clock is a lot better than having a broken transmission, even though both represent some degree of "failure." So, when we think about market failure, we have to understand when it is serious, and thus needs some fixing, or when it is not, and trying to fix it will only make things worse.
So, let's go through the four assumptions of perfect competition, and their meanings.
Nobody Has Market Power
This means that nobody has the ability to change the market equilibrium price based on their own behavior. This means that there must be many buyers and many sellers. We also say “everybody is a price-taker,” which means that they must accept the market price, and they are not “price-setters.” When we say that "nobody has the ability to affect price based upon their own decisions," then each market entrant must be small compared to the size of the market in general, such that one consumer choosing to consume or not does not "meaningfully" change the market price based upon his/her decisions. As we have seen, a market is an aggregation of individual desires and actions, and, in theory, a change in the consumption habits of some part of the market will be reflected in the form of the market as a whole. In theory, me choosing to buy peaches instead of oranges at the grocery store will affect the markets for both peaches and oranges. However, since I am only one of several hundred people that buy fruit daily in that store, my consumption choices will have a very small, almost imperceptible, effect on the price of either good.
This is sometimes called "atomistic" competition, referencing the idea of elementary particles from physics. We, and everything around us, are composed of atomic particles, but the adding or changing of a few particles does not change us in a "meaningful" manner. So, to reiterate: "nobody has market power" means that everybody is a price-taker, not a price setter, and it means that there are so many individual buyers and sellers that the actions of one or a few will not meaningfully change the market equilibrium.
Perfect Information
This means two things – first, that everybody knows what their own choices are, and also that they know everything about the product. When we say "know your own choices," we mean that you are capable of knowing what amount of marginal utility you will receive from consuming a product, and you will also know the amount of marginal utility you will obtain from consuming every possible other consumption choice. This means that when you consume something, you will definitely be spending money on the thing that maximizes your utility.
Clearly, this is an unreasonable assumption. We do not spend every waking minute calculating the marginal utility of consumption. We can't, for several reasons. Firstly, the universe of choices is too large to consider every option. Secondly, some of your consumption choices take place in the future (that is, should I spend now or save my money and spend later?) We do not know the future. We do not know how much money we will have in the future; we do not know how our tastes and needs will change in the future. The final point is, it can be difficult to measure "happiness" from a consumption choice. Smoking a cigarette might make somebody happy today but very unhappy in a few years if he gets lung cancer. How can we calculate and assign values to such things? We can't.
A great deal of work on the frontiers of economics (the part that intersects with psychology) is about trying to figure out how and why we make choices. This is not something we can address here. That is fine - we are interested in studying what kind of market outcomes we have from the results of those choices, and trying to come up with some general observations, with a bit of predictive power, about how people behave in markets. If you are interested in this area of study, you might want to take a look at a field called "behavioral economics," which concerns itself with examining why people make choices that seem, on the surface, to be against their own best interests. Many people who study in this area claim that their findings undermine the axiomatic assumption about rational utility maximization, but I prefer to think that most "irrational" behavior can be tied back to imperfect information.
A second component of information is a bit simpler to understand: information about a product. That is, when we buy something, do we understand what we are getting? If I buy a Rolex watch, I expect something made in the Rolex factory in Switzerland, not something made in China. If I buy the Chinese Rolex, thinking that it is a Swiss one, I do not have perfect information. On a more mundane level, with reference to the law of one price, am I able to get the best price? For example, I recently moved to a new city. I like to send my shirts out to be laundered, mostly because I am very bad at ironing shirts. There are several dry cleaners near where I live, so how do I know that I am getting the best price? Well, I have to invest some time and effort into discovering the prices at each of these places. What if there is a place that I missed? What if a place does not have an informative website, or will not tell me their prices over the phone? These are all types of information market failure, some more serious than others.
Speaking of the supply side of the market, the most important type of information is cost information. This may seem like a simple idea - a firm can figure out what it's spending money on - but sometimes it can be very difficult figuring out the marginal cost - the cost of producing one more item. It can also be very difficult to make production function and investment choices: should a firm expand, or buy more machinery, or hire more staff? This can be difficult to assess because the alternate states of the world that they entail in the future are unknown.
Product Homogeneity
This means that in a specific market, all products are identical. In real life, no two things are identical, and people make “differentiation” between products. But, for purposes of modeling, we assume that certain groups of products are close enough to being the same.
In many industries, firms go to great efforts to differentiate their products from others. Some of the best examples are soft drinks, hair care products, and cars. The primary tool for product differentiation is advertising. The reason that firms do this is to be able to charge higher prices. For example, a four door car with a four cylinder engine may be an undifferentiated product, but if it is a four-door, four-cylinder car with a badge on the front that says "Toyota" or "Ford," then it is a differentiated product, and each of those manufacturers will try to charge more by convincing you that the name on the front has some extra value. This is another case where modeling consumer choice becomes a bit more difficult.
Free Entry and Exit
This means that people only make production and consumption decision based upon their own free will. They are not forced to buy or sell things they do not want. It also means that people are not negatively affected by other people’s market decisions. In situations where a private economic transaction negatively affects a person who is not a willing participant in that economic transaction, we have something called an "externality." This is a very important type of market failure, and one we will study at length in the next few weeks. The most important externality we will study is pollution, which is a major issue in energy markets and is the basis for the field of environmental economics.
Another aspect of free entry is that competitors can not put up "barriers to entry".
As mentioned above, there is no such thing as a perfectly competitive market. Probably the closest we get to perfect competition is a large stock market like those in New York or London. Think about why: there are usually many buyers and sellers, there is a lot of information about the value of a company behind the stock, a share of a company is identical to any other share of that company, and there are no externalities.
Reiteration
A perfectly competitive market gives the greatest possible wealth – the sum of consumer and producer surplus. Any market that fails to get this full amount is not perfect, and we say that we have a “market failure.” By “failure” we simply mean “not perfect.” All markets are in failure, but some more than others.
Many people wish to correct market failure, and to do this, they usually decide that government must act, since no individual has enough power to correct the failures.
However, sometimes, in their attempt to fix the problem, government actually makes things worse (that is, they make the consumer and/or producer surplus even smaller). When this happens we have what we call “government failure.” We have government failure when a government tries to fix a problem, but only makes it worse. Even if government has good intentions, it usually makes things worse.
In the next few sessions, we will talk about market failure and then move on to studying government failure.
Market Power and Monopoly
Reading Assignment
For this section, please read Chapter 11: "Price Searcher Markets with High Entry Barriers." from Gwartney et al.
From Greenlaw et al. chapter 9,"Monopoly".
Our first assumption is that of market power, which states that everybody is a price taker, or that there are many buyers and sellers in a market. In this case, the equilibrium price in a market is defined by so many different transactions that anybody who wishes to buy or sell in this market has to do so at the market equilibrium price, and they are not able to move the equilibrium price with their own actions. Hence, you have to "take" whatever the price is. If you are able to move the equilibrium price with your own choices, then you can be referred to as a "price-setter." In reality, in many situations, somebody in the market has some power to change prices through their individual actions. These include:
- Monopoly: only 1 seller.
- Duopoly: 2 sellers.
- Oligopoly: a few sellers.
- Monopsony: only 1 buyer.
Monopoly
This is the most extreme, but not the most common, example of market power. A monopoly is a market with only one seller. A monopolist is free to set prices or production quantities, but not both because he faces a downward-sloping demand curve. He cannot have a high price and a high quantity of sales – if he has a high price, people will buy less.
There are three ways that a monopoly can exist and/or persist:
- All of some resource is owned by some firm (e.g., deBeers and diamonds).
- The government allows a monopoly to exist (not common in the US, but in many countries things like airlines or railways are government-designated monopolies).
- A Natural Monopoly exists (e.g., your local power company). We will talk more about natural monopolies a bit later in the course.
At this point, you might think about some markets that have a dominant market share held by a single firm, such as Microsoft in the market for spreadsheet software. These are not monopolies, in that firms in these markets do have competitors, and consumers do have choices. If a firm obtains an inordinate market share due to offering a product that many people want to buy, we do not have a monopoly. Firms in a case such as this may have a lot of market power, and may face a lot of scrutiny from the government, but they are not technically monopolies.
Why is a monopoly bad?
Monopolies are typically assumed to be undesirable market structures. They are undesirable, or "bad," because in this case "bad” means less than the most possible total wealth – the sum of the producer and consumer surpluses. A market in which there is a monopoly will generate less wealth for a society than a competitive market would.
A monopoly leads to the following:
- A lower quantity of goods produced and consumed than in a competitive market.
- A higher price than the equilibrium price in a competitive market.
- A higher profit for the firm. In a monopoly, a firm will typically make greater than zero economic profit (remember that term?).
In a competitive market, it is the act of competition that drives prices towards the equilibrium price and quantity at which the marginal firm makes zero economic profits - they are earning just enough money to cover their costs of production and to pay their owners a return that is sufficient to cover their risks. If firms in an industry are making positive economic profits, then other firms have an incentive to enter the market to try and deliver these positive profits to their owners. Generally, this extra market entry is enough to increase production and decrease equilibrium price to the point where zero economic profits are seen. In a monopoly, these competitive pressures are absent. A firm is able to earn positive economic profits, and because they are a monopoly, other firms are unable to enter their market and drive down price.
This leads to an increase in the size of the producer surplus and a decrease in the size of the consumer surplus. As a disinterested economist, we might say "who cares?" especially if we are generating wealth. That is, should we care who gets the wealth, as long as wealth is being generated? That would be a "normative" statement. However, since we are concerned with maximizing the aggregate wealth of a society, we can ask the positive question "does a monopoly decrease total wealth generated?" If it does, then we have the definition of a market failure.
It is quite easy to answer this question with a supply and demand diagram. But first, consider how a monopoly works. We may have a single seller, and this seller may be able to choose his price, but he cannot control the demand curve. Remember, the demand curve is defined by the marginal utility of consumption, a measure of how much happiness the consumers get from consuming. So, the monopolist faces a demand curve he or she cannot change. So what a monopolist can do is choose just where the supply curve intersects the demand curve. He can choose any combination of price or quantity that exists along the demand curve. If he picks a high quantity, then he chooses a low price, or vice-versa. He cannot have a high price and high quantity. When I say "high" here, I am speaking in relationship to the competitive market equilibrium.
So, a monopoly producer will typically restrict output to some quantity below the market equilibrium. This is illustrated on the following supply and demand diagram, where refers to the quantity produced by the monopolist. To find out what price we see in this market, draw the line up from until it intersects the demand curve. This gives us the monopoly price, . These contrast to the "free-market" equilibrium, which I label as and in this diagram.
As you can see, since < , then has to be greater than , because the demand curve is downward-sloping.
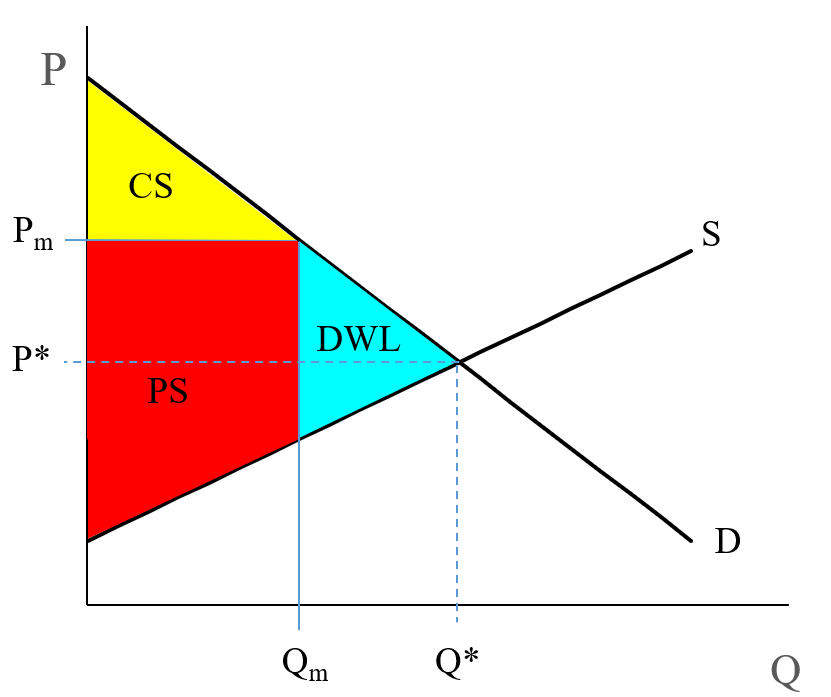
In a competitive market, wealth is the sum of the red, yellow, and blue areas. In the monopoly market, it is just the sum of the yellow and red areas. The blue area is wealth that is lost to society. This area is the Deadweight Loss. This labeled as "DWL" in Figure 5.1. This is the cost to a society of allowing a monopoly to operate. So, in a monopoly, the producer makes more, the consumer makes less, and the society, added together, is poorer as a result.
This is called a Social Cost: a cost to the total society.
Example
Demand is given by , Supply is given by . If the monopolist sets , what is the dead-weight loss?
Answer:
In order to find the dead-weight loss, we need to calculate the area of triangle bounded to the equilibrium point and monopolistic quantity (Qm).
Competitive market equilibrium is defined by the intersection of supply and demand, so if and . Then,
so,
.
Thus, .
If we substitute with 90 in either the supply or demand curve, then we get .
So, the equilibrium price and quantity .
The consumer surplus will be 720 x 90 x 0.5 = 32,400, and the producer surplus will be 8,100. (Why?) The total wealth generated by this market will be 40,500.
Now, how much wealth is lost if the producer can restrict output to 50?
Well, firstly, the monopoly price will be set by the demand curve, which is given by , which gives us 900 - 8*50 = 500. So, the monopoly equilibrium will be . The dead-weight loss is the triangle between the demand and supply curves and the vertical line Q = 50. The area of this triangle is 400 x 40 x 0.5 = 8,000. So, the dead-weight loss is 8,000, and the total wealth generated by this market is only 32,500. This is about 20% reduction in total aggregate wealth generated by the market. Note that consumer surplus has been reduced to 10,000 from 32,400, and producer surplus has been increased to 22,500 from 8,100. So, in this market, the producers earn 14,400 units more wealth, the consumers earn 22,400 units less, and the market generates 8,000 fewer units of wealth.
Where did this wealth go? It is the lost potential wealth from trades that would take place between Q = 50 and Q = 90. In this market, there are consumers whose willingness to pay is above the market equilibrium price, but they are unable to buy because the monopolist will not sell to them. Now, why on earth would a monopolist not want to sell something? Well, let's see why.
Profit Maximizing in a Monopoly
The goal of a firm is to maximize profits. So, if a firm is free to set whatever price (or quantity) they want, which level will maximize profits?
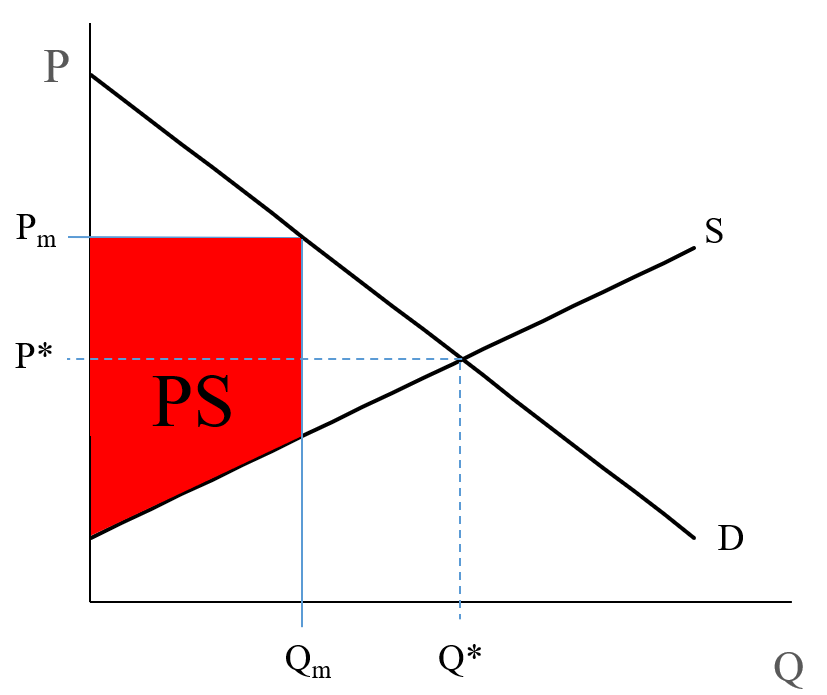
Profit (producer surplus) is the area below the equilibrium price and above the supply curve. The supply curve is the same thing as the Marginal Cost curve for the firm.
(Note: in Figure 5.2, I use and to represent “monopoly equilibrium quantity” and “monopoly equilibrium price.")
At which value of is the producer surplus (the profit, the red area) the largest?
Answer: it is maximized when supply = MC = MR (Marginal Revenue).
What is marginal revenue? Well, it is the amount of money a firm takes in from selling one more unit of the good. If the price is constant, then MR = price - selling one more unit means we collect one more times the price. But, in this case, since the monopolist faces a downward sloping demand curve, each additional unit he sells will have a lower price, and he will sell every unit at that lower price. As an example, using the demand curve in the previous numerical example, if the monopolist sets , then he sells 50 units at a price of 500, and has total revenue of 500 x 50 = 25,000. If he makes one more unit, he sells 51 units at a price of 492 (price is derived from the demand curve, 900-8*51=492), for a revenue of 25,095. His marginal revenue from making one more unit is 95, even though the price is 492.
So, we need to plot the marginal revenue curve.
It turns out that the marginal revenue curve is a line that has the same y-intercept as the demand curve, but has a slope that is twice as steep. So, for example, if our demand curve is given as , then 100 is the intercept and -1 is the slope (remember the equation of a line; . In our case, , which is another way of writing .
So, the marginal revenue curve has the same intercept, 100, but is twice as steep, with a slope of -2.
This is written as:
An Aside...
Here is a small aside, which is not obligatory and not something you will be quizzed on. If you know calculus, you will be able to understand the following calculus-based explanation of why the monopolist sets his quantity to be that where MR = MC, and how we derive .
A monopolist wants to maximize profit, and profit = total revenue - total costs.
We can write this as . In calculus, to find a maximum, we take the first derivative and set it to zero:
Profit is maximized when
= marginal revenue and = marginal cost
So, is the same as , which is the same as MR = MC.
To find MR: .
If the demand curve is given by then
So,
So, the MR curve has the same intercept as the demand curve, but its slope is exactly double that of the demand curve.
Generally, if a Demand curve is given as , then .
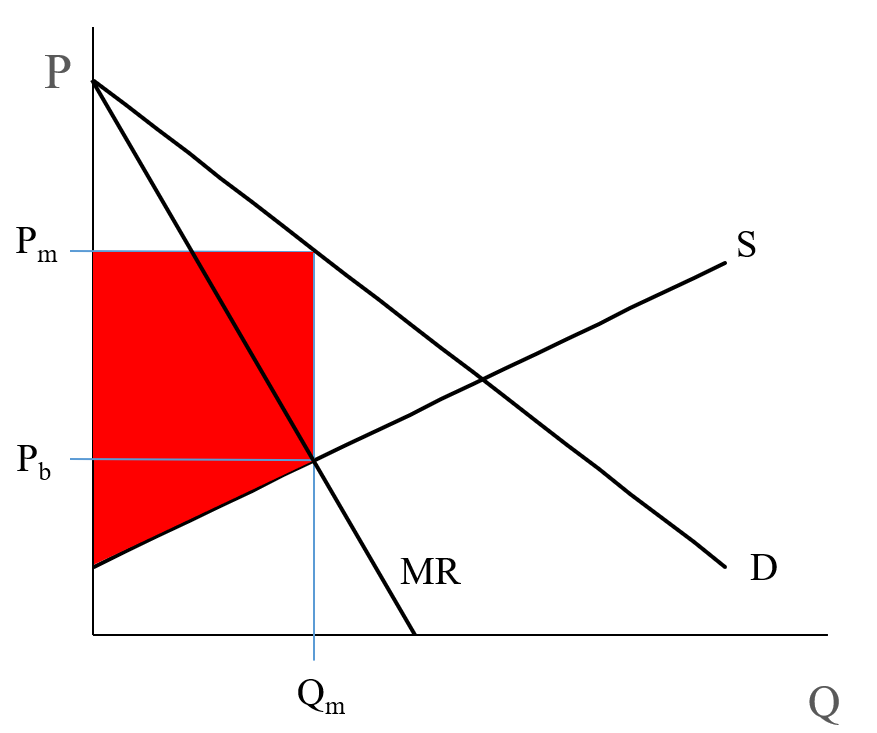
In Figure 5.3, the MR curve is shown in blue. To find the profit maximizing point, set to the amount where the MR and MC curves intersect. These will be sold at price . Any other quantity will give a smaller profit (the red area on the graph).
So, it is important to remember two things:
- The marginal revenue (MR) is a line with the same intercept as the demand curve, but with a slope twice as steep; and
- When , profit is maximized.
We say that in a monopoly, profit is maximized when , just like in a competitive market, when MR = Price = MC. You will remember that in a competitive market, the demand curve is flat. Its slope is zero. So, the derivative of this curve, which is the MR curve, also has a slope of zero (two times zero = zero). So the result that P(max) occurs when MR = MC is true not just in a monopoly, but all markets.
Example
The demand curve is given as: .
The supply curve is given as: .
- What is the profit-maximizing (monopoly) equilibrium?
- Find the Consumer Surplus and Producer Surplus
- What is the dead-weight loss?
Answers:
-
In order to answer this question, first, we need to find the monopoly equilibrium. To do so, first, we have to solve the MR = MC for the Q. MC is the supply function, and we learned that if demand curve is given as , then
So, MR equation will be .And will be set by the demand curve:
-
Consumer surplus equals the area of the under the demand curve and monopoly price , horizontal line.
Coordinates of three corners of this triangle will be:
Top left: (0, demand curve intercept) = (0, 140)
Bottom left:
Right corner:Producer surplus equals the area of the under the monopoly price and above the supply curve (red area), which equals the area of the trapezoid.
Coordinates of four corners of this trapezoid are:
Top left: (0, Pm) = (0, 100)
Bottom left: (0, supply curve intercept) = (0, 20)
Top right:
Bottom right:Note that coordinate of bottom right corner of the trapezoid (MR and supply curve intersection) can be found by plugging the Qm in the supply curve,
And the area of the trapezoid will be:
-
The dead-weight loss is the triangle between the demand and supply curves (competitive market equilibrium) and the vertical line Qm. So, first, we need to find the competitive market equilibrium:
Demand curve: .
Supply curve: .At the competitive market equilibrium: demand = supply
140 – 2Q = 20 + 2Q
Q* = 30
P* = 140 – 2*30 = 80Coordinates of three corners of this triangle will be:
Top left: , which is (20, 100)
Bottom left: = (20, 60)
Right: = (30, 80)Now that we have the coordinates of three corners, we should be able to find the area of the triangle as:
Dead-weight loss
Note that dead-weight loss can also be calculated by deducting the monopoly market total wealth (CS + PS) from competitive market total wealth.
Your turn!
Practice Exercise
Assume In a hypothetical market demand and supply functions for a good are
Demand:
Supply:
- Calculate the competitive market equilibrium, consumer surplus, producer surplus, and total wealth created by the market.
- Calculate the monopoly Price and quantity, consumer surplus, producer surplus, and total wealth.
- Caclulate the dead-weight loss of the monopoly.
Calculate the dead-weight loss using this method and compare your answer with what we calculated. You should have similar results.
Try and work it through and see if you can get these answers.
Take Aways
After this lesson and the associated readings, you should be able to:
- define and understand the meaning of “market power;”
- know the names of markets with:
- one seller,
- two sellers,
- a few sellers,
- one buyer;
- understand why a monopolist can set price or quantity, but not both;
- describe the three ways a monopoly can come into existence;
- explain the effects of a monopoly on price and quantity compared to a free market;
- understand what happens to consumer and producer surplus in a monopoly;
- understand the concept of a “dead-weight loss” and a “social cost;”
- understand and apply the rule for profit maximization in a monopoly;
- find the marginal revenue curve:
- the intercept of the marginal revenue curve,
- the slope of the marginal revenue curve;
- find the monopoly equilibrium and compare it to the competitive equilibrium.
Other Forms of Market Power
Single buyer = Monopsony
In this case, a buyer has market power and tries to maximize the consumer surplus, not the producer surplus. We essentially have a monopoly in reverse, and consumer surplus is maximized by the consumer's choice of quantity purchased. Instead of looking at the producer's marginal revenue function to define the monopoly quantity and price, we instead look at the consumer's "marginal expenditure," the amount of money he has to spend to obtain one more unit of a good, which changes with his purchase decision. Once again, we have a quantity that is less than the free-market equilibrium, but in this case a price that is lower than the free market equilibrium. This is described in the following diagram:
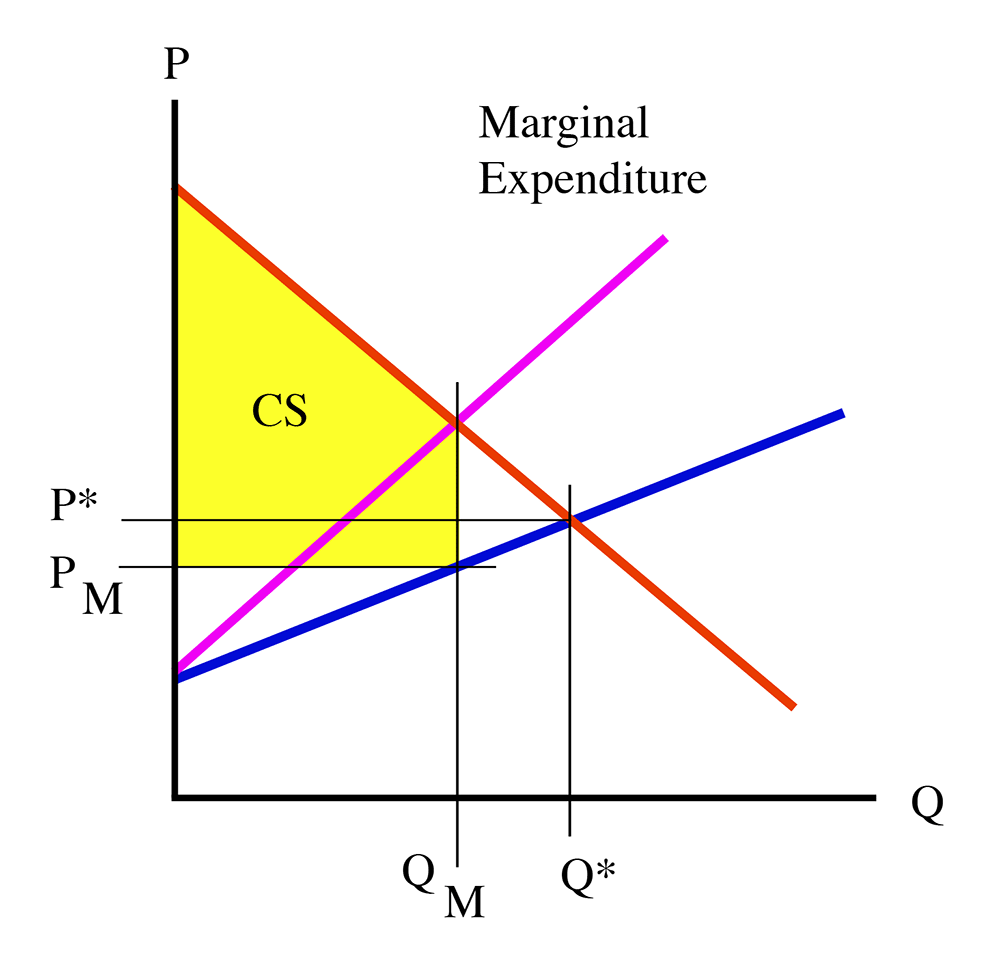
As you can see in Figure 5.4, the “Marginal Expenditure” line has the same intercept as the marginal cost line, but double the slope.
Monopoly-Monopsony
It is possible to have a situation where there is only one buyer and one seller. In this case, the quantity sold and the price will be a function of the negotiation between the trading partners.
Duopoly
This is the case where we have two sellers. Without getting into the mathematical details, we discover that the price is lower than the monopoly price, but higher than the competitive price. The quantity is also between the two. The best outcome for the two firms would be to share the monopoly profits between them; but each side has an incentive to cheat, which results in a different equilibrium. Incentives to cheat in a collusive environment are described in Chapter 11 of the text.
Oligopoly
In this case, we are adding a few more sellers. As we add more sellers, the equilibrium moves along the demand curve towards the competitive equilibrium, as in the following diagram:
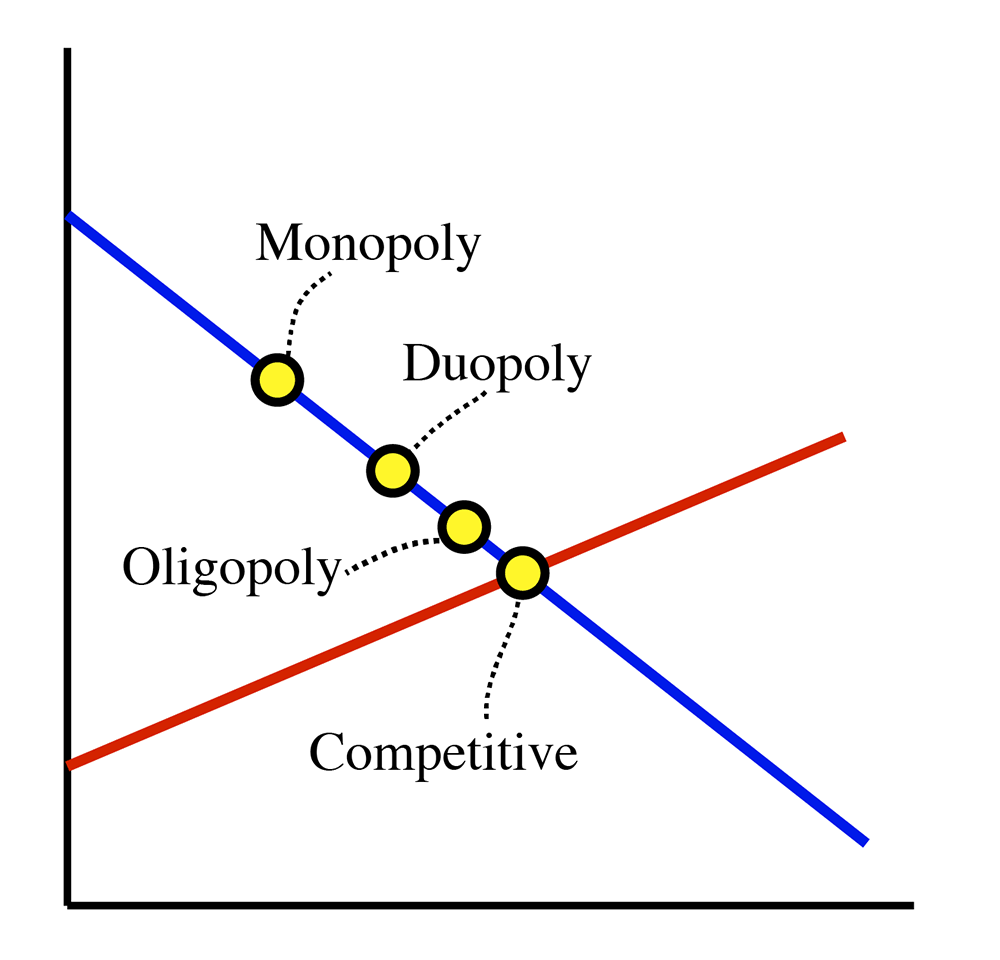
The obvious conclusion is that the more firms in a market, the closer we get to the competitive (wealth-maximizing) solution. This is why governments generally try to stop monopolies and break market power.
Take Aways
After this lesson and the associated readings, you should be able to:
- define an equilibrium in a monopsony;
- compare a duopoly equilibrium to monopoly and competitive equilibria;
- understand how an oligopoly equilibrium compares to monopoly and competitive equilibria;
- understand what happens to the equilibrium as we add more firms.
Price Discrimination
Reading Assignment
Please read the section on Price Discrimination in Chapter 10, "Price-Searcher Markets with Low Entry Barriers." In the most recent version of the book, this is on pages 198-200.
Because we have a deadweight loss in a monopoly, some social wealth is not collected. This means that a society is poorer, in total, because of the existence of a monopoly. But it is possible for a producer to capture some of this lost wealth. This can be done by using price discrimination. Price discrimination refers to charging different prices to different customers. In a perfectly competitive market, this is not possible, because there are many firms competing for the price; but it is possible in a monopoly, because people have no other place to buy.
If the seller is able to discover just what price the buyer is willing to pay (what the buyer’s Reservation Price is), and offer a price incrementally below the reservation price, then the seller is capturing basically all of the total surplus.
There are three general ways in which price discrimination can occur:
- First degree (or perfect) price discrimination refers to charging a different price to every consumer. This is not very possible in real life.
- Second degree price discrimination refers to charging different amounts for different sized purchases. If a car rental company buys 300 cars from a dealer, they will get a better price than if I go and try to buy 1 car. This is known as bulk pricing.
- Third degree price discrimination refers to breaking up the market into different groups who have different demand curves and maximizing profit in each different market sub-group. For example, a restaurant might have a special children’s menu, with small portions at lower prices. Adults would not want to buy these small portions, but forcing adults to buy adult portions for children might make the customers decide to stay home.
Example
The Philadelphia Zoo discovers that they have two groups of customers with two different demand curves. Locals have demand , and tourists have demand . What is the profit maximizing set of prices? (The marginal cost of visitors is zero.)
Solution:
In this case, we have two separate demand curves, and as a monopolist we wish to maximize profit by charging each separate part of the market a separate, monopolistic price.
For locals, demand is given as , so .
- Since , then setting gives us , or .
- Entering into the demand curve gives us
For tourists, demand is given as , so .
- Since , then setting gives us , or .
- Entering into the demand curve gives us
So, the answer is, if it wishes to maximize profits, the zoo should charge locals \$20 for admission, and \$25 to tourists. Of course, in this case, the trick involves being able to effectively separate locals and tourists.
Take Aways
After this lesson and the associated readings, you should be able to:
- explain what first-degree price discrimination is;
- explain what second-degree price discrimination is;
- explain what third-degree price discrimination is.
Measuring Market Power
Herfindahl - Hirschman Index (HHI)
Governments are interested in controlling market power, and to do this they need a way of measuring it. The most common tool is called the Herfindahl - Hirschman Index (HHI)
This is the sum of the squares of each firm’s market share, expressed in percentage terms:
where Si is the market share of firm i in percentage. Market share can be calculated as firm's sale divided by total market sale.
So, if we have one firm in an industry, the HHI will be 10,000, and if we have an infinite number of tiny firms, it will approach zero.
Example
Say we have an industry with four firms. They have market shares of 40%, 30%, 20% and 10% respectively. What is the HHI?
HHI =
Now, what happens if the largest firm buys out the third largest firm?
Now, we have three firms with the following market shares: 60%, 30% and 10%.
So, the HHI . The concentration has increased by over 50%.
- If the HHI is less than 1000, a market is generally considered to be not concentrated.
- If the HHI is between 1000 and 1800, a market is thought to be “moderately concentrated.”
- If the HHI is above 1,800, the industry is considered to be highly concentrated.
In the third case, governments will often act to reduce concentration. This is called an “anti-trust” action.
Cartels
A cartel is a form of market power in which suppliers collude with each other to manipulate supply. The most famous cartel in the world is OPEC, the Organization of Petroleum Exporting Countries. It turns out that crude oil is found in many countries in the world. In fact, there are probably oil wells in pretty much every country in the world. But there are a few countries that have large supplies of oil that is relatively cheap to produce.
The history of the international oil industry is convoluted and full of lots of stories about power, colonialism, and nationalism. The oil in many parts of the world was controlled for about half a century by a group of American and European companies called the "Seven Sisters." The countries in which the oil was found resented this control, as they believed that the price was being kept artificially low to benefit the consuming, and not producing countries. Several of these countries banded together to take control of their own resources and formed the organization we know as OPEC.
As I mentioned, there is a lot of fascinating history in the oil industry and OPEC. If you have more interest, I suggest you look at the Wikipedia page for OPEC for a quick overview, and if you are interested in investing a little more time, I recommend reading the book "The Prize" by Daniel Yergin. However, this is an economics course, and I want to focus on the economics of cartels.
OPEC is able to act somewhat like a monopolist, even though the oil industry is not a monopoly. OPEC countries produce about 30% of the world's oil. However, they produce a lot of low cost oil, so they are able to effectively control the supply curve and where it intersects the demand curve by restricting their output. This is shown in Figure 5.6 below.
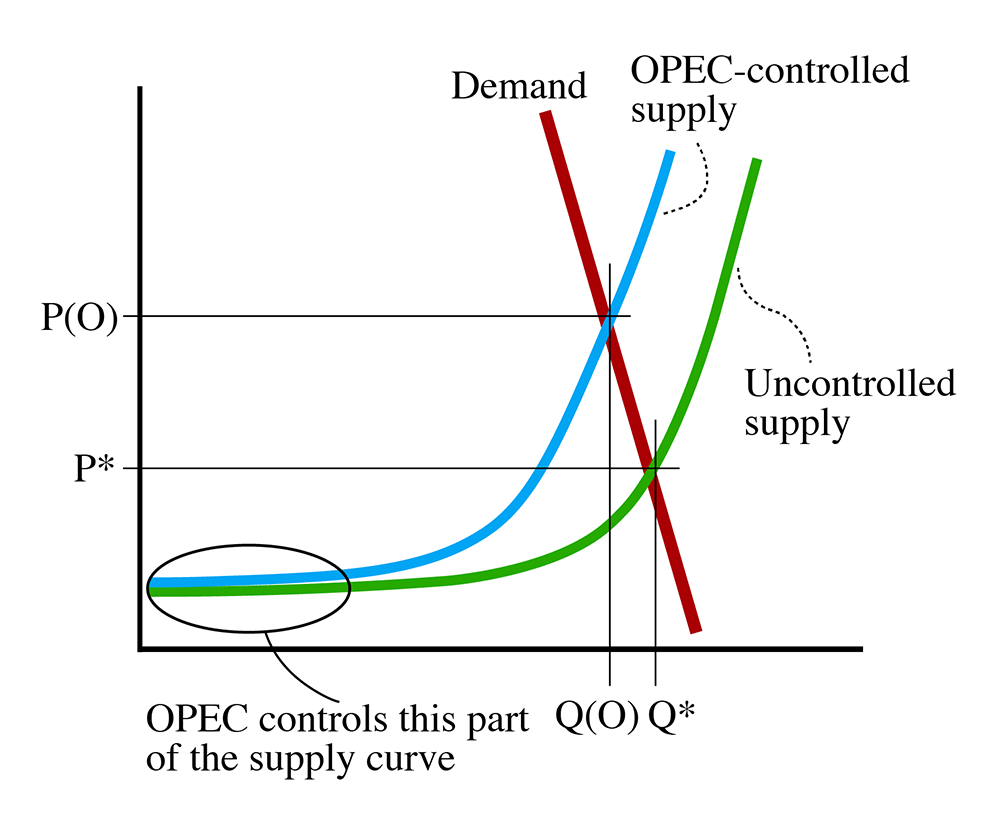
As mentioned in Figure 5.6, OPEC controls the "low cost" part of the supply curve. By exercising control and reducing output from where it would be in an uncontrolled, competitive market, they are able to shift the equilibrium from the competitive point (P*, Q*) to what I call the "OPEC" point: (P(O), Q(O)), which gives us a price that is higher than the competitive market price.
I should make it clear that OPEC is not trying to maximize the price in the short run. Since the elasticity of demand for oil is quite steep in the short run, OPEC could raise the price quite a bit more with slightly lower production. However, such actions are likely to be damaging to the OPEC nations in the longer run: it will cause recession, which hurts long-term demand, but, more importantly, having a very high oil price will incentivize the development of alternative energy sources, which means that oil would then have substitutes, and its demand elasticity would not be as steep. OPEC would not, then, be able to control the price as much.
Instead, OPEC is playing a bit of a game, whereby they are trying to find the price that is as high as possible without spurring the development of alternatives. OPEC tries to "stage-manage" the price of oil to provide the long-term maximum profit.
It should be said that cartels are difficult to hold together. The principal reasons are as follows:
- As the number of member firms (or nations) increases, it is increasingly difficult for collusion to be effective - members all have an incentive to "cheat" on the cartel by producing "a little bit" more and earning a little bit more money. But if everybody cheats a little bit, the supply increases and prices get lowered, and we move closer towards a competitive market. This has happened a lot in OPEC, and it is periodically controlled by having Saudi Arabia open up the taps for a while to lower the price in order to get the message to other OPEC nations that they can punish cheating. This brings us to the second point:
- When it is difficult to detect cheating, it is hard for collusion in a cartel to hold. OPEC nations do not allow other nations, even other OPEC nations to independently verify what their production levels are. This is very different from western nations like the US, Canada, and Britain, where the volume of petroleum production is reported by private and public firms to the government, and these figures are collected and reported by the government. Because nobody is able to independently measure and police production quotas, there is a lot of cheating.
- The third point is that low barriers to entry - we will talk more about barriers to entry in the next lesson - make it difficult to control price. In the oil business, the barrier to entry is the presence of oil in a country. If there is oil in a country, that country can produce and sell the oil relatively easily, and it turns out that many, many countries have at least some oil. The OPEC nations have a big slice, but when OPEC drives up prices by successfully restraining production, every other country has an incentive to look for oil, and frequently find it. This increases production globally and tends to lower prices. High oil prices also provide incentives for the development of other forms of energy - the substitution effect - and the last thing that OPEC wants is for oil to become obsolete because somebody figures out a better, cheaper way to power our cars and planes. We used to burn a lot of oil to generate electricity and heat homes, but we do very little of that now because there are cheaper alternatives, and we are getting closer to the point where we have alternatives for powering our vehicles. We will talk a lot more about this topic in the last lesson or two of this course.
These are the main reasons why cartels like OPEC are difficult to maintain. Please read the full list on pages 248-249 in Chapter 11.
Summary and Final Tasks
In this lesson, we took a closer look at the assumptions we make in our model of perfectly competitive markets. However, in real life, no markets are perfectly competitive - at least one of our assumptions will be violated. This results in "market failure," a situation where the market fails to generate the maximum theoretical amount of wealth.
We took a close look at the failure of the first assumption, that concerning market power. We looked at how firms that have market power can behave in ways that increase their profits, and how this behavior affects market equilibria. We looked at outcomes for various types and degrees of market power, and we looked at a couple of tools that government has to try and measure just how concentrated a market is.
Have you completed everything?
You have reached the end of Lesson 5! Double check the list of requirements on the first page of this lesson to make sure you have completed all of the activities listed there.