“Non-renewable” energy sources (such as Oil and Petroleum Products, Natural Gas, Natural Gas Liquid, Coal, and Nuclear), as well as “renewable” energy and “alternative fuels” (such as Hydro, Solar, Wind, Geothermal, Biomass, and Biofuels), help to satisfy the nation’s energy needs. Fossil fuels and nuclear power are considered non-renewable sources of energy. Coal and natural gas play large roles in the generation of electricity as well as in industrial processes such as the manufacturing of steel. Hydro, solar, wind, biomass, biofuels, and geothermal are all considered “renewable” forms of energy and comprise varying levels of supply in this country. They are classified as renewables since their source is seen as being virtually unlimited. Of these, solar, wind, biomass, biodiesel, and geothermal are all considered “alternative” energy sources since they are not the “traditional” kind (fossil fuels, nuclear, and hydro).
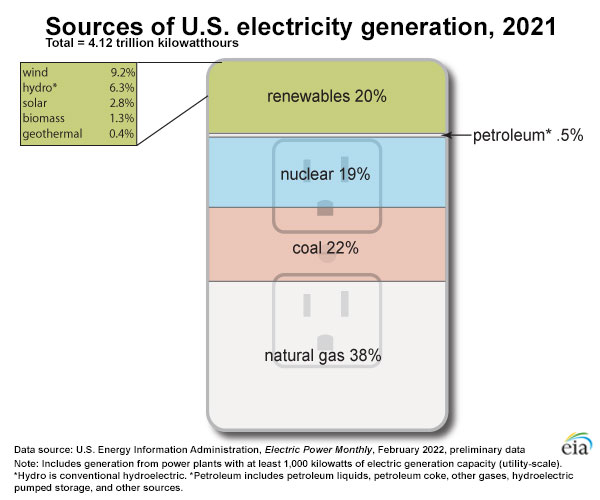
The following chart is from EIA reported data and shows major energy sources and percent shares of U.S. electricity generation at utility-scale facilities in 2021. Please note that in 2021 natural gas has the largest share (38%) in U.S. electricity generation, coal is in the second place (22%), and nuclear has the third place (19%). As shown in Figure 1, renewable energy sources contribute to about 20% of the U.S. electricity production at utility-scale facilities as of 2021, with about 9.2% wind power and 6.3% hydro. Please note that 2019 was the first year that wind power surpass the hydro. Other renewable sources such as solar, biomass and geothermal have a minor share.
U.S. Electricity Generation in 2019
Total = 4.009 trillion kilowatthours (kWh)
-
Natural Gas: 40%
-
Nuclear: 20%
-
Coal: 19%
-
Renewables: 20%
The renewables are broken down as follows:
-
Wind: 8.4%
-
Hydropower: 7.3%
-
Solar: 2.3%
-
Biomass: 1.4%
-
Geothermal: 0.4%
Figure 2 below shows the break-out of fuel sources used in the generation of electricity. As you can see, the single largest fuel has been coal in the past decades, although this is changing as historically low natural gas prices during 2010-2020 caused some “fuel switching.” This was followed by natural gas, nuclear, and renewable energy sources. This final category is comprised of energy sources such as wind, solar, hydroelectric, biomass, and geothermal.
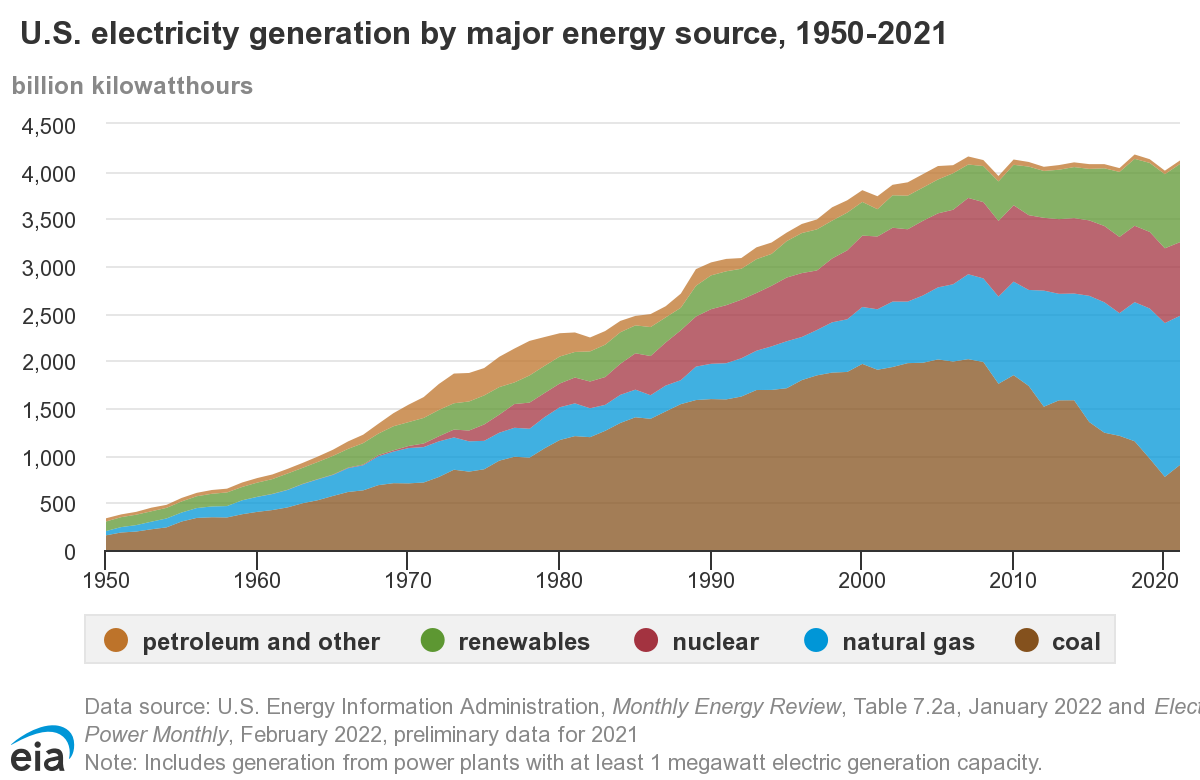
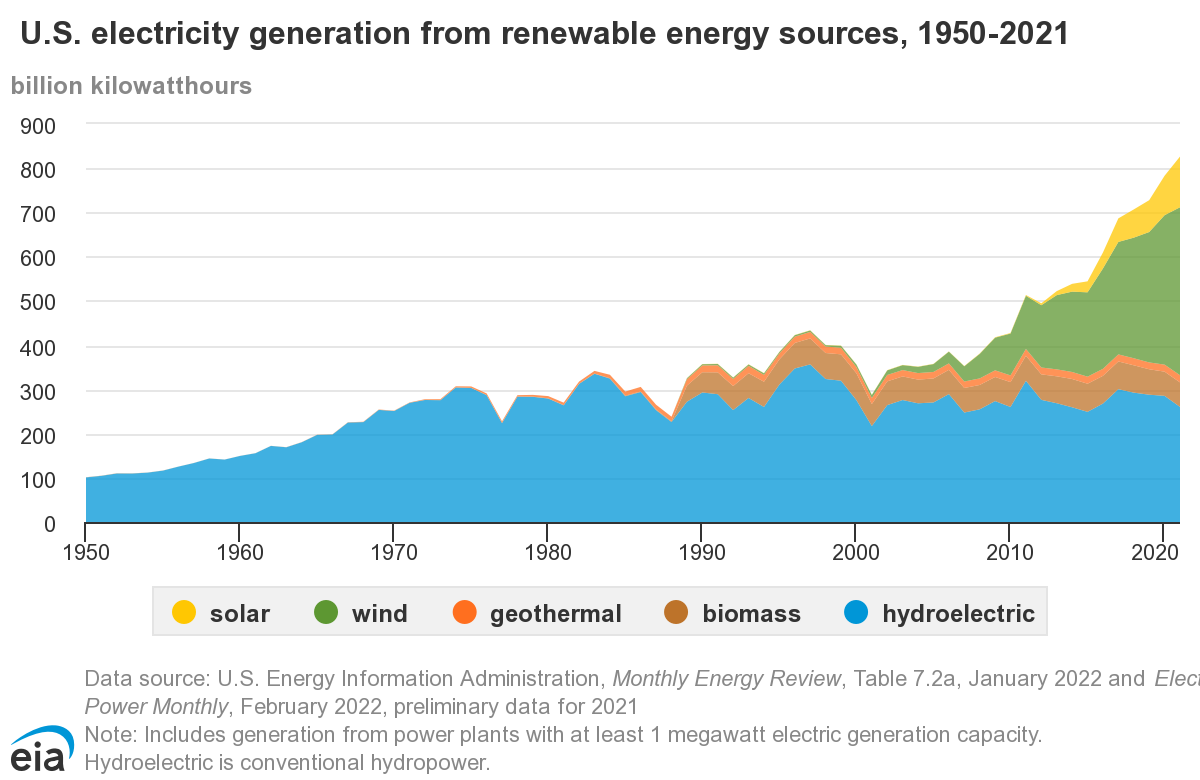
Figure 3, below, displays the renewable energy sources that contribute to power generation. As you can see, there has been a rapid increase in wind and solar power generation. However, it will take decades for alternative fuels to make a substantial contribution to the energy portfolio in the United States. Thus, there is a need to continue to use fossil fuels and nuclear power to “bridge” the gap. How the former (fossil fuels and nuclear power) are delivered to market and how they are priced is the main focus of this course.
Renewable electricity generation
1950 - 2020 (history)
Geothermal: Geothermal generation was relatively stable, and very low, from 1990 - 2020.
Biomass: Biomass generation has remained steady at about 50 - 60 billion kWh from 1990 - 2020.
Hydroelectric: Hydroelectric generation varied widely between about 220 billion kWh and 350 billion kWh from 1990 - 2021.
Utility-scale and end-use solar: Solar generated almost zero kWh before 2010. It rose from almost zero to about 115 billion kWh by 2021.
Wind: Wind power generated almost no power until 2004. From 2004 until 2021 it rose to about 378 billion kWh, more than 25 times of 2004 generation level.
- Geothermal: Geothermal generation was relatively stable, and very low, from 1990 - 2020.
- Biomass: Biomass generation has remained steady at about 50 - 60 billion kWh from 1990 - 2020.
- Hydroelectric: Hydroelectric generation widely between about 220 billion kWh and 350 billion kWh from 1990 - 2021.
- Solar: Utility-scale and end-use solar generated almost zero kWh before 2010. It rose from almost zero to about 115 billion kWh by 2021.
- Wind: Wind power generated almost no power until 2004. From 2004 until 2021 it rose to about 378 billion kWh, more than 25 times of 2004 generation level.
Now that we have clarified the difference between renewable and non-renewable sources of energy, let’s have a look at the production and consumption of energy in the United States on a macro level.