Overview
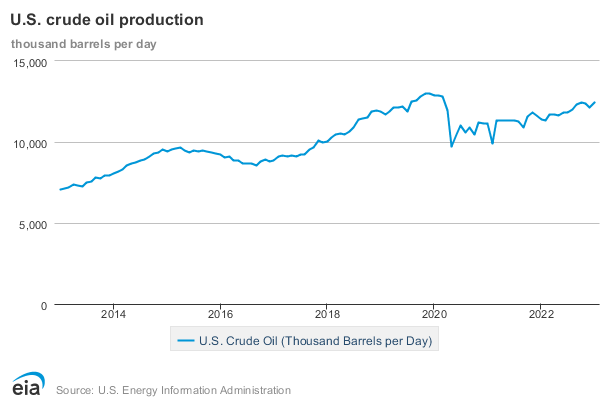
In mid-2008, crude oil shocked energy markets as it reached an all-time high of $147/barrel (Bbl.) on the New York Mercantile Exchange. (See Figure 0 below.) Within four months, prices had sunk to $50 per barrel. Then, again in 2014, prices hit a high of about $100/Bbl in June only to fall to under $50/Bbl by December. In April 2020, crude oil futures price dropped to about - $40/bbl for the first time in history. How could these happen, and what were the factors causing these levels of price volatility? We will be exploring these questions in Lesson 2.
Learning Outcomes
At the successful completion of this lesson, students should be able to:
- recognize the various factors impacting supply & demand for natural gas & crude oil;
- research major supply/demand influences:
- global economy,
- domestic economy,
- weather,
- currencies,
- energy commodity relationships,
- inventory and storage reports;
- evaluate the potential impact on market pricing for each factor researched;
- identify information about imports, exports, consumption, production, and formation of crude oil and natural gas;
- identify information about fracking, including technological advances, regulations, and concerns.
What is due for Lesson 2?
This lesson will take us one week to complete. The following items will be due Sunday at 11:59 p.m. Eastern Time.
- Lesson 2 Quiz
- Lesson 2 activities as assigned in Canvas
Questions?
If you have any questions, please post them to our General Course Questions discussion forum (not email), located under Modules in Canvas. The TA and I will check that discussion forum daily to respond. While you are there, feel free to post your own responses if you, too, are able to help out a classmate.
