Lesson 2 - Supply/Demand Fundamentals for Natural Gas & Crude Oil
Lesson 2 Introduction
Overview
In mid-2008, crude oil shocked energy markets as it reached an all-time high of $147/barrel (Bbl.) on the New York Mercantile Exchange. (See Figure 0 below.) Within four months, prices had sunk to $50 per barrel. Then, again in 2014, prices hit a high of about $100/Bbl in June only to fall to under $50/Bbl by December. In April 2020, crude oil futures price dropped to about - $40/bbl for the first time in history. How could these happen, and what were the factors causing these levels of price volatility? We will be exploring these questions in Lesson 2.
Learning Outcomes
At the successful completion of this lesson, students should be able to:
- recognize the various factors impacting supply & demand for natural gas & crude oil;
- research major supply/demand influences:
- global economy,
- domestic economy,
- weather,
- currencies,
- energy commodity relationships,
- inventory and storage reports;
- evaluate the potential impact on market pricing for each factor researched;
- identify information about imports, exports, consumption, production, and formation of crude oil and natural gas;
- identify information about fracking, including technological advances, regulations, and concerns.
What is due for Lesson 2?
This lesson will take us one week to complete. The following items will be due Sunday at 11:59 p.m. Eastern Time.
- Lesson 2 Quiz
- Lesson 2 activities as assigned in Canvas
Questions?
If you have any questions, please post them to our General Course Questions discussion forum (not email), located under Modules in Canvas. The TA and I will check that discussion forum daily to respond. While you are there, feel free to post your own responses if you, too, are able to help out a classmate.
Reading & Viewing Assignments
Before we begin our discussion of the logistics and value chain for natural gas and crude oil, we need to have at least a cursory understanding of the “upstream” processes for the exploration, drilling, fracturing, and production of these fossil fuels. The following readings and video support this learning.
Reading Assignment:
Oil and Gas Basics from EIA Website
Go to the EIA website and read the following sections from “Nonrenewable Sources [2]”:
- Oil and Petroleum Products
- How was crude oil formed? [3]
- What is crude oil, and what are petroleum products? [4]
- What is a refinery? [5]
- The refining process [6]
- Where Our Oil Comes From [7]
- How is crude oil found and produced? [8]
- Imports and Exports [9]
- Offshore Oil and Gas [10]
- Offshore drilling [11]
- Use of Oil [12]
- Oil Prices and Outlook [13]
- Oil and the Environment [14]
- Natural Gas
Optional Materials
Please take some time to review the optional materials. They will give you context for the rest of the lesson.
Optional Readings
- Hydrocarbon Gas Liquids [22]
- Coal [23]
- Nuclear [24]
Oil and Gas Formation Video (3:04 minutes)
Oil Well Drilling Process Video (21:38 minutes)
Hydraulic Fracturing (fracking)Video (6:36 minutes)
How does fracking work? What are the environmental concerns? Video (6:03 minutes)
Crude Oil
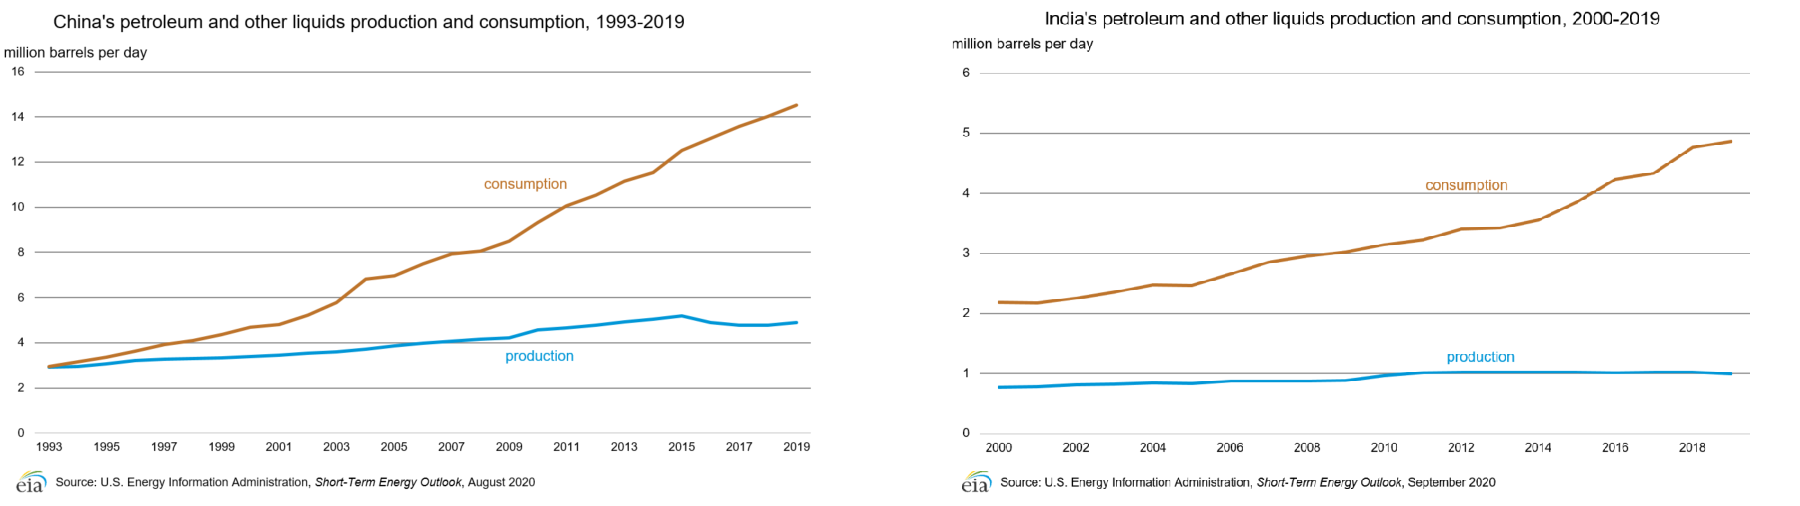
Economists have long recognized that we are truly a global society and all of our economies are intrinsically tied together. Growth or recession in one region of the world could have a ripple effect on other regions. China and India were emerging as large-scale industrial countries with vast exports of manufactured goods. Both were consuming new, higher levels of energy (Figure 4), and most specifically, crude oil. News of increasing crude imports by both countries sparked buying of the financial commodity contracts.
The so-called “speculators” were blamed for a lot of the price increase that year, but there was a whole new set of players who greatly influenced the market. Investment funds and private investors, both domestic and international, saw the crude market as a “safe harbor” from the ups-and-downs of the stock market and the US dollar. When the stock market fell, they bought crude oil contracts. And when it rose, they sold those same contracts. The dollar is a little more complicated. When the value of the US dollar falls relative to foreign currency, overseas investors have more “buying power,” that is, they can buy more crude with their currency than those holding US dollars. So, to some extent, it is true that “traders” had a major influence on oil prices that year. But the definition of “trader” had changed from the stereotypical “day trader,” who wreaks havoc on markets, to sophisticated investors and real demand from emerging nations.
Today, the economic health of various countries still impacts the volatility in oil prices, and the US dollar and crude prices have a very high but inverse correlation. And geopolitical conflicts involving oil-producing countries and regions always cause concern over potential supply disruptions.
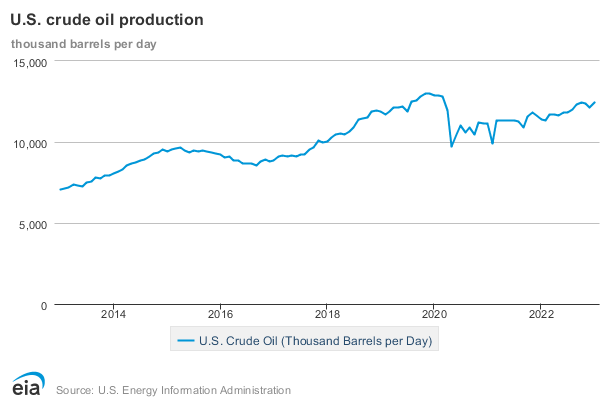
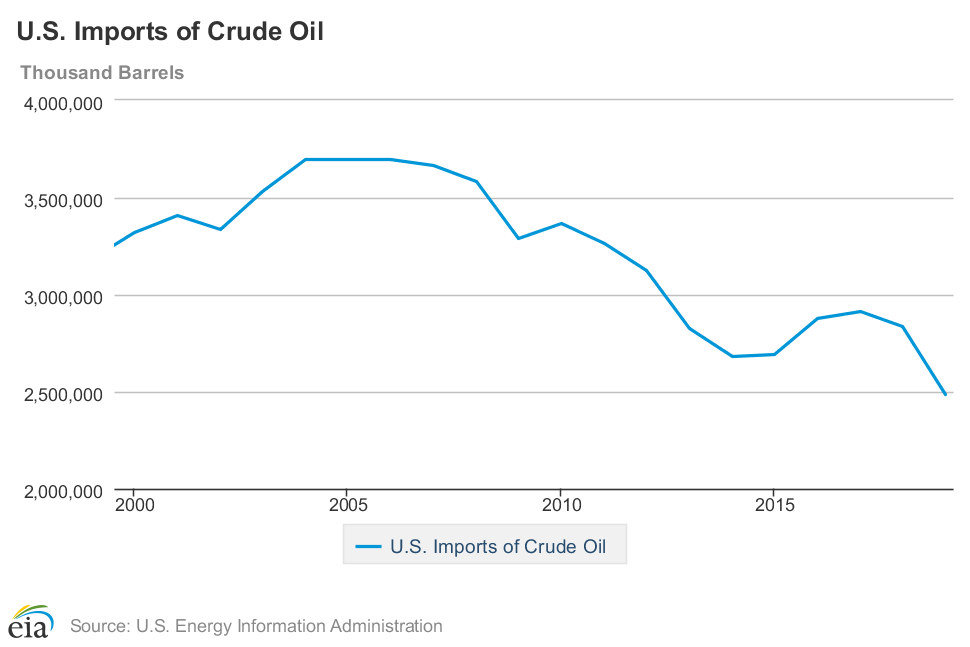
US oil production has been risen over the past years (before the unprecedented situation in 2020) and stayed at about 12.8 million barrels per day in December 2019. This represents an increase from 2008 to early 2015, decrease in production from around mid 2015 to September 2016, and then increase in production again from then to late 2019. Production from 2014 to 2018 has been over 8.0 million Bbl/d. In 2016, U.S. crude oil production represents only about 55% of consumption, with the remainder coming in the form of imports. However, as Figure 3 shows, imports continue to decline as domestic crude supplies increase.
The rise in domestic oil production is mostly attributed to the new, “unconventional”, sources found in shale formations and high levels of oil price make the production from these sources more profitable. Advances in seismology (“3-D”), directional drilling (“horizontal”) and, fracturing methods (“fracking”), have made this once inaccessible resource commonplace today. Contrary to some beliefs, the number one source of imported crude oil in the US is not the Middle East, but Canada. Oil from tar sands in their Western Provinces is shipped via pipeline into the US.
Figure 2 is extracted from the EIA report on the U.S. crude oil production [29]. Figure 2 shows the upward trend in oil production over the (6) years before 2015, downward trend from mid 2015 to late 2016, and upward production trend again from late 2016 to late 2019 (before the unprecedented global pandemic in 2020). (Based on the latest completed study by the Energy Information Agency of the US Department of Energy.) This link from the EIA includes the historical data from the 20th century [30].
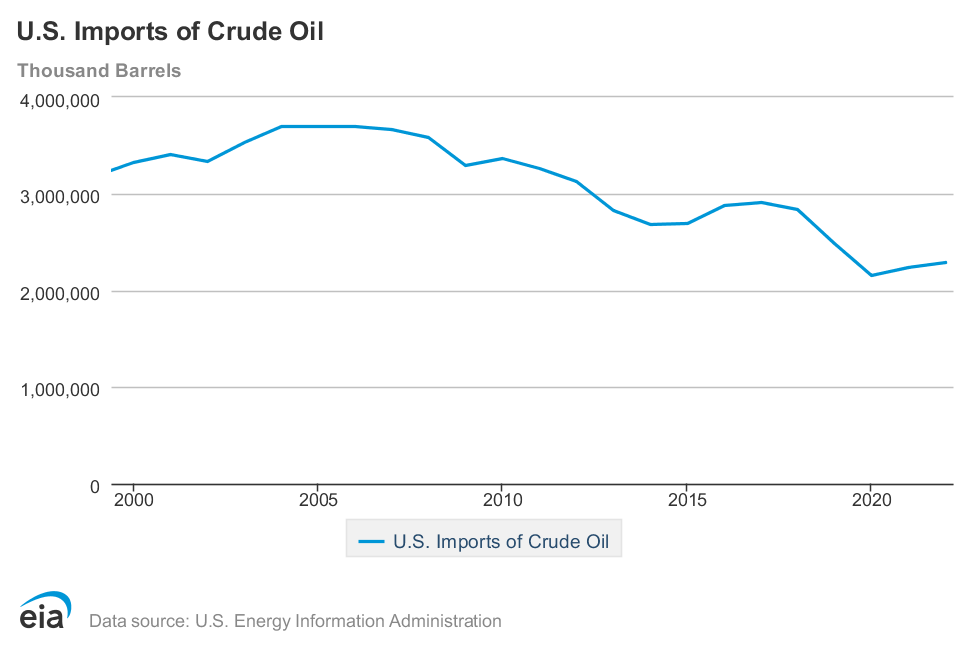
Figure 3 shows the downward trend in oil imports for the same time period (2000 - 2020).
Crude oil is produced in 32 states in the United States and as of 2021 about 71% of domestic crude oil production comes from the following five states [32]:
- Texas: 42.4%
- New Mexico: 11.1%
- North Dakota 9.9%
- Alaska: 3.9%
- Colorado: 3.7%
Crude oil is produced in about 100 countries around the world. In 2021 about half of the world oil production comes from the following five countries [32]:
- United States: 14.5%
- Russia: 13.1%
- Saudi Arabia: 12.1%
- Iraq: 5.3%
- Canada: 5.8%
Here are the top five oil consumer countries in the world in 2021 [33]:
- United States: 21%
- China: 15%
- India: 5%
- Russia: 4%
- Japan: 4%
According to EIA [34]:
" In 2022, the United States imported about 8.32 million barrels per day (b/d) of petroleum from 80 countries. Petroleum includes crude oil, hydrocarbon gas liquids (HGLs), refined petroleum products such as gasoline and diesel fuel, and biofuels. Crude oil imports of about 6.28 million b/d accounted for about 75% of U.S. total gross petroleum imports, and non-crude oil petroleum accounted for about 25% of U.S. total gross petroleum imports. ”
Here are the top five countries that the US is importing oil from with their share in 2022 [35]:
- Canada: 4.4 million barrels per day (52%)
- Mexico: 0.81 million barrels per day (10%)
- Saudi Arabia: 0.56 million barrels per day (7%)
- Iraq: 0.31 million barrels per day (4%)
- Columbia: 0.24 million barrels per day (3%)
Figure 4 displays the China and India oil production and consumption since the 90s. As you can see in this graph, oil consumption by these two countries has increased substantially during the past two decades, while their oil production hasn't changed significantly. This gap has created a large oil demand from these two counties in the global oil market.
Factors Influencing Crude Oil Price
Many, many factors can influence the price of crude oil either directly or indirectly. Some of the major factors influencing US crude oil prices are:
- US weather – mostly winter, as the demand for heating oil impacts crude oil prices. The Northeastern part of the US is the world's single largest consumer of heating oil.
- Geopolitical events - in any oil-producing region of the world where conflicts exist that could potentially interrupt supply.
- US dollar vs. foreign currencies - as mentioned previously, a devalued US dollar gives foreign investors more money to buy crude oil contracts and, vice versa, a stronger US dollar discourages foreign investment in crude oil contracts.
- US economy - strength or weakness directly impacts the perception of energy consumption. Several economic indicators are released weekly.
- World economy - as stated in the introduction, we are now in a truly global economy and what happens in one country can affect all others.
- Production & imports vs. demand - reports on domestic oil production & imports vs. consumption can cause prices to vary greatly. Some of the reports/statistics are listed below:
- Baker Hughes Drilling Report of active rigs - this oilfield service company keeps track of the total number of rigs actively drilling for oil and gas, and they report the statistics weekly. A rise in rigs means more potential supply coming-on down-the-road. A drop in the rig count could mean less supply down the road.
- West Texas Intermediate (WTI) crude vs. Brent North Sea crude - Brent crude oil is presently the global standard and trades in London. Its prices reflect demand in continental Europe, which can influence the price of imported crude here in the US.
- Weekly Crude Oil & Distillates Inventory Report (Energy Information Agency) - The Department of Energy releases a report every week that gives the current amount of crude oil and distillates in the nation's storage facilities. (Distillates include heating oil, diesel, gasoline, etc.) Increases in the inventory are viewed as an increase in supply, while decreases are seen as an indicator of increased demand. Another key piece of information presented is that of "refinery utilization". The higher the utilization percentage, the higher the demand for crude and vice versa.
- OPEC [13] - The Organization of the Petroleum Exporting Countries, OPEC, was formed in 1960 by the first five members including Iran, Iraq, Kuwait, Saudi Arabia, and Venezuela and has 14 members as of May 2017. OPEC members control about 73% of the world's total proved oil reserves and produced 44% of the world's total crude oil in 2016. OPEC has a significant impact on the oil market, managing the oil production, and oil price.
- Cross-commodity markets – as we will see in future lessons, most fuels, such as gasoline, diesel fuel, heating oil, and jet fuel, are all produced from crude oil. The demand shift for these commodities, such as travel season and weather change, will also impact the demand of crude oil. The EIA Weekly Crude Oil & Distillates Inventory Report also lists inventory changes for these commodities.
The following videos go into greater detail about the factors which can influence crude oil prices. Please note that some of the statistics might be a bit out of date, but please do not worry about that. These are just examples and are meant to teach you about how the various factors influence the market. You will not be responsible for the example details.
(The lecture notes can be found in the Lesson 2 module in Canvas (Lesson 2: Supply/Demand Fundamentals for Natural Gas & Crude Oil.)
Fundamental Factors Part 1: Weather and the US Economy
(9:04 minutes)
Farid Tayari: In this video and following videos, I'm going to explain the factors that are influencing the crude oil price. So there are many factors that can have an impact on crude oil price that we can name some of them as weather, US economy, international economy, US dollar exchange rate comparing to other foreign currencies, geopolitical events, supply and demand statistics, and crude oil and petroleum distillates inventory.
First, US weather-- heating oil is a refined distillate of crude oil. And it is being used by 5.7 million-- around 6 million households-- in the United States for space heating and warming of the water. Around 80% of those six million households are living in Northeast part of the country.
So if there is a cold winter, if there is a cold wave hitting this part of the country, we're expecting to have higher demand for heating oil. And it could be a good signal for price of oil being potentially increased.
I put a link here and this is slide to EIA website-- Energy Information Administration-- that includes the heating oil prices. So in addition to looking for data such as temperature or having a potential prediction of wind chill, there's also another indicator called HDD or Heating Degree Days. It's a good sign for energy demand.
So HDD represents the amount of energy being used to heat the space inside the building to reach 65 degrees, Fahrenheit. The lower outside temperature, it means that more energy has to be used for space heating. So historical and forecasted issues can be found at this link. It takes you to the National Oceanic and Atmospheric Administration. It can be a good metric for expected demand of heating oil and eventually, crude oil.
So one thing that we have to note that HDD is always positive-- there's no negative-- in case for the summer, the outside temperature is higher than 65, and then energy has to be used to cool down the space to the 65. We use this metric called CDD, or Cooling Degree Days. It's a measure for the amount of energy that needs to be used to cool down the building.
The other weather event that could potentially affect the crude oil price is a hurricane. According to EIA-- Energy Information Administration-- around 23% of the offshore oil production and 45% of the US oil refining capacity is around the Gulf of Mexico. And this is the section that in case of hurricane, that could potentially be affected and the supply can be interrupted.
So around 24 hours before the hurricane, the site-- which is a production site or drilling site-- has to be evacuated. And after the hurricane, it takes around at least 72 hours to reman the facility and start production.
In case of hurricane, there are two possible things that can happen, the interruption in the production because the site has to be evacuated. Or if the hurricane is severe, it can also damage the facility. For example, two cases-- Hurricane Katrina in 2005, 12 rigs and 30 platforms were damaged. And 18 of those platforms were completely destroyed.
Hurricane Ivan in 2004 damaged seven rigs and destroyed two rigs, and seven platforms destroyed. And it had consequences-- flooding and so on and so forth. And this can cause the supply interruption or the prediction of supply interruption. So when there is an interruption in supply, price can potentially increase.
I put a link here and it takes you to National Hurricane Center. It is a good resource for getting information of hurricane events. The official hurricane season begins on June 1st and it goes to November 3rd with a peak around mid-September. During this time, Weather Channel provides information through tropical update report.
The other factor that fixed the price of oil is the economy. Oil is a global commodity and the United States economy and other major countries in terms of economy. They can potentially influence the price of crude oil.
In this video, I'm going to explain the effect of US economy and crude oil. And in the following videos, I'm going to focus on international aspects of the economy and factors that are affecting crude oil price.
So energy runs the economy. And every aspect of economy can potentially influence the crude oil price. If economy is doing good, if economy is growing, it means there will be higher demand in future. Demand will be increasing. Strength and weakness of domestic economy directly impacts their prices, and also the perception of prices change and the prediction of the demand and eventually, the price predictions and the reaction of the traders to the price.
One of the most obvious and most frequently reported indications of economic health is stock market. Dow- Jones Industrial Index, S&P 500, and NASDAQ are daily reports that indicate the performance of the stock market. If these metrics are showing a good performance for the stock market, it means that economy is growing. And it could go up.
There are also weekly, monthly, quarterly economic reports that can have immediate impact on the price perception. Unemployment rate and reports being published by US Department of Labor-- this report is published every Friday. Institute of Supply Management Index report published monthly. Inflation rate, which is calculated from the CPI, Consumer Price Index, is being reported by US Bureau of Labor Statistics. It's a monthly report. GDP, US Gross Domestic Product, which also being published by Bureau of Economic Analysis and it's being published quarterly.
Also, US Department of Commerce's Economic and Statistics Administration has number of economic indicators that include data from US Census Bureau and US Bureau of Economic Analysis. These economic metrics are including construction spending, housing starts, housing sales, US international trade, monthly wholesale trade, manufacturing and trade, sales for retail and food services, personal income, and personal spending.
Also, quarterly earning reports from US companies-- these are the report metrics in economic parameters that can help us predict the future demand.
The next video-- so I'm going to explain the other factors that can influence crude oil price.
Fundamental Factors Part 2: International Economy, US Exchange Rate and Geopolitical Events
(9:29 minutes)
Farid Tayari: Following the previous videos, in this video, I'm going to continue explaining the factors that are affecting crude oil price. In this video, I will start with international economy. As we learned previously, crude oil is an international commodity. It's a global commodity. It's being traded everywhere in the world. Every part of the world economy can have impact on the crude oil price. Some countries that are contributing to biggest portion of crude oil consumption, their economy can potentially have a big impact on crude oil price.
So when trading starts early in the morning on the exchange in New York, Asian market is already closed and European market is at midday. So the behavior of the market, the signs of how market will behave, they are already known.
And probably the most watched nation these days outside of the US is China. China is contributing to around 15% of the world GDP. And China is, after the United States, the second-largest consumer of crude oil.
After China, Japan used to be the third-largest consumer of crude oil. After the Fukushima nuclear disaster, Japan's imports of fossil fuel increased. But at the moment, India is in the third place, taking Japan's place in oil consumption of the world. Also, the European Union and Europe region is consuming around 22% of world crude oil, and this data is from 2013.
So economic growth in these regions that are large consumers of crude oil can influence the crude oil. If the economy is doing good, if growth rate-- economic growth rate-- is high, it gives the signal that the demand in the future-- there will be high demand for crude oil in the future. And if the economy is slowing down, it means that the expected demand will not be as high as before. The increasing demand will be not as high as before, and it is going to potentially affect the price of crude oil.
The other factor that can potentially influence the crude oil price is the United States exchange rate. As you know, crude oil is globally being traded in US dollar. So the fluctuation of exchange rate, US dollar compared to other currencies, can potentially affect the crude oil price.
Why? Because there are many traders outside of the United States, and they are trading the crude oil which is being traded in US dollar. So if the dollar value decreases-- if US dollar loses its value-- it means that those traders living outside of the United States will have higher buying power. So they can buy more crude oil futures contracts. It means that there will be higher demand from outside of the United States. It will increase the demand of crude oil and can potentially increase the price.
So usually, there is a strong correlation, negative correlation, between the United States US dollar value and crude oil price. During the periods of a strong US dollar, foreign traders, investors try to sell their future contracts. And when the US dollar loses its value, they tend to buy more contracts.
The other factor that can impact the price of oil is geopolitical events, especially in the regions that are big producers of oil. Any conflict or potential conflict can impact the prices. Any news that can give the sense of potential interruption in supply can increase the price.
Please note that it doesn't necessarily need something to happen that interrupts the supply. Traders are also humans. They behave emotionally. They can react to the news in an emotional way. So if news says some potential conflicts in the region where large producing countries are located, it can potentially affect the perception of the supply in the future. It could potentially interrupt the supply, or it can influence the perception of the supply in the future and can have a significant impact on the crude oil prices.
For example, in mid-June 2014, WTI-- West Texas Intermediate-- crude oil price was about $107 per barrel. And at the end of that year, it went down to around $54 per barrel. We can explain this price behavior into two major factors that influence the price. First, the increased supplies of oil in the United States, mostly coming from unconventional reservoirs, shale and tight sands, because the price of oil was high. And at this price, at around $100, it's totally economically feasible to produce oil from costly unconventional reserves.
Around this time, Saudi Arabia-- that is, one of the largest producers and exporters of crude oil-- tried to maintain the market share by flooding the market with cheap oil, but this strategy caused excess supply and price to drop substantially. Low price of oil can have a large impact on oil-producing countries that are highly dependent on the revenue from oil. Also, in the United States, the companies who are working on the exploration and production section of oil, they will have to cut back on exploration and drilling activities, too, because they lose their revenue. And potentially, if the price is too low, they can potentially-- the small companies-- they can go bankrupt.
The other major player in the oil global market is OPEC, or the Organization of Petroleum Exporting Countries. OPEC was formed in 1960 by the first five members, including Iran, Iraq, Kuwait, Saudi Arabia, and Venezuela. And right now, at the moment, 2017, it has 14 members. OPEC produced around 43% of the world's total crude oil in 2015, and OPEC members control about 73% of the world's total crude oil reserves. So every decision that OPEC members-- every agreement or even the meetings that don't come to an agreement can potentially affect the price of crude oil.
For example, if OPEC members come to an agreement and they cut back to production, it can cause the supply-- the world's total supply-- to decrease and eventually cause price increase. And if in their meetings, let's say there's time and there's a conflict-- politics is always involved in the decisions. If there is a period that prices are going down and they cannot come into an agreement for cutting back the production, then it can potentially affect market prices and potentially cannot stop the price decrease.
Fundamental Factors Part 3: Supply & Demand Statistics
(3:45 minutes)
Farid Tayari: Following the previous videos, in this video, I'm going to explain the factors that can influence the crude oil price.
The last factor that I'm going to explain is supply and demand statistics. Any informational report that can give some information about the production or consumption of crude oil and, also, its distillates products can cause an impact, can cause a price change.
There are a variety of reports being published by governmental entities, both US and international, as well as industry associations. And these reports are good sources to predict the behavior of the crude oil price.
EIA, Energy Information Administration, from the US Department of Energy, issues a report on the status of country's inventory of crude oil, and its various distillates. This report is being published every Wednesday at 9:30 AM, and it has several pieces of key supply and demand statistics.
I'm going to explain some of the items that are included in this report. First, a refinery utilization, the percentage of total US refinery capacity that is running indicates both demand for crude oil as well as production of gasoline.
And, two, is an import report, both raw crude oil and refined products, such as gasoline. They are imported and volumes are compared to last year, which could be indicators of improving or worsening the balance.
The other part of the report includes commercial crude oil inventory. The change in inventory from one week to the next week has a profound impact on crude oil prices from a trading standpoint.
Analysts provide forecasts for the change in inventory ahead of the actual report. And financial and energy commodity traders react to the difference between the forecasted and actual report.
The other piece of information that is included in the report is gasoline inventories. Total gasoline products, as well as, breakdown between finished gasoline and blending products, gives a picture of supply and demand for gasoline. A decrease in total products could mean more demand for refinery feedstocks. Surplus could mean just opposite.
If there is an inventory, it means that there will be more supply to the market, and price won't go up, then they potentially could go down.
Information about distillate fuel is also included in EIA Inventory report which, in this category, is mainly about heating oil. And as I explained earlier, the cold winter-- the cold weather, or low temperature, means higher demand for heating oil.
And if there is low inventory, if there is low storage, it can be translated to low shortage of supply and higher prices in the cold days.
Optional Video: Exchange Rate Example
So as I explained in previous video, value of the US dollar or US dollar exchange rate versus foreign currencies is one of the factors that affects the crude oil price. As we know, crude oil is a global commodity that is traded globally, but in US dollars. So any fluctuations in the exchange rate between US dollar and foreign currencies can affect the crude oil price.
I'm going to explain that in a very simple example. Let's assume there are two traders who trade crude oil futures contracts. So one is Trader A is in the United States and Trader B is in Europe. Trader A has $1,000, and Trader B has 1,000 euros.
So first, let's assume that the exchange rate between US dollar and euro is 1-to-1 so meaning that $1 is equivalent to 1 euro. And let's assume that crude oil price is $50 per barrel. OK, let's see what happens for Trader A.
Trader A has $1,000 and can buy 20 barrels of crude oil or can buy futures contract equivalent to 20 barrels of crude oil. So $1,000 divided by 50 leaves 20 barrels of crude oil.
Let's see what happens to the trader in Europe. So Trader B has 1,000 euros. The first thing that Trader B has to do is going to the exchange and convert the 1,000 euros to the equivalent dollar amount, which is $1,000. Then with that amount, Trader B can buy crude oil. So Trader B can also buy 20 barrels of crude oil.
So the total demand will be 20 from inside the United States and 20 internationally, assuming there only two traders. So there will be 40 barrels of crude oil demand, total demand.
OK, now let's assume the case that US dollar loses its value. So again, same traders, two traders, Trader A is located in the United States and has $1,000. Trader B is in Europe and has 1,000 euros.
And now let's assume US dollar has lost its value. Now $1 is equivalent to 0.8 euros. Or with 1 euro, you can get $1.25. And let's assume the crude oil price has stayed the same, $50 per barrel. And let's see what happens.
OK, trader A still has $1,000. Crude oil price is still $50 per barrel. So Trader A inside the United States can still get that 20 barrels of crude oil.
And let's see what happens to Trader B. Trader B has 1,000 euros. Trader B has to go and exchange that 1,000 euros to equivalent dollar. And as we can see, because dollar has lost its value, that 1,000 euros will be converted to $1,250 because, with 1 euros, Trader B will get $1.25. So Trader B has $1,250, which can buy five more contracts. So Trader B would end up buying 25 barrels of crude oil or futures contract equivalent to 25 barrels of crude oil.
So 20 barrels demand from Trader A inside the United States and 25 barrels of crude oil demand from Trader B outside the United States-- so total demand will be 20 plus 25, 45 barrels. So we can see the demand increase from 40 barrels to 45 barrels when the dollar has lost its value. So it means that demand has increased. So demand curve shifted to the left-hand side, which changes the market equilibrium price for crude oil. And it potentially increases the crude oil price.
Natural Gas
Extracted natural gas [38] is mainly composed of methane, with small amounts of hydrocarbon gas liquids (HGL) and nonhydrocarbon gases. After natural gas is produced, it has to be processed and impurities have to be removed to meet the pipeline standards and become marketable. The infrastructure of natural gas delivery (before distribution) can be divided into three main categories [15]:
- Processing: removing and separating other hydrocarbons, contaminants, and impurities.
- Transportation: transporting the processed natural gas with the pipeline.
- Storage: storing natural gas in underground storage sites (depleted natural gas or oil fields, salt caverns, and aquifers) for high-demand periods.
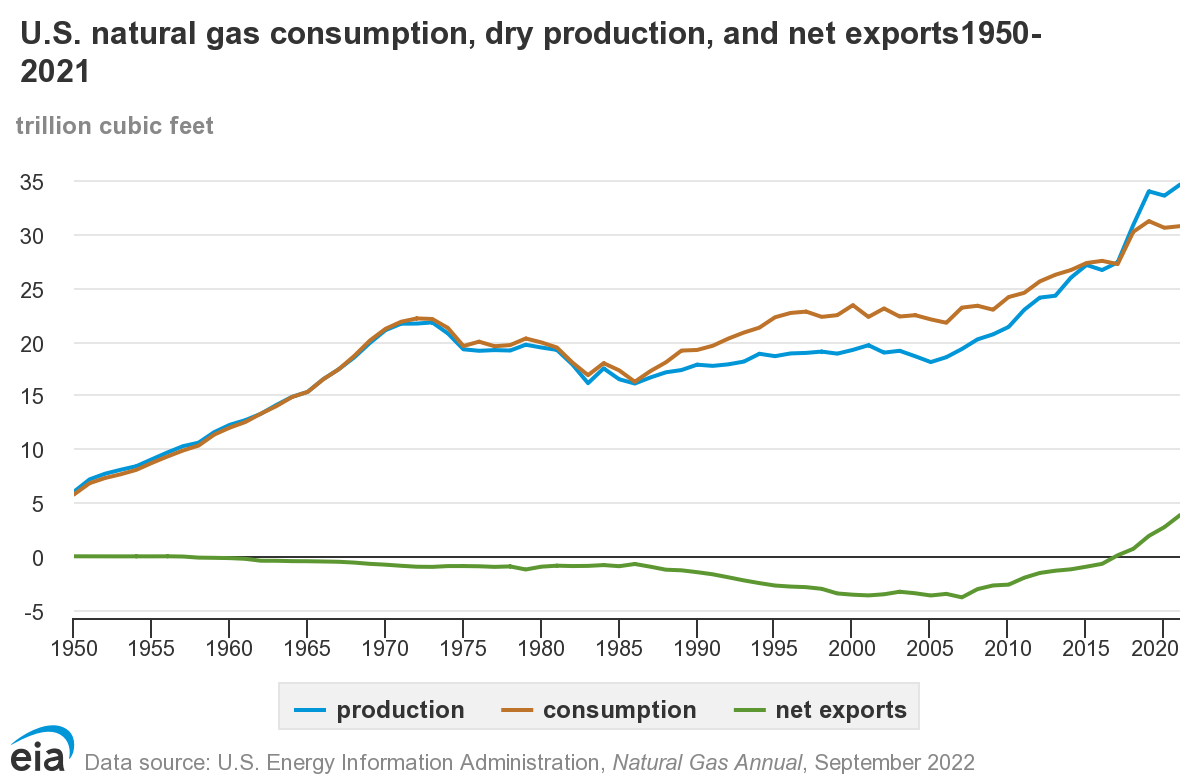
In 2021, U.S. dry natural gas production was about 34.5 trillion cubic feet and about 13% more than total U.S. gas consumption. This year, five states produced about 69% of total U.S. dry natural gas:
- Texas: 24.6%
- Pennsylvania: 21.8%
- Louisiana: 9.9%
- West Virginia: 7.4%
- Oklahoma: 6.7%
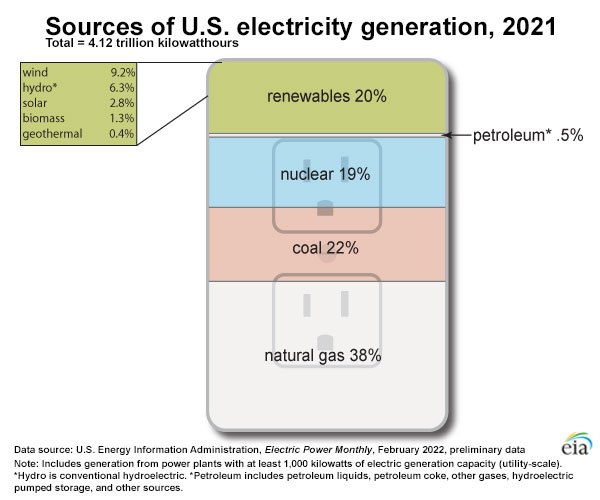
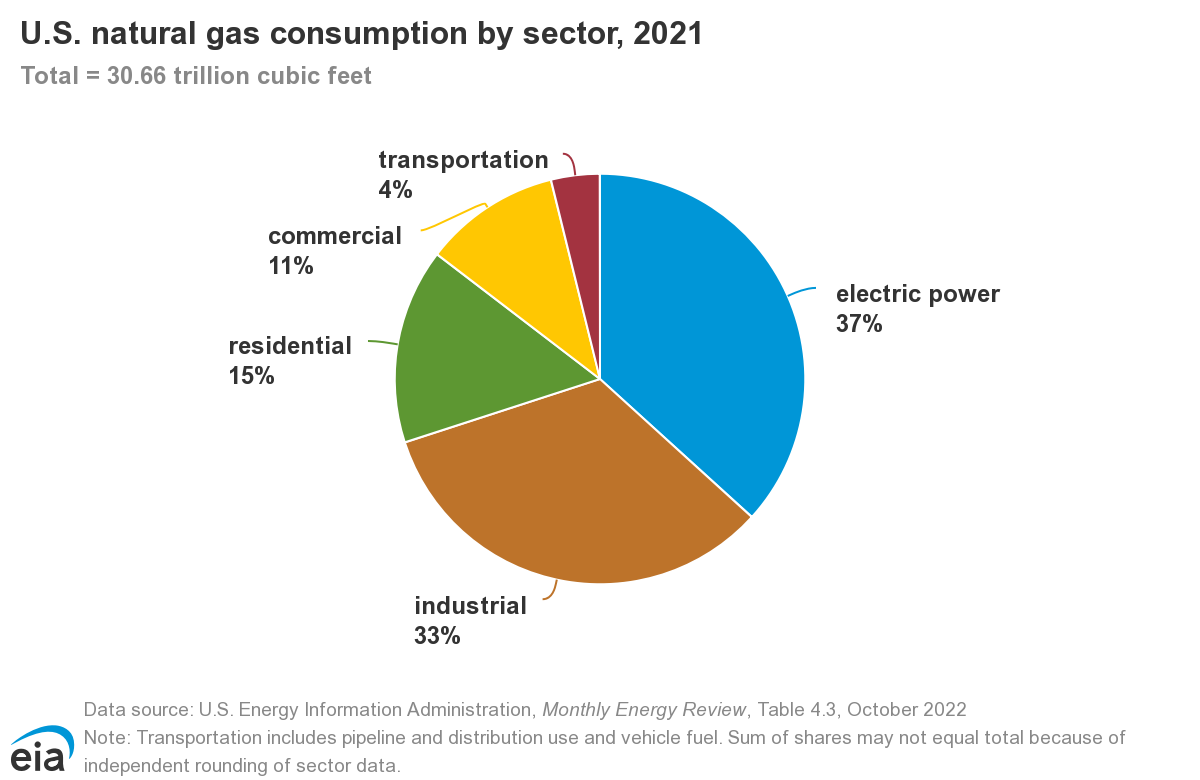
Natural gas is used in more than 50% of US homes for space heating and hot water. In addition, it is the largest source of energy for electrical generation at the moment (2021), see Figure 5. Natural Gas is also widely used in industrial, commercial, and industrial sectors. Figure 6 illustrates the breakdown of natural gas consumption by sector.
Click to expand to provide more information
| Energy source | Share of total |
|---|---|
| Natural gas | 38% |
| Coal | 23% |
| Nuclear | 20% |
| Renewables (total) | 17% |
| Hydropower | 6.6% |
| Wind | 7.3% |
| Solar | 1.8% |
| Biomass | 1.4% |
| Geothermal | 0.4% |
Click to expand to provide more information
| Energy Sector | Share of total |
|---|---|
| Electric Power | 36% |
| Industrial | 33% |
| Residential | 16% |
| Commercial | 11% |
| Transportation | 3% |
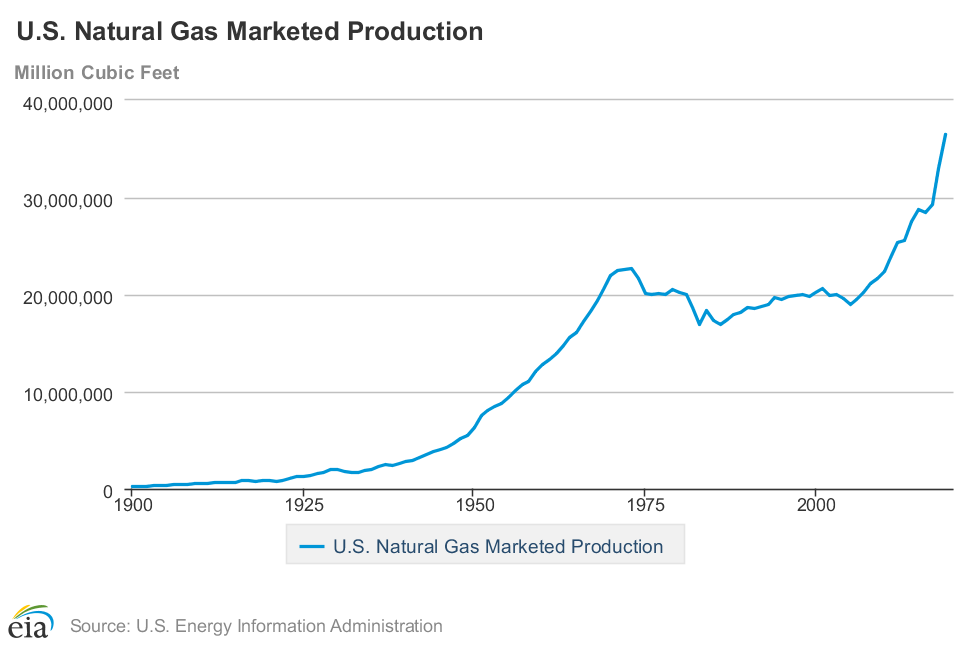
Domestic production in the US (see Figure 7) has grown dramatically in recent years due to the same advanced technologies that have allowed crude oil production to increase: “3-D” seismology, horizontal drilling and new “fracking” methods. All contribute to successful recoveries from hard formations such as the new “shales.”
Click for a text alternative to Figure 7
| Decade | Natural Gas Production |
|---|---|
| 1900 | 1028,000 |
| 1910 | 509,000 |
| 1920 | 812,000 |
| 1930 | 1,978,911 |
| 1940 | 2,733,819 |
| 1950 | 6,282,060 |
| 1960 | 12,771,038 |
| 1970 | 21,920,642 |
| 1980 | 20,179,724 |
| 1990 | 18,593,792 |
| 2000 | 20,197,511 |
| 2010 | 22,381,873 |
| 2019 | 36,515,188 |
Figure 8 illustrates the growth in the production of the currently active shale basins in the US. As you can see in the graph, natural gas production from Marcellus Shale formations, located mostly in Pennsylvania, West Virginia, Ohio, and New York, has been increasing during the past decade and has the largest portion of gas production among the shale formations.
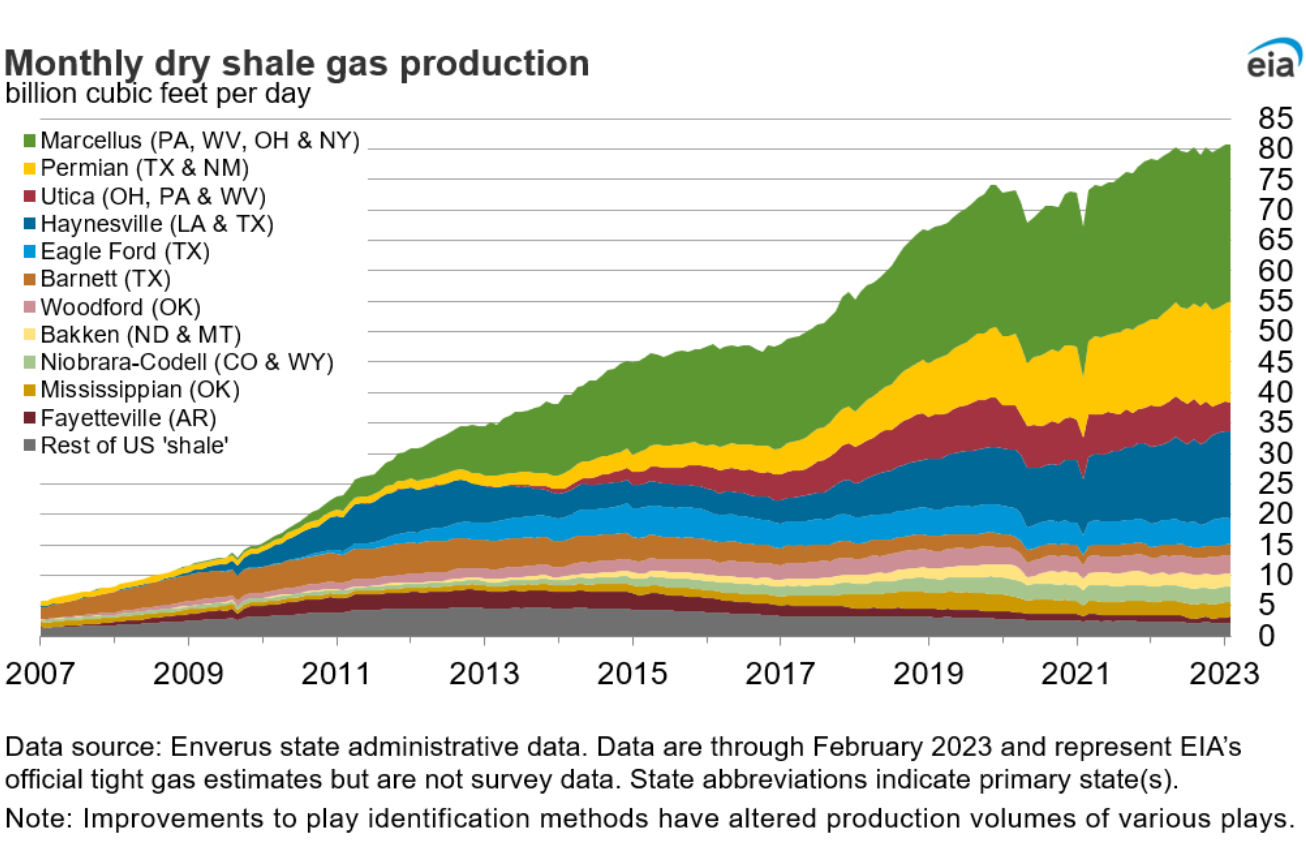
Production Growth of Active U.S. Shale Basins
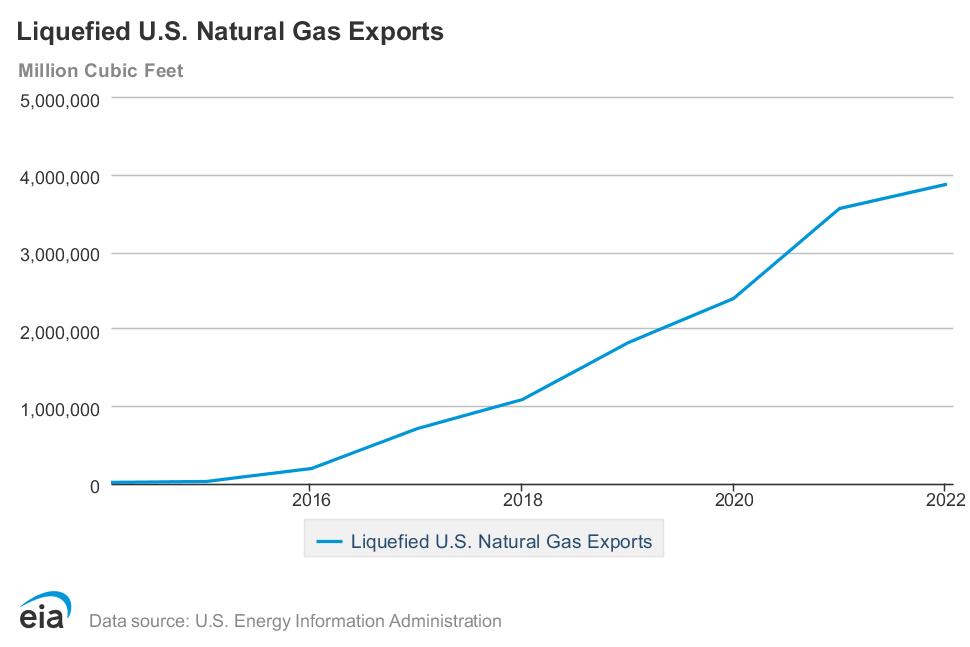
Due to the increasing demand since the late 1980s, the US also imports natural gas (see Figure 9). Canada represents the largest source (more than 97%) of imported natural gas, with Mexico contributing a minor amount. The export of natural gas had been very limited through pipeline export points into Canada and Mexico. However, the export changed dramatically since 2016 due to the skyrocketing LNG export. In 2017, the U.S. became a net exporter of natural gas and in 2021, the LNG export exceeded pipeline export for the first time since 1990.
Factors Influencing Natural Gas Price
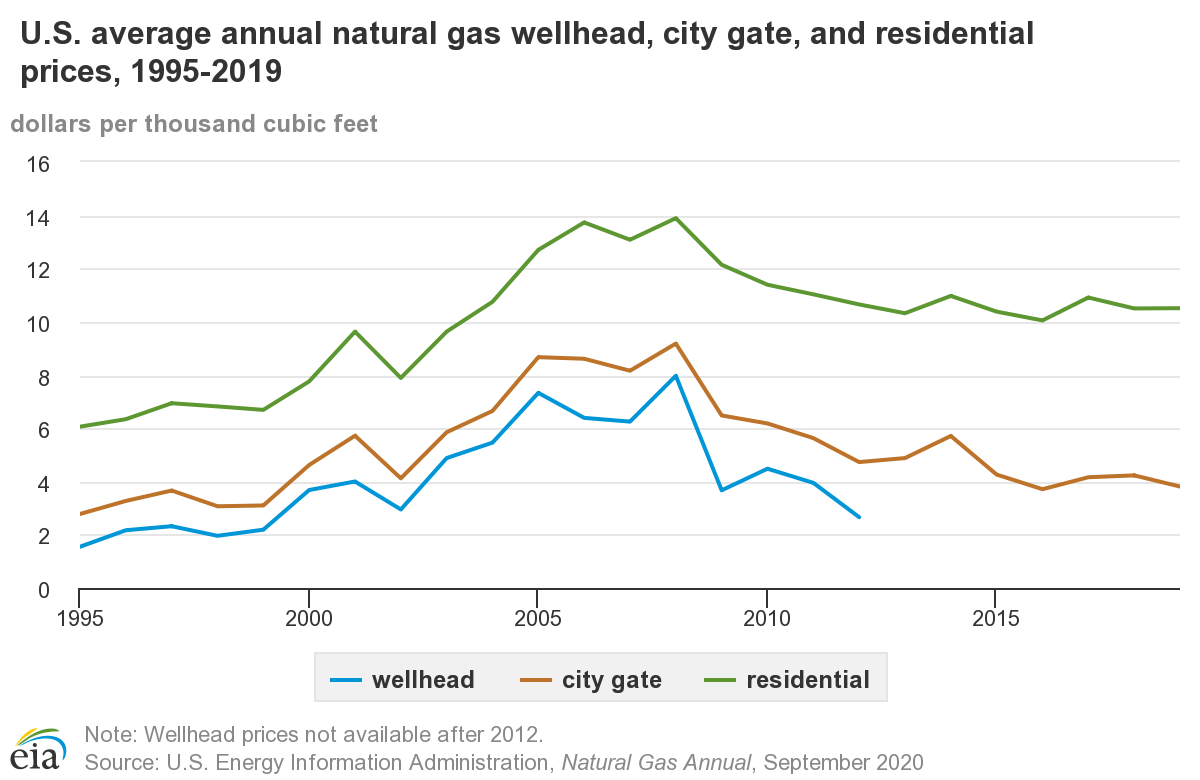
Figure 11 displays the U.S. average annual natural gas wellhead, city gate, and residential prices (1995-2019). Please note the increasing trend before 2008 and decreasing prices after. In order to fully understand these trends, have a look at Figure 7 (U.S. annual natural gas marketed production [40]) and U.S. GDP [43]from 1995-2019.
In contrast to crude oil, natural gas was almost strictly a domestic North American commodity* whose price is more influenced by weather and the health of the US economy. It is gradually becoming a global commodity in recent years due to increasing LNG export capacity [44]. Other factors, such as the level of US natural gas inventory, impact prices on a weekly basis. While US economic indicators, such as the stock market, employment figures, housing and, manufacturing indexes, are deemed to be indicative of demand for natural gas, global economies and the US dollar do not have much effect on pricing in this country.
Among the major factors influencing US natural gas prices are:
- Weather – over 50% of American homes are heated by natural gas; hot weather leads to more electrical generation for air-conditioning loads, and natural gas represents about 25% of that market. Hurricanes in the Gulf of Mexico disrupt supply as platforms are evacuated ahead of the storms, and the hurricanes can also damage the rigs.
- US economy - as with crude oil, fluctuations in the economy translate into an increase or, decrease, in energy consumption.
- Production levels vs. demand indicators - statistics showing flowing natural gas are compared with demand indicators to determine if the market is "short" or "long" supply. Here are some major indicators.
- Weekly Natural Gas Inventory Report (Energy Information Agency) - every Thursday morning, the US government releases data on the amount of natural gas that is in the nation's underground storage facilities. Injections and withdrawals from storage are also indicative of supply and demand dynamics.
- Baker Hughes Drilling Report of active rigs - the field services company reports weekly on the number of drilling rigs actively pursuing oil and/or natural gas. The change in number and type impact the perception of supply in the future.
- Electrical generation “fuel-switching” - besides the impact of overall demand for electricity, a large amount of the country's power plants that are fueled by coal can actually switch to natural gas, but only if prices are competitive. Also, the Nuclear Regulatory Agency publishes a daily status report for all nuclear plants in the US. When plants are down, more electricity is generated by natural gas.
- Global demand – US LNG reaches most regions of the world [45]. Major economies such as Brazil, China, France, India, Japan, Netherlands are purchasing more and more US LNG. The price of LNG is higher than natural gas exported by pipeline due to costs associated with compression, transportation, and decompression. However, it is still profitable given the increasing worldwide demand for clean energy.
The following video goes into greater detail about the factors which can influence natural gas prices. (The lecture notes can be found in module 2 in Canvas. (Lesson 2: Supply/Demand Fundamentals for Natural Gas & Crude Oil.)
As we explore pricing for crude oil and natural gas in a later lesson, we will consider the major influential factors for each and define their individual impact. We will also have a weekly activity about the market prices for crude oil and natural gas and the factors we believe affect them.
Note: When commodity price is expected to go up, the market is called bullish [46]. In this case, an investor will invest in the commodity. On the other hand, if prices are expected to go down, then it’s called a bearish [46] market. In this situation, an investor is expecting the commodity to lose its value. Consequently, the investor sells the financial commodity.
PRESENTER: In this video, I'm going to explain the factors that can influence natural gas price. In contrast to crude oil, natural gas is almost not a global commodity, yet. It can be construed as a domestic commodity in the United States. So things that are happening outside the United States, they don't have a major impact on the natural gas prices.
So we can focus on the factors that are happening in the United States. And two of these major factors are the US economy and weather events. Other factors, such as the level of US natural gas inventory, can also impact the natural gas prices on a weekly basis.
The higher natural gas inventory means high supply or having enough supply for fluctuations in demand. So if there is a high level of inventory, it can translate to not having, not experiencing, not expecting the higher price of natural gas.
US economic indicators such as the stock market, employment, figures housing and manufacturing, they impact the natural gas prices. On the other side, global economy, US dollar exchange rate would not have an impact on the pricing of natural gas.
The first factor is the weather. More than 50% of American homes are heated by natural gas. So any cold or extreme weather could potentially increase the price if there is a shortage of supply. If there is an unexpected demand, it could shift the price to higher prices.
Also, hot weather could cause the price increase, because people will use air conditioning to lower the inside temperature for space cooling. And so increase in demand for electricity could potentially increase the natural gas prices.
The other weather event is hurricanes, same as crude oil, that we explain how a hurricane in the region of Gulf of Mexico can disrupt the supply and damage platforms. Evacuation and recovery after a hurricane can potentially interrupt the supply.
US economy-- similar to crude oil, fluctuations in economy translate into an increase or decrease in energy consumption. North American natural gas is not a truly global commodity, so the global economy does not have an impact on the price of natural gas.
The other factor that could potentially affect the natural gas price is the reports about production levels versus demand indicators. Any statistics, any information about supply or demand of natural gas can potentially affect the price.
EIA, Energy Information Administration from Department of Energy, publishes a weekly report every Thursday at 9:30 AM. This report is about natural gas storage. And it has some pieces of information that I'm going to explain them in the following slides.
So EIA Weekly Natural Gas Storage Report includes pieces of information on natural gas storage. The first piece of information is regional breakdown-- the activity for the EIA-defined regions, which includes the major consuming regions, both east and west, and producing region. The producing region is further broken down into the salt and non-salt storage facilities, with the majority of the salt caverns existing along the Gulf Coast.
Injections, or gas added, and withdrawals, gas removed, by region can be telling about the weather conditions in each area. A good balance is when the consuming regions are withdrawing the same amount of gas as producing region is injecting gas.
The other very important piece of information included in EIA Weekly Natural Gas Storage Report is the total gas in storage. It is the change in historic levels from one week to the next week. It is the first thing that traders and other parties involved in the natural gas market would look to for guidance.
Excess storage, a high level of storage or injection in the report, can be translated to a bearish price signal. That is, the production exceeds demand for the prior week.
The converse is also true for the removal of gas from the storage, or withdrawal in the report, that can indicate demand exceeded the production for the prior week. Prior to the release of the report, analysts have compiled forecasts in the variance of the actual volume to these predictions.
The other piece of information that can be found in EIA Weekly Natural Gas Storage Report is a comparison to a year ago. This data includes the information-- the current inventory level compared to the same period the previous year. In order to truly interpret this comparison correctly, we must consider the weather in this year with the last year, if there was or there is harsh winter we are experiencing or we were experiencing cold days.
The last piece of information in EIA Weekly Natural Gas Report that is important for us is a comparison to the five-year average that can be found in the report.
The other factor that can influence natural gas price is electrical generation fuel switching. A large amount of country's power plants were fueled by coal. And they can switch. They can switch their fuel to natural gas if natural gas prices are competitive or more restrictions are being enforced for the emissions. But this effect is a more long-term effect.
Also, the Nuclear Regulatory Agency publishes a daily status report for all nuclear power plants in the United States. When plants are down, more electricity is generated by natural gas.
Summary and Final Tasks
Key Learning Points: Lesson 2
- In 2008, the record run-up in oil prices actually represented a dynamic shift in the composition of market participants.
- Crude oil is a globally-traded commodity in a world where the economies of most countries are tightly intertwined.
- The US is gradually increasing its domestic oil production, thus reducing its crude imports.
- Natural gas is strictly a domestically traded commodity (until late 2015/early 2016 when we start to export LNG).
- Vast new reserves of natural gas have been found in “shale” plays due to new technological advances in exploration, drilling, completion, and production.
- The US is both an importer and exporter of natural gas.
- Several factors influence the prices of crude oil and natural gas.
Now that we have examined production and consumption in the United States as well as the energy “mix,” we will focus on the fuel sources that comprise over 57% of the energy used in this country. Crude oil, with refined products, and natural gas and related natural gas liquids (NGLs) make-up this large sector.
Reminder - Complete all of the Lesson 2 tasks!
You have reached the end of Lesson 2. Double-check the list of requirements on the first page of this lesson to make sure you have completed all of the activities listed there before beginning the next lesson.