Lessons
Lesson 1: Energy and Society
The links below provide an outline of the material for this lesson. Be sure to carefully read through the entire lesson before returning to Canvas to submit your assignments.
Introduction & Checklist
Welcome to Lesson 1!
It looks like we are ready to go for lesson 1: Energy and Society. This lesson is going to teach us about energy! What is energy, and with which units do we measure energy? We will learn about the commonly used units we use to measure energy. There are different forms of energy that we use; for example, we use electrical energy or mechanical energy, like moving a car, etc., and we need to know the units in which we measure these different forms of energy. So we will also learn about forms of energy. We will learn about the units in which we measure these forms of energy, and also we will get into a very, very important distinction between energy and power. To be clear, that is the key concept in this lesson that I want you to concentrate on – power and energy. And once we know the difference, we know that using power, we can calculate energy, or if we know the energy and time, we can calculate power.
We will also look at some of those calculations. Once we know the power, we can calculate the energy. For example, a computer consumes some power, the rate at which energy is drawn, and if we use the computer for so many hours, what is the energy consumption by this computer? We can do the same thing for a refrigerator, or we can do it for any other appliance that you use at home. These are common appliances that we are using every day in our lives. When we add up the energy consumed by a computer, by a toaster, by an oven, by a refrigerator, by lighting, etc., at your place then you get energy consumption of all your equipment for a day. So we are going to do that and calculate energy consumption for a day, and then for a month, and we can calculate also the electric bill for one whole month -- that would be our objective in this lesson.
Be careful, again, because the distinction between energy and power is a very important concept. Forms of energy and the units in which we measure energy are the concepts that we will be looking at in this wonderful lesson. All Right! Why Wait? Let’s go and start our lesson.
Good Luck!
What is Energy?
When thinking about energy the following questions may come to mind:
- What is energy?
- How do we measure it?
- Where is it coming from?
- Do we have enough?
- What is the impact of energy use?
Energy is the lifeblood of any modern society. Energy is used in every walk of life. Without it, modern life would almost come to a standstill. From the moment of waking up in the morning with an alarm clock, we use energy for almost everything we do.
Energy is a property of matter that can be converted to work, heat, or radiation. It can move things or do work, produce heat even if it does not move anything, and be converted to light (or more accurately, radiation).
Lesson 1 Objectives
Upon completing this lesson, you should be able to:
- define energy
- articulate fundamental forms of energy
- know the different units of energy
- define and distinguish differences between energy and power
- classify Energy Sources
Checklist for Lesson 1
| Step | Activity | Access / Directions |
|---|---|---|
| 1 | Read the online lesson | Lesson 1 - Energy Supply and Demand |
| 2 | Review | Lesson 1 - Review & Extra Resources (supplemental materials that are optional...but informative!) |
| 3 | Take | Lesson 1 - Quiz (graded) The quiz is available in Canvas. |
Please refer to the Calendar in Canvas for specific timeframes and due dates.
Questions?
If you have any questions, please post them to the General Course Questions forum in located in the Discussions tab in Canvas. I will check that discussion forum daily to respond. While you are visiting the discussion board, feel free to post your own responses to questions posted by others - this way, you might help a classmate!
Forms of Energy, page 1 of 2
Six Basic Forms of Energy
Energy exists in a number of different forms, all of which measure the ability of an object or system to do work on another object or system. There are six different basic forms in which we use energy in our day-to-day life:
Mechanical Energy (Kinetic)
- Energy that a body possesses by virtue of its motion. A few examples are a baseball player pitching a ball, a plow being pulled by a tractor, and a hammer that is being used to pound nails.
- In the United States, we use about a third of our total energy for transportation or movement of people and goods.
Mechanical Energy (Potential)
- Energy that a body possesses by virtue of its position relative to a reference point. A few examples of mechanical energy include a pendulum, a bow (archery), a spring, and a hammer that is raised in preparation to pound nails.
Let's investigate further...
A book sitting on a shelf in the library is said to have potential energy because if it is nudged off the shelf, gravity will accelerate the book, giving the book kinetic energy. Because the Earth's gravity is necessary to create this kinetic energy, and because this gravity depends on the Earth being present, we say that the Earth-book system is what really possesses this potential energy, and that this energy is converted into kinetic energy as the book falls.
Chemical Energy
- Energy locked in the bonds of molecules in the form of microscopic potential energy, which exists because of the electric and magnetic forces of attraction exerted between the different parts of each molecule.
- It is the same attractive force involved in thermal vibrations.
- The molecular parts get rearranged in the chemical reactions, releasing or adding to this potential energy.
- Some examples include a battery, burning wood, and glucose in the body.
- As of 2020, approximately 80% of the energy used in the U.S. comes from fossil fuels such as coal, oil, and natural gas.
- All of these fuels store energy in the form of chemical energy.
- When they are burned, these fuels release energy in the form of heat or thermal energy.

The glucose (blood sugar) in your body is said to have "chemical energy" because the glucose releases energy when chemically reacted (combusted) with oxygen. Your muscles use this energy to generate mechanical force (work) and also heat.
Thermal or Heat Energy:
- Energy that combines microscopic, kinetic, and potential energy of the molecules. Some examples of this include a hot beverage and boiling water.
- Temperature is really a measure of how much thermal energy something has: The higher the temperature, the faster the molecules are moving around and/or vibrating, i.e., the more kinetic and potential energy the molecules have.
- Fuels (chemical energy) are oftentimes burned and converted to thermal or heat energy, which is then converted to motion in an automobile or electricity.
Thermal Energy
A hot cup of coffee is said to possess "thermal energy," or "heat energy," because it has a combination of kinetic energy (its molecules are moving and vibrating) and potential energy (the molecules have a mutual attraction for one another) - much the same way that the book on the bookshelf and the Earth have potential energy because they attract each other.
Forms of Energy, page 2 of 2
Electrical Energy:
- Energy created through the movement of electrons among the atoms of matter.
- Although electricity is seldom used directly, it is one of the most useful and versatile forms of energy. Following are some examples. When electricity is:
- put into a toaster, it can be converted to heat;
- put into a stereo, it is converted into sound;
- put into an electric bulb, it converts into light;
- put into a motor, it converts into motion or movement (mechanical energy).
- Due to its versatility, electricity is in high demand; in the US, about 40% of the total primary energy used is converted into electricity for various uses.
Remember This!
All matter is made up of atoms, and atoms are made up of smaller particles called protons (which have positive charge), neutrons (which have neutral charge), and electrons (which are negatively charged).
- The electrons orbit around the nucleus (which contains protons and neutrons), just like the planets orbit the sun.
- Certain metals have electrons that are only loosely attached to their atoms, so they can be easily made to move from one atom to another if an electric field is applied to them.
- When those electrons move among the atoms of matter, a current of electricity is created.
Nuclear Energy:
- Energy produced when reactions occur in an atom, resulting in some type of structural change in the nuclei.
- Fusion occurs when two small nuclei join together to create one large nucleus or particle, and during this process, energy is released in the form of light and heat. An example is in the Sun: hydrogen nuclei fuse (combine) together to make helium nuclei, which release energy.
- Fission occurs when the nucleus of one big atom splits into two new atoms, and during this process, a tremendous amount of energy is released in the form of light and heat. An example is in a nuclear reactor or the interior of the earth: uranium nuclei split apart, causing energy to be released.
Did You Know?
In both fusion and fission, some of the matter making up the nuclei is converted into energy, represented by the famous equation:
- This formula indicates that energy intrinsically stored in matter at rest equals its mass times the speed of light squared. When matter is destroyed, the energy stored is released.
- This equation suggests that an incredibly huge amount of energy is released when a small amount of matter is converted to energy.
Radiation:
- Energy radiated or transmitted in the form of rays, waves, or particles. Some examples include:
- visible light that can be seen by naked eye;
- infrared radiation;
- ultraviolet radiation (UV) that cannot be seen with the naked eye;
- long wave radiation, such as TV waves and radio waves;
- very short waves, such as x-rays and gamma rays.
Even things that we encounter in our every day life contain some radioactive material, either natural or man-made. Smoke detectors, compact fluorescent bulbs, some watches and granite countertops can emit some nuclear radiation. Even plane travel at high altitudes cause exposure from cosmic rays.
- Electromagnetic Radiation
- Energy from the sun comes to the earth in the form of Electromagnetic radiation, which is a type of energy that oscillates (side to side) and is coupled with electric and magnetic fields that travel freely through space.
- Electromagnetic radiation is composed of photons or particles of light, which are sometimes referred to as packets of energy.
- Photons, like all particles, have properties of waves.
Photons make the world a brighter place!
Photons are created when electrons jump to lower energy levels in atoms, and are absorbed when electrons jump to higher levels. Photons are also created when a charged particle, such as an electron or proton, is accelerated. An example of this phenomenon is a radio transmitter antenna that generates radio waves.
- Electromagnetic Spectrum
- The “Electromagnetic spectrum“ is a representation of the wide range of wavelengths of electromagnetic radiation.
- Photons are associated with visible light, which accounts for only a very limited part of the electromagnetic spectrum.
- A great discovery of the nineteenth century was that radio waves, x-rays, and gamma-rays are just forms of light, and that light is electromagnetic waves.
Please watch the following 5:00 video about the electromagnetic spectrum:
Something surrounds you. Bombards you. Some of which you can't see, touch, or even feel. Every day, everywhere you go. It is odorless and tasteless. Yet you use it and depend on it every hour of every day. Without it the world you know could not exist. What is it? Electromagnetic radiation. These waves spread across the spectrum from very short gamma rays to x-rays, ultraviolet rays, visible light rays, even longer infrared light waves, microwaves, to radio waves which can measure longer than a mountain range. This spectrum is the foundation of the information age and of our modern world. Your radio, remote control, text message, television, microwave oven, even a doctor's x-ray, all depend on waves within the electromagnetic spectrum.
Electromagnetic waves, or EM waves, are similar to ocean waves in that both are energy waves. They transmit energy. EM waves are produced by the vibration of charged particles and have electrical and magnetic properties. But unlike ocean waves that require water, EM waves travel through the vacuum of space at the constant speed of light. EM waves have crests and troughs like ocean waves. The distance between crests is the wavelength. While some EM wavelengths are very long and are measured in meters, many are tiny and are measured in billionths of a meter, nanometers. The number of these crests that pass a given point within one second is described as the frequency of the wave. One wave or cycle per second is called a Hertz. Long EM waves, such as radio waves, have the lowest frequency and carry less energy. Adding energy increases the frequency of the wave and makes the wavelength shorter. Gamma rays are the shortest, highest energy waves in the spectrum. So, as you sit watching TV, not only are there visible light waves from the TV striking your eyes, but also radio waves transmitting from a nearby station; and microwaves carrying cellphone calls and text messages; and waves from your neighbors Wi-Fi and GPS units in the cars driving by. There's a chaos of waves from all across the spectrum passing through your room right now.
With all of these waves around you, how can you possibly watch your TV show. Similar to tuning a radio to a specific radio station, our eyes are tuned to a specific region of the EM spectrum and can detect energy with wavelengths from 400 to 700 nanometers. The visible light region of the spectrum. Objects appear to have color because EM waves interact with their molecules. Some wavelengths in the visible spectrum are reflected and other wavelengths are absorbed. This leaf looks green because EM waves interact with the chlorophyl molecules. Waves between 492 and 577 nanometers in length are reflected and our eye interprets this as the leaf being green. Our eyes see the leaf as green but cannot tell us anything about how the leaf reflects ultraviolet, microwave, or infrared waves.
To learn more about the world around us, scientists and engineers have devised ways to enable us to see beyond that sliver of the EM spectrum called visible light. Data from multiple wavelengths help scientists study all kinds of amazing phenomena on Earth from seasonal change to specific habitats. Everything around us emits, reflects, and absorbs EM radiation differently based on it's composition. A graph across the EM spectrum is called the spectral signature. Characteristic patterns like fingerprints within the spectra allow scientists to determine an object's chemical composition and to determine such physical properties as temperature and density.
NASA's Spitzer space telescope observed the presence of water and organic molecules in a galaxy 3.2 billion light years away. Viewing our sun in multiple wavelengths with the SOHO satellite allows scientists to study and understand sunspots that are associated with solar flares and eruptions that are harmful to satellites, astronauts and communications here on Earth.
We are constantly learning more about our world and universe by taking advantage of the unique information contained in the different waves across the EM spectrum.
As depicted in the image above, the lower the energy, the longer the wavelength and lower the frequency, and vice versa.
The reason that sunlight can hurt your skin or your eyes is because it contains "ultraviolet light," which consists of high energy photons. These photons have short wavelength and high frequency, and pack enough energy in each photon to cause physical damage to your skin if they get past the outer layer of skin or the lens in your eye.
Radio waves, and the radiant heat you feel at a distance from a campfire, for example, are also forms of electromagnetic radiation, or light, except that they consist of low energy photons (long wavelength and high frequencies - in the infrared band and lower) that your eyes can't perceive. This was a great discovery of the nineteenth century - that radio waves, x-rays, and gamma-rays are just forms of light, and that light is electromagnetic waves.
About 20% of the electricity used in the US is used to produce visible light for lighting purposes.
Activity: Identifying Forms of Energy
Can you identify the different forms of energy in the picture below? Enter your answer in the table below and click the "Check Answers" button to check your work.
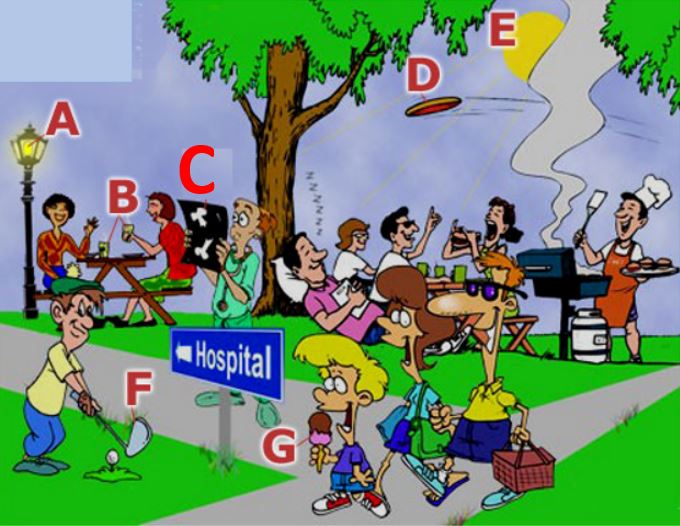
These things, listed below, represent the six fundamental forms of energy: Mechanical, Chemical, Thermal/Heat, Electrical, Nuclear and Radiation. Your task is to determine what form of energy is represented by each item.
- Light bulb in a lamp post powered by?
- Two women sitting at a picnic table drinking water. The arrow is pointing to the cups of water. One cup is sitting on the table and the other is in a woman's hand.
- A doctor looking at an X-ray produced with?
- A Frisbee flying through the air powered by?
- The sun power by?
- A man getting ready to hit a golf ball with a golf club. The arrow is pointing at the head of the golf club which is powered by?
- A little boy eating an ice cream cone. The arrow is pointing to the ice cream that provided what to the child?
Now spend some time trying to identify the different forms of energy that are at work in the above items. Once you have thought through this and have some answers, read on to see if you are correct.
AnswersLight bulb in a lamp post - Electrical Energy
Cups of water. One is sitting on a table and the other is in a woman's hand. - Thermal or Heat Energy
An X-ray - Nuclear Energy
A Frisbee flying through the air - Mechanical (kinetic) Energy
The sun - Radiation
A golf club getting ready to hit a ball - Mechanical (Potential)
The ice cream in an ice cream cone - Chemical
Energy Conversion
Energy can be converted from one form to another.
Examples:
- Gasoline (chemical) is put into our cars, and with the help of electrical energy from a battery, provides mechanical (kinetic) energy.
- Purchased electricity is fed into our TVs and is converted to light and sound.
- Similarly, purchased electricity goes into an electric bulb and is converted to visible light and heat energy.
- The image below shows examples of more conversions.
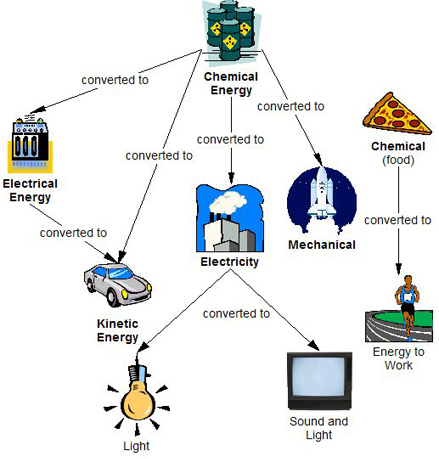
Chemical Energy is converted to Electrical Energy (stove), Kinetic Energy (car), Electricity (power plant), and Mechanical Energy (space shuttle). Electrical Energy is converted to Kinetic Energy. Electricity is converted to Light (light bulb) and Sound and Light (TV). Chemical food energy is converted to Energy to Work (person running).
Activity: Day-to-Day Conversion Devices
Activity: Day to Day Conversion Devices
Most of the day-to-day devices that we use are energy conversion devices. In this activity, you will identify the fundamental form of energy that is put in to each device and the output form of energy that is a result.
Your task is to look at six devices and decide what form of energy is the input and which is the output form of energy. Think about your answers carefully before reading ahead to the answers.
- Lawn Mower input form of energy? Output form of energy?
- Computer input form of energy? Output form of energy?
- Sun input form of energy? Output form of energy?
- Tree input form of energy? Output form of energy?
- Gas Furnace input form of energy? Output form of energy?
- Hair Dryer input form of energy? Output form of energy?
| Device | Input form of Energy | Output form of energy | |
|---|---|---|---|
| 1 | Lawn Mower | Chemical | Mechanical or kinetic |
| 2 | Computer | Electrical | Light and Sound |
| 3 | Sun | Nuclear | Radiant |
| 4 | Tree | Radiant | Chemical |
| 5 | Gas Furnace | Chemical | Thermal or Heat |
| 6 | Hair Dryer | Electrical | Heat or Electric |
Measurement of Energy
Units of Measurement
How is energy measured? It is measured in various units by various industries or countries, in much the same way as the value of goods is expressed in Dollars in the U.S. and Yen in Japan and Pounds in Britain.
The table below identifies different units for measuring energy. A lot of it also has some historical context. Our early studies of energy involved heating things up, so we name units based on how hard it was to heat things. Makes sense, right? Now we pass electrical energy to operate many devices, so now we use units that "better" capture this process.
| Unit | Definition | Used In | Equivalent to |
|---|---|---|---|
| British Thermal Unit BTU | A unit of energy equal to the amount of energy needed to raise the temperature of one pound of water by one degree Fahrenheit. Equivalent to energy found in the tip of a match stick. | Heating and Cooling industries | 1 BTU = 1,055 Joules (J) |
| calorie or small calorie (cal) | The amount of energy needed to raise the temperature of one gram of water by one degree Celsius. | Science and Engineering | 1 calorie = 0.003969 BTUs |
| Food Calorie, Kilocalorie or large calorie (Cal, kcal, Calorie) | The amount of energy needed to raise the temperature of one kilogram of water one degree Celsius. The food calorie is often used when measuring the energy content of food. | Nutrition | 1 Cal = 1,000 cal, 4,187 J or 3.969 BTUs |
| Joule (J) | It is a smaller quantity of energy than calorie and much smaller than a BTU. | Science and Engineering | 1 Joule = 0.2388 calories and 0.0009481 BTUs |
| Kilowatt Hour (kWh) | An amount of energy from the steady production or consumption of one kilowatt of power for a period of one hour. | Electrical fields | 1 kWh = 3,413 BTUs or 3,600,000 J |
| Therm | A unit describing the energy contained in natural gas. | Home heating appliances | 1 therm = 100,000 BTUs |
Did You Know?
When writing BTUs, one uses a base of “10” raised to a particular exponent.
For example:
More specific notation involves the following:
To express measurements greater than those with a base of 10, you would do the following:
Here is a fun way to understand your energy use
Prof. Bruce Logan of Penn State published a fascinating way to view your energy and climate impact. Using what you learned in this section, you can start to piece together just how much energy each of us uses to maintain our busy lifestyles.
The premise of this approach is to define (another!) unit of energy, but one with a bit more meaning. The daily energy unit, D. We are all supposed to eat about 2000 food Calories a day to survive. So, let’s set this amount of energy to equal 1 D. Now, how many Ds does the typical U.S. home each day (normally in KWh) or operate a car (normally joules or BTUs )? This method of comparing energy consumption allows us to better understand the scale of our energy habits (which might be shocking!) and tell you how many big mac-powered humans it would take to do what your car does…
Here are a few examples he shows to give you an idea.
- Food for 1 day = 1 D
- Running a single 100 W light bulb all day = 1.03 D
- Average daily electricity use for a US house = 13 D
- 1 gallon of gasoline used in an average car (goes 18 miles) = 15.2 D
- Natural gas for daily heating a US house = 31 D
Once we tally up all the energy it takes to fuel our lifestyle (professional + personal uses), each person consumed about 101 D of energy! (remember this is daily) For comparison, a Swiss citizen consumes about 54 D. Check out his website for more comparisons. Watch this video (5 min 46 sec)
Energy Literacy The daily energy unit "D"
By Bruce Logan Penn State University.
If we want to communicate we need to speak the same language. How can we do that, well we translate it into something we know, into one common language. If you want to communicate when it comes to energy, how do we do that. We translate it into something that we know. Something we all know is that we need about 2,000 calories a day to live. That's something we can relate to. But how do we relate that to other things that either consume energy or produce energy in our lives.
Well, for example, if I were to take that 2,000 calories a day that I eat and use that energy to power 100 watt light bulbs, how many could I power. 3 4 5 10? The answer is just one light bulb. A single light bulb running continuously consumes the equivalent of about 2,000 calories a day.
Now if you look at all the things that we encounter in our lives in terms of energy units, so many of them have different units. For example 2,000 calories with a capital C is really 2,000 kilocalories. Daily food for a horse is 20,000 kilocalories. The energy in a gallon of gasoline 114 thousand BTUs or British thermal units. Or maybe you look at the engine in your car and it's 120 horsepower.
How can we understand these units. Well, one way is we could put them all on the basis of a kilowatt hour. However, look at those numbers. They're all still rather confusing and it's tough to relate to a kilowatt hour. So we need to find something that's not quite so confusing.
I propose that we define 2,000 calories a day, or the food that one person eats, as the unit 1D. One daily energy unit. If we use that unit, we could say well, our home uses 13D. Or while we eat 1D, a horse needs to eat 10D. The energy in a gallon of gasoline is about 14D.
So this common unit of D, allows us to now compare all these things in terms of something that we know, that is how much food we need to stay alive. And that unit of 1D is the same to everybody on the planet. Some people need a little bit more some people need a little bit less, but the general concept of the food we eat every day can help define what energy consumption is like.
So when you look at things now, for example, you can see the electricity that we consume per capita, not necessarily just in your home, but averaged across to all people in the US, is about 40 D, and all energy normalized per person in the U.S. is about 104 D. That makes this unit of D very nice because it ranges for the food and other activities up to about a maximum of about a hundred.
Look at your car which say gets 18 miles per gallon and your commuting 18 miles. Your commute costs you about 14D, 1 gallon of gas. If you were to travel in a more fuel-efficient car, say a Toyota Prius or something like that, that commute might only take 4.9D because you would use less gasoline. Or what if you used an electric car. Well to charge that car and use the energy in that battery, it's about 27 kilowatt hours to go 100 miles or 2.1D.
Let's say that you want to put solar panels on your house. Well each solar panel produces 0.43D. That means averaged over the day and with typical sunlight, and for example Pennsylvania, you would achieve about 0.43 D of energy capture out of each one of those panels. So if your house uses 13D, well you need about 30 solar panels. If your car is an electric car and it uses 2.1 D, then your commute needs about 2.1D or about 5 or 6 solar panels.
How much energy should we use. Well there's a study done by ETH Zurich which suggests a 2,000 watt Society. 2,000 watts is about 20D. Currently, Switzerland has the average population having about 53 D which is about half of what we consume in the U.S., which is about 104D. So if we're gonna have to try and reduce our energy consumption that's gonna have to go down quite a lot.
Going forward, how can we do that. Well, can you reduce the energy for your commute. Can you save more energy at home or energy you say for transport or food or put a solar panels on your house and reduce your consumed D.
So the question really is, going forward, how can we make that 20D green.
Thanks for listening and I hope that you find a way to use D in your life to understand the energy you can see.
Sources of Energy
Energy is stored and is available in different forms and sources. The ~24,000 times more solar energy that is available than we need is not in a readily usable form. It needs to be concentrated.
For example, when oil (a concentrated fuel) is burned with air, the resulting gases can reach high temperatures. Solar energy, as it is, is not concentrated and cannot reach those high temperatures. Therefore, we use more concentrated energy sources. These sources are divided into two groups—renewable and nonrenewable.
Renewable Energy Sources:
- Energy sources that can be replenished over and over again; they are never depleted. Some examples include hydropower, solar, wind, tidal, geothermal energy from inside the earth, biomass from plants, and nuclear fusion.
- These types of energy sources are usually converted into electricity or thermal (heat) energy.
Nonrenewable Energy Sources:
- Energy sources that we are using up and cannot produce in a short period of time. Some examples include fossil fuels (Petroleum Oil, Natural Gas, and Coal), Tar Sands, and Nuclear Fission.
- Another nonrenewable energy source is the element uranium, whose atoms we split (through a process called nuclear fission) to create heat, and ultimately, electricity.
- These types of energy sources are usually converted into electricity and mechanical energy.
- We get most of our energy from these nonrenewable energy sources.
Did You Know?
They're called fossil fuels because they were formed over millions and millions of years by the action of heat from the Earth's core and pressure from rock and soil on the remains (or 'fossils') of dead plants and animals.
Fossil Fuel Distribution
Fossil fuels, non-renewable energy sources formed over a million years, are not distributed uniformly over the earth’s surface. Depending on the climate conditions millions of years ago, certain parts of the land masses were favorable for organic matter to grow and thrive.
Over geological ages, these land masses moved, and certain regions are richer in fossil fuels than others. Review the information on the map below, and then answer the questions below the map based on your observations.
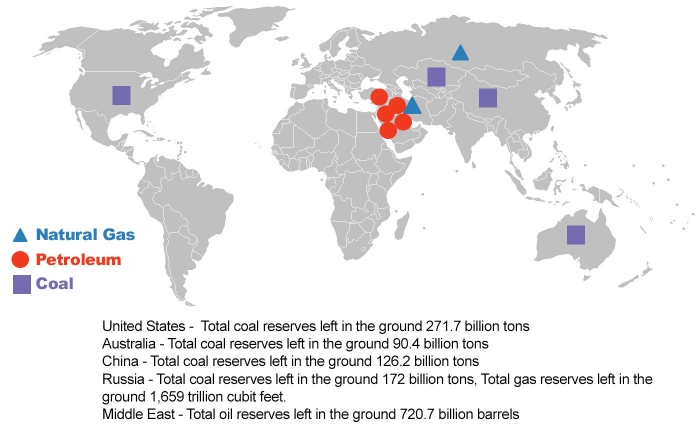
Click link to expand for a text description of the image
Global Distribution of Natural Resources
The most abundant resources for various global regions are as follows:
- China is richest in coal
- Australia is richest in coal
- The Middle East is richest in petroleum
- The United States is richest in coal
- Russia is richest in natural gas
Human Use of Energy Sources
The activity below is a drag and drop. Select the items listed in the center of the image and drag them to the corresponding or matching energy type listed on the side.
Human use of Energy Sources
The following eight items are examples of how renewable and nonrenewable energy sources are used. Take some time to decide if each example is renewable or nonrenewable and then describe its specific source. (wind, sun, geothermal, water, oil, natural gas, uranium, or coal).
The answers will be at the bottom of the page.
- Nuclear power plant
- Gas stove
- Dam
- Gas pump
- Geothermal heat pump
- Power lines
- Solar panels
- Windmills
ANSWERS:
- Nuclear power plant is a nonrenewable energy source using uranium as its source.
- The gas stove is an example of nonrenewable energy source that uses natural gas as its source.
- A dam is an example of a renewable energy source that uses water as its source.
- A gas pump is an example of a nonrenewable energy source that uses petroleum as its source.
- A geothermal heat pump is a renewable energy source that uses geothermal heat (ground heat) as its source.
- Power lines are an example of a nonrenewable energy source that uses coal as its source.
- Solar panels are a renewable energy source that use the sun as their source.
- Windmills are a renewable energy source that use the wind as their source.
Power
What is Power?
Click the "play" button below and observe what happens. (Note: The video has no audio.)
Power vs. Energy
Both cyclists did the same amount of work (they both pedaled 10 miles), and used the same amount of energy (218 calories). The blue cyclist, however, demonstrated the most power, because he did the equivalent amount of work as the red cyclist, but in a faster time.
Power is the rate at which we do work.
Energy is the capacity to do work.
Work is the amount done.
Measuring Power
Units of Power are not the same as units of energy (i.e., Btus, calories). Units of power are measured in terms of units of energy used per some unit of time.
Examples of Units of Power include:
- Watt (W) = 1 joule of energy per second or 1 J/S
- BTU per hour (BTUs/h) = 1,055J
- Horsepower (hp) = 550 foot-pounds per second or 550 ft lb/S
- Calories per second (cal/sec)
- Kilowatt (kW) = 1,000 watts
Calculating Power
Power can be determined by the following formula:
Example
On a winter day, a home needs 1 x 10⁶ or 1,000,000 BTUs of fuel energy every 24 hours to maintain the interior at 65° F. At what rate is the energy being consumed in Watts?
If 1 J/s = 1 Watt, and 1,000 Watt = 1kW, then 12,200 J/s = 12,200 Watts = 12.2 kW
To solve this problem, you must realize the following: You know the Power (1,000,000 BTUs/24 hours) and the time (24 hours), so you need to solve for Energy. The measurements must be consistent, so the BTUs should be converted to a consistent measure, such as Joules:
If using Joules per second instead of watts, you must convert 24 hours into seconds or divide it by the number of seconds in an hour (3,600).
Image Credit: © Penn State University, is licensed under CC BY-NX-SA 4.0
Power & Cost of Energy
We can also use a version of the Power formula to determine Cost of Energy:
Example
If a 100 W light bulb is accidentally left on overnight (8 hours), how much energy does it consume?
How much energy does this cost, if electricity costs 10 cents per Kilowatt?
Energy Use of Home Appliances, page 1
Calculating Energy Use
How is energy use of Home Appliances calculated?
You just learned in a previous discussion on power that:
or
By modifying this formula slightly, we can determine Energy Consumption per Day:
Where:
- Energy Consumption will be measured in Kilowatt hours (kWh) - like on your utility bills.
- Power Consumption will be measured in Watts
- Hours used per Day will be the actual time you use the appliance.
Since we want to measure Energy Consumption in Kilowatt hours, we must change the way Power Consumption is measured from Watts to Kilowatts (kWh). We know that 1 kilowatt hour (kWh) = 1,000 Watts hours, so we can adjust the formula above to:
Example 1: Calculating Energy Use of a Ceiling Fan
If you use a ceiling fan (200 watts) for four hours per day, and for 120 days per year, what would be the annual energy consumption?
Use this formula:
Energy Consumption / Day (kWh) = Power Consumption ( Watts / 1000) × Hours Used / Day
Energy Consumption per Day (kWh) = (200 / 1000) × 4 (hours used per day)
Energy Consumption per Day (kWh) = (1/5) × 4
Energy Consumption per Day (kWh) =4/5 or 0.8
So the Energy Consumption per Day is 0.8 kWh To find out energy for 120 days, do simple multiplication: 0.8 x 120 = 96 kWh
Example 2: Calculating Annual Cost of a Ceiling Fan
If the price per kWh for electricity is $0.0845, what is the annual cost to operate the ceiling fan?
Want Another Example?
If you use a personal computer (120 Watts) and monitor (150 Watts) for four hours per day, and for 365 days per year, what would be the annual energy consumption?
So the Energy Consumption per Day is 1.08 kWh. To find out energy for 365 days, do simple multiplication:
The annual cost if electricity is $0.0845 per kWh would be:
Energy Use of Home Appliances, Page 2, Practice
What is the energy consumption of a refrigerator with a wattage rating of 700 Watts when it is operated for 24 hours a day?
Step 1
To solve, use the following formula:
Where:Energy Consumption = Watt Hours (Wh) or KiloWatt Hours (kWh)
Power Consumption = Watts (W) or kW (KiloWatts)
Number of Hours Operated = Hours (h) For the example above:
Energy Consumption = 700 W x 24 h
Energy Consumption = 16800 W h
Step 2
To convert from Wh to kWh, remember that 1kWh = 1000 Wh
To solve, set up as a ratio and use linear algebra to solve for ?.
Practice Problem
Use the following link to generate a random practice problem.
Energy Use of Home Appliances, Page 3
Locating Wattage
You can usually find the wattage of most appliances stamped on the bottom or back of the appliance, or on its "nameplate." The wattage listed is the maximum power drawn by the appliance. Since many appliances have a range of settings (for example, the volume on a radio), the actual amount of power consumed depends on the setting used at any one time.

A refrigerator, although turned "on" all the time, actually cycles on and off at a rate that depends on a number of factors. These factors include how well it is insulated, room temperature, freezer temperature, how often the door is opened, if the coils are clean, if it is defrosted regularly, and the condition of the door seals.
To get an approximate figure for the number of hours that a refrigerator actually operates at its maximum wattage, divide the total time the refrigerator is plugged in by three.
The table below shows wattage of some typical household appliances.
| Appliance | Wattage (range) |
|---|---|
| Clock Radio | 10 |
| Coffee Maker | 900 - 1200 |
| Clothes Washer | 350 - 500 |
| Clothes Dryer | 1800-5000 |
| Dishwasher | 1200-2400 |
| Hair Dryer | 1200-1875 |
| Microwave Oven | 750-1100 |
| Laptop | 50 |
| Refrigerator | 725 |
| 36" Television | 133 |
| Toaster | 800-1400 |
| Water Heater | 4500-5500 |
| Appliance | Wattage |
|---|---|
| Aquarium | 50 - 1210 |
| Clock Radio | 10 |
| Coffee Maker | 900 - 1200 |
| Clothes Washer | 350 - 500 |
| Clothes Dryer | 1800-5000 |
| Dishwasher | 1200 -2400 (using the drying feature greatly increases energy consumption) |
| Dehumidifier | 785 |
| Electric Blanket - Single/Double | 60 / 100 |
| Fan - ceiling | 65 - 175 |
| Fan - window | 55 - 250 |
| Fan - furnace | 750 |
| Fan - whole house | 240 - 750 |
| Hair Dryer | 1200 - 1875 |
| Heater (portable) | 750 - 1500 |
| Clothes Iron | 1000 - 1800 |
| Microwave Oven | 750 - 1100 |
| Personal Computer - CPU - awake / asleep | 120 / 30 or less |
| Personal Computer - Monitor - awake / asleep | 150 / 30 or less |
| Laptop | 50 |
| Radio (stereo) | 70 - 400 |
| Refrigerator (frost free, 16 cubic feet) | 725 |
| 19" Television | 65 - 110 |
| 27" Television | 113 |
| 36" Television | 133 |
| 53" - 61" Projection TV | 170 |
| Flat Screen TV | 120 |
| Toaster | 800-1400 |
| Toaster Oven | 1225 |
| VCR / DVD | 17 - 21 / 20 - 25 |
| Vacuum Cleaner | 1000 - 1440 |
| Water heater (40 gallon) | 4500 - 5500 |
| Water pump (deep well) | 250 - 1100 |
| Water bed (w/heater, no cover) | 120 - 380 |
Amperes and Voltage
of the amp meter.
The image shows an ammeter cycling through five different measurements. 118.9 Volts, 7.49 Amps, 885 Watts, 59.9 Hertz, and 0.01 Kilowat Hours.
is licensed under CC BY-NC-SA 4.0
If the wattage is not listed on the appliance, you can still estimate it by finding the current draw (in amperes) and multiplying that by the voltage used by the appliance.
Most appliances in the United States use 120 volts. Larger appliances, such as clothes dryers and electric cooktops, use 240 volts. The amperes might be stamped on the unit in place of the wattage.
If not, find an ammeter to measure the current flowing through it. You can obtain this type of ammeter in stores that sell electrical and electronic equipment.
Take a reading while the device is running; this is the actual amount of current being used at that instant.
Phantom Loads
Also note that many appliances continue to draw a small amount of power when they are switched "off."
These "phantom loads" occur in most appliances that use electricity, such as VCR, televisions, stereos, computers, and kitchen appliances.
Most phantom loads will increase the appliance's energy consumption a few watts per hour. These loads can be avoided by unplugging the appliance or using a power strip and using the switch on the power strip to cut all power to the appliance.
Review & Extra Resources
Review
Watch this 3 minute 41 second video review Lesson 1
Hello everyone. Dr hall here.
So what we have collected here is a review sheet to help you identify some of the key facts and pieces of information that we covered in the first lesson.
One of the most important things that we covered is that there are six forms of energy and I hope throughout this lesson you will understand each of these and what they represent and you can identify some examples.
Next it's important to note that the forms of energy can be converted from one to another right. So we can go from chemical energy to thermal energy and vice versa depending on the process we're using. Another important factor is that there are some key units that we use to understand energy and quantify and we will switch between a lot of these throughout the course. Some of these are BTUs calories with a capital C, calories with a lowercase c joules kilowatt hours and therms. So each of these are important and quite often used in different fields so you have to be comfortable with each of these because you'll likely see it many times many different circumstances.
So there are also units of power which is distinctly different from energy and that's important to understand and appreciate the difference. The units for power are watts, kilowatts, joules per second, horsepower, and calories per second.
We also touched on the sources of energy some of them are renewable and here we define renewables those that can be replenished over and over again and are not depleted. Some examples of those are hydropower solar wind tidal and geothermal energy. There are also non-renewable sources and the way we define these is that they cannot be replenished over and over again in a reasonable amount of time. Some of these include fossil fuels tar sands and nuclear fission. So they rely on finite sources that take a long time to form. And as a part of our sources of energy section we also covered fossil fuel distribution uh across the world and in the us so that you can understand where these finite resources are and how much we have.
So in covering all of these previous topics you'll also note that there are a few important definitions. Power is the rate at which we do work right so it's how much work we can get done in a given amount of time. Energy is our capacity to do work and work is the amount of things that we get done. And many of these are interrelatable so for example power is energy divided by some period of time. Energy is power multiplied by a duration of usage. And energy consumption per day is equal to power consumption times those hours used within a day.
So i think if you focus on each of these key concepts here and the fact sheet provided to you I think you'll find them easier and there will also be some practice questions in which these concepts will help okay. So please study this practice the practice questions frequently frequently and when you're ready please proceed to the quiz.
Okay, good luck everyone.
Review Sheet - Energy and Society
- Forms of Energy
- Mechanical energy
- Potential Energy
- Kinetic Energy
- Chemical Energy
- Thermal or Heat Energy
- Electrical Energy
- Nuclear Energy
- Fission
- Fusion
- Radiation
- Mechanical energy
- Electromagnetic Spectrum
- The lower the energy, the longer the wavelength and lower the frequency, and vice versa
- Energy can be converted from one form to another
- Units of Energy
- BTU, Calorie, calorie, Joules, kWh, Therm
- Food Calorie (usually written with 'C')
- calorie (usually written with 'c')
- 1 Food Calorie = 1000 calories
- Units of Power
- Watts
- kW (kilo-watts)
- J/s
- HP
- cal/s
- Sources of Energy
- Renewable
- Can be replenished over and over again; they are never depleted
- Hydropower, Solar, Wind, Tidal, Geothermal energy from inside the earth, Biomass from plants, Nuclear Fusion
- Non-renewable
- Cannot be replenished over and over again; they get depleted
- Fossil fuels, Tar Sands, Nuclear Fission
- Fossil Fuel Distribution
- US has a lot of Coal reserves
- Middle East has a lot of petroleum reserves
- Renewable
- Definitions
- Power is the rate at which we do work
- Energy is the capacity to do work
- Work is the amount done
- Power = Energy / Time
- Energy = Power x Duration of Usage (time)
- Energy consumption/day = Power consumption x hrs used/day
Extra Resources
For more information on topics discussed in Lesson 1, see these selected references:
Lesson 1 Deliverable
Deliverable
You must complete a short quiz that covers the reading material in lesson 1. The Lesson 1 Quiz can be found in the Lesson 1: Energy and Society module in Canvas. Please refer to the Calendar in Canvas for specific time frames and due dates.
Lesson 2: Energy Supply and Demand
The links below provide an outline of the material for this lesson. Be sure to carefully read through the entire lesson before returning to Canvas to submit your assignments.
Introduction
Welcome to Lesson 2!
You are already to Lesson 2: Energy Supply and Demand. These energy supply and demand lessons will explore more about energy resources. Basically, you will be able to appreciate global and national consumption patterns. We will go over what kinds of energy we have been consuming, how much we have been consuming, and how we compare with the rest of the world, etc., over the past few decades. Based on those patterns, we can also deduce some information about how much energy we use to do a job; energy intensity. What kind of energy sources we will be needing, and how much we will be needing based on the past trends?
We will also look at energy reserves. Do we have those? Will we need more renewables, batteries, coal, more oil, or more gas? Can we (sustainably) use any of those resources? If we can, great, if not, what do we do? We will be doing those kinds of energy analysis. So, obviously, you are going to see a lot of numbers and statistics. One of the questions that I always get is: Hey, do I have to remember all these numbers? In 2023, petroleum and natural gas accounted for 77% of energy consumption in this country, and renewables accounted for 21% of the electricity generated by utility companies.
The most recent energy data is available from the EIA U.S. Energy Facts Explained.
Do we have to remember these numbers? My advice is, you don’t have to remember everything but you need to get the main message behind these numbers. In other words, you have to know the fact that petroleum and natural gas are the main energy sources. Similarly, over 75% of our oil products or petroleum products are used for transportation. So, we need to know that transportation is basically run by petroleum; petroleum is mostly used for transportation. That is the message. You don’t need to remember the exact numbers. But if there is something that has very insignificant or significant quantities, you should note that. For example, renewable energy sources supply about 10% of our energy source. That is the message. You don’t need to worry about whether it is 9.2 or 9.5 or 8.5 or 11.2%. So just to give you a clue, you don’t have to worry about the exact numbers, but the message that is conveyed using these numbers is what you have to concentrate on. And we will also have one numerical type of problem in this lesson. That problem will be predicting the energy needed for the future. The problem follows an exponential function, and we will talk about that, and there will be a few numerical problems for you to practice.
See the Calendar tab in Canvas for due dates/times.
Questions?
If you have any questions, please post them to the General Course Questions forum in located in the Discussions tab in Canvas. I will check that discussion forum daily to respond. While you are visiting the discussion board, feel free to post your own responses to questions posted by others - this way, you might help a classmate!
Global Energy Consumption
In 2024, the world wide energy consumption was about 186,000 TWhs (or 635 Quadrillion BTUs). The energy mix used by the whole world is shown below in the figure from Our World in Data. This figure is interactive, so you can slide the bar across and see how that information changes over time. The largest energy source for the whole world is Oil, followed by Natural Gas and Coal. This means most of the world's energy comes from fossil fuels. If you slide the bar around, you can see how renewable has begun to steadily increase in the past decade or more.
Energy consumption numbers are always reported a few years behind, so we are always looking into the past before we plan for the future. As of 2024, The world's total primary energy consumption was about 186,000 TWhs (635 Quadrillion Btus).
The figure below shows how energy use is used per person (or per capita). You can see which countries have the highest energy use per person, in the dark red. The US is one of the highest consumers (but not the highest). Which country do you think is the highest user of energy per capita?
You can also explore this data, to see how it has changed over time. One major change over time is with China, which starts the time-laspe as about 1,000 kWh/ per person and ends the time-lapse at over 30,000kWh/per person.
- Do you expect this number to steadily increase?
- What do you expect to happen to India in the next 10 years?
- Do you think US energy use has increased, decreased or stayed the same over time?
Please click on the "Explore the data" for more analysis of each country over time.
The productivity of a country is measured by the total value (dollars) of goods and services, called Gross Domestic Product (GDP), produced by its people. Therefore, the average value of goods and services produced by each person - the GDP per capita of a country - is an indicator of the quality of life. The chart below shows the relationship between GDP and energy use per capita. While there are some outliers, the trend tends to have an upwards diagnonal shift. Click on the explore the data and you can filter the data by income group or country.
- What do you notice about the countries in the upper right corner of the chart?
- What do you notice about the countries in the lower left corner?
- Do you notice any similarities between the countires (Qatar, Brunei, Bahrain, Kuwait and Oman) at the very top of the chart? Where are they located?
Global Energy Consumption and GDP per person
In general, as the GDP (Gross Domestic Product) per person of any country increases, the amount of energy that is consumed is also expected to increase.
- For high income countries, the correlation is much stronger.
- For low income countries, the correlation is weak.
For example, Iceland, Denmark and the United States all have with similar GDP per capita. However, they each have significant differences in energy consumption per capita. In other words, to produce one dollar's worth of goods and services, the U.S. uses twice the energy of the Denamrk. Similarly, Iceland uses five times the energy of the Denmark.
Energy Consumption Differences
The differences in energy consumption among countries are the result of:
- efficiency of industrial, transportation, commercial, and residential energy,
- climatic and geographical areas of a country,
- lifestyles (use of more gas guzzling cars and SUVs and bigger sized houses), and
- the nature of the products produced by the nation's industries.


Click here to see Global Average Change in Energy Production by Fuel and determine production of energy which energy sources decreased over the last 5 decades.
World Energy Outlook
The world energy requirements are projected by several energy companies such as British Petroleum and Exxon Mobil and international agencies like International Energy Agency (IEA) and US Energy Information Administration (EIA). The International Energy Outlook is published every two years and looks at the long term energy outlook. This edition of the International Energy Outlook explores expected energy use through 2050. Global energy related CO2 emissions are expected to increase through 2050, however the projections expect a shift from fossil to non-fossil energy sources.
- International Energy Agency
- British Petroleum
- Exxon Mobil
- US Energy Information Administration (EIA)
According to International Energy Outlook 2023,
- Global electricity generation will increase by 30-76% by 2050. Most new geneartion will be zero-carbon technologies. Electricity generation by fossil fuels are expected to decrease through 2050.
- Electric vehicles are expected to account for 29%-54% of all new vehicles sales (globally) by 2050.
- Population growth in African, India and other Asia-Pacific countries will drive energy growth.
- Global average annual GDP is expected to grow at 2.6% from 2022-2050.

Asia is heavily populated and continues to grow at a rapid pace. As a result, industrial growth has also increased, requiring a need for more energy. The world population is expected to reach 9.6 billion by 2050.
Current and Future Energy Sources of the World
The figure below shows the per capita energy consumption for each country. The energy sources are also split out, so you can see where each country gets their energy. The US consumes the most energy per person. Interact with the graph and answer the following questions.
- What country is #2 energy consumer per capita?
- What is the average energy consumption per capita for the average citizen of the world?
- What source of energy is the highest for a citizen of China?
The figure below shows the Global Primary energy consumption by souce. This shows how the world wide energy sources have changed over time. As you explore the data, answer the following questions.
- What was the primary world-wide energy source prior to 1860s?
- What is the primary world-wide energy source today?
- In what year do you see Nuclear become an energy source?
- What renewable energy source is the largest percentage of world-wide energy?
Fossil Fuel Consumption
| Source | Future Outlook | Advantages / Disadvantages |
|---|---|---|
| Oil | Over the past four decades, oil has been the world's foremost source of primary energy consumption, and it is expected to remain in that position throughout the projected time frame. Liquids (primarily oil and other petroleum products) are expected to continue to provide the largest share of world's energy consumption over the projected period. | In the transportation sector, in particular, liquid fuels continue to provide most of the energy consumed. The increase of electric vehicles is expected to reduce the demand of gasoline products, but jet fuel is expected to increase through 2050. |
| Natural Gas | Natural gas is the fastest-growing fossil fuel globally; consumption grows from 153 quads in 2022 to a range of 170 quads to 241 quads by 2050 across cases, an 11% to 57% increase. Growth in natural gas consumption is widely distributed regionally, but it is most notable in India, the Other Asia-Pacific region, China, Africa, Russia, the Middle East, and the Other Americas region. The projected rise in natural gas consumption is most pronounced in the electric power sector, where it replaces retiring coal-fired generation, and the industrial sector, where it primarily fuels expanding industrial production. | It is seen as the desired option for electric power, given its relative efficiency and environmental advantages in comparison with other fossil energy sources.
Natural gas burns more cleanly than either coal or oil, making it a more attractive choice for countries seeking to reduce greenhouse gas emissions. |
| Coal | Starting from 166 quads in 2020, global coal consumption grows in some cases while it decreases in others. From 2022 to 2050, the largest growth (19%) is in the High Economic Growth case, and the largest decrease (13%) in coal consumption is in the Low Economic Growth case. Coal consumption varies by region, increasing in Africa, India, and the Other Asia-Pacific region and decreasing in China and the United States. | Coal remains a vital fuel for world’s electricity markets and is expected to continue to dominate energy markets in developing Asia. |
Energy Consumption and Electricity Projections
According to the International Energy Outlook (2023), global electricity genration will increase through 2025, however most of generation will be produced from renewable (zero carbon) technologies. The combined share of fossil fuels (coal, petroleum and natural gas) is expected to decrease. They also predict that electric vehicles are expected to account for 29%-54% of all new vehicles sales by 2050. China and Western Eurpoe are leading the switch to Electric Vehicles.

US Energy Information Administration, International Energy Agency. 2020.

US Energy Information Administration, International Energy Agency. 2020.
As can be seen from the figures, the role of renewables is expected to change dramatically in the coming years.
Nuclear Power
Worldwide, electricity generation from nuclear power is projected to remain largely unchanged into 2040. However, some advancements in small modular reactors (SMRs) may drive an increase in nuclear energy production in the upcoming decade.
In 2025, five countries account for more than 2/3s of the world's total nuclear electricity generation.
| Country | Net Capacity in Gigawatts |
|---|---|
| US | 97 |
| France | 63 |
| China | 55 |
| Russia | 27 |
| South Korea | 26 |
| Rest of world | 108 |
In a nuclear plant, heat is produced by nuclear fission (splitting of an atom's nucleus into many new atoms) inside uranium fuel. As a result of fission, heat energy is released and the steam spins a turbine generator to produce electricity.
Renewables
Sizable growth in the world’s consumption of renewable energy resources is projected over the next 25 years. Much of the projected growth in renewable generation is expected to result from the completion of renewable energy installabtions all throughout the world. In 2020, 90 % of all new electric power generation installations were renewable across the globe.
In hydroelectricity, mechanical energy from the water being pulled downward by gravity is converted to electrical energy. More specifically, a hydroelectric generator directs the flow of water through a turbine, which extracts the kinetic energy from the movement of the water and turns it into electricity through the rotation of electrical generators. Hydropower is the largest single renewable electricity source today, providing 16% of world electricity at competitive prices. It dominates the electricity mix in several countries, developed, emerging, or developing. However, wind and solar are quickly catching up.
Growth in Energy Demand
For a long time, growth in the world and the U. S. energy consumption as a function of time, follow what is known as exponential function. Now it looks like we have switched to linear growth, but time will tell if this is a permanent change. The exponential increase is characterized as follows. The amount of change (increase in energy consumption) per unit time is proportional to the quantity (or consumption) at that time.
or
Where Greek letter Δ(delta) is the change or increment of the variable and λ (lambda) is the growth rate. After some mathematical methods, it can be shown that the equation changes to the form
where e is a constant = 2.71
We can determine how long it takes for N0 to become 2N0 (twice its original number or double). That time period is called doubling time. After some mathematical steps it can be written as:
Illustration
If the use of energy is projected to increase at the rate of 1.7% per year in the U.S. How long will it take to double its usage?
In 41.17 years, the consumption of energy will be twice as much as it is today.Energy Reserves
Fossil Fuels account for a large portion of the world's energy sources. These fossil fuels are non-renewable fuels with a finite lifetime. So, the question is: Will we have enough supply for future energy requirements?
The answer to this question depends on the quantity of fossil fuels we have in the ground. Energy sources that have been discovered but not produced cannot be easily measured. Trapped several feet below the surface, they cannot be measured with precision. There are several terms used to report the estimates of the energy resources. The most commonly used terms are “reserves” and “resources.”
- "Reserves" represent that portion of demonstrated resources that can be recovered economically with the application of extraction technology available currently or in the foreseeable future. Reserves include only recoverable energy.
- “Resources” represent that portion of the energy that is known to exist or even suspected to exist, irrespective of technical or economic viability. So reserves are a subset of resources.
| Source of Energy | U.S. Reserves | U.S. Annual Consumption | World Reserves | World Annual Consumption |
|---|---|---|---|---|
| Petroleum (billions of barrels) |
46.4 | 7.39 | 1650 | 35 |
| Natural gas (Wet) (Trillion Cu. Ft.) |
691 | 32.1 | 6922 | 132 |
| Coal (billions of short tons) |
469 | 0.51 | 1139 | 8.56 |
SOURCES : U.S. Energy Information Administration (EIA) - Natural Gas, EIA - Coal, Worldometer - Oil left in the world
Coal
While much of the world has decreased their use of coal over the past two decades, both China and India have been increasing their use of coal. Push the play button below to show how coal usage has changed since 1900. The US was the #1 producer of coal until the 1980s, when China became #1. Since then, China's coal production has continued to increase with the exception of a small dip during COVID.
As of 2025, total world proved recoverable reserves of coal were estimated at 1139 billion short tons. In many countries, such as the US, coal consumption has been decreasing. However, in China and India, coal use has increased significantly in the past decade.
Five countries have nearly 73% of the world's coal reserves:
- United States—28%
- Russia—18%
- China—13%
- Australia—9%
- India—7%
Petroluem
Based on data from OPEC (Oil Producing and Exporting Countries), the highest proved oil reserves including non-conventional oil deposits are shown in the graphic below. This shows which regions of the world have the highes amounts of oil reserves. You can interact with this figure to show the historical change of proven reserves or create different types of charts to separate by country.
The top countries for oil resereves are Venezuela, Saudia Arabia, Canada Iran and Iraq. The US does have considerable about of oil resources and lands in the top 10 of oil producing countries.
Based on data from BP (British Petroleum), proved gas reserves were dominated by three countries: Russia, Iran and Qatar, which together held nearly half the world's proven reserves. According to the US CIA The World Factbook, the US has the 4th largest reserves of natural gas. Due to constant updates about the shale gas estimates, these are difficult to say with certainty.
How Long Will the Reserves Last?
How long these reserves do last depends on the rate at which we consume these reserves. For example, let’s assume that we have $100,000 in the bank (reserves) and if we draw 10,000 dollars every year (consumption) the reserve will last for 10 years (\$100,000/\$10,000 per year). However, in this case, we are assuming that we do not add any money to our deposit, and we do not increase our withdrawal.
This is generally not true in the case of life of an energy reserve. We may find new reserves, and our energy consumption or production can also increase. In the case of energy reserve, although we know that we might find new resources, we do not know how much we could find. But the consumption can be predicted with some accuracy based on the past rates.
Lifetime of current reserves at constant consumption
We can calculate the life of current petroleum reserves by dividing the current reserves by current consumption.
- At the current rate of consumption, the approximate lifetime of the world’s petroleum, natural gas, and coal reserves is 47.1 years, 52.4 years, and 133 years, respectively.
- At the current rate of consumption, the current U. S. petroleum, natural gas, and coal reserves will last approximately for 6.3 years, 21.5 years, and 919 years, respectively.
It is important to note that the entire U.S. petroleum consumption is not coming from the U.S. reserves because we import more than one half of the consumption. Because we import more than one half of the consumption, the petroleum reserves at the current rate will last about 11 years. If the consumption increases in the future, the life will be less. However, there is also a chance of adding more reserves with more exploration and discoveries. The increase in consumption can change depending on the price of petroleum and other alternative fuels. Likewise, us moving to electric cars and harnessing unconventional oil reserves can extend the lifetime of these reserves.
Therefore, these lifetimes are not carved in stone. It can be debated whether the U.S. reserves will last for 6 years or 10 years or even 20 years, or we may never run out! But there is increasing consensus that we must change our lifestyle. Even if we won't run out, the environmental consequences of continued use are pushing us to change anyway, but more on that later...
The R/P ratio can change from year to year, similar to our bank balance. We can add more if we make more or consume more. That changes the time we can draw on the balance.
Therefore, we must conserve, innovate (get more with less), or learn to live without these resources.
Current and Future Energy Sources of the USA
US Energy Supply and Demand
When focusing on the energy supply and demand, it can be helpful to see where the energy is going. Below is a sankey diagram showing the total amount of energy consumed in the US and where it is going. Where does most of our energy go? Does this surprise you to see over 65% of our energy is rejected in the form of waste?

The image is a Sankey diagram illustrating the estimated U.S. energy consumption in 2023, totaling 93.6 quadrillion BTUs (Quads). It shows the flow of energy from various sources to different sectors and highlights the amount of energy that is ultimately rejected or used. Energy sources are color-coded and include solar (yellow, 0.89 Quads), nuclear (red, 8.1 Quads), hydro (blue, 0.82 Quads), wind (purple, 1.5 Quads), geothermal (brown, 0.12 Quads), natural gas (light blue, 33.4 Quads), coal (gray, 8.17 Quads), biomass (light green, 5 Quads), and petroleum (dark green, 35.4 Quads). The energy flows into categories such as electricity generation (orange, 32 Quads), residential (pink, 11.3 Quads), commercial (pink, 9.3 Quads), industrial (pink, 26.1 Quads), and transportation (dark green, 28 Quads). Finally, the diagram shows rejected energy (gray, 61.5 Quads) and energy services (gray, 32.1 Quads). The logo of Lawrence Livermore National Laboratory is in the top right corner.
Source: LLNL October, 2024. Data is based on DOE/EIA SEDS (2024). If this information or a reproduction of it is used, credit must be given to the Lawrence Livermore National Laboratory and the Department of Energy, under whose auspices the work was performed. Distributed electricity represents only retail electricity sales and does not include self-generation. EIA reports consumption of renewable resources (i.e., hydro, wind, geothermal and solar) for electricity in BTU-equivalent values by assuming a typical fossil fuel plant heat rate. The efficiency of electricity production is calculated as the total retail electricity delivered divided by the primary energy input into electricity generation. End use efficiency is estimated as 65% for the residential sector, 65% for the commercial sector, 49% for the industrial sector, and 21% for the transportation sector. Totals may not equal sum of components due to independent rounding. LLNL-MI-410527
Globally, many interesting transitions are occurring. While the U.S. was once the top consumer of energy, China claimed this title in 2009.
| Country | Consumption in Exajoules |
|---|---|
| China | 159 |
| U.S. | 95.9 |
| India | 36.4 |
| Russia | 28.9 |
Fossil Fuels
Fossil Fuels still remain a major component of energy use in the US. As shown in the figure above, over 80% of US energy use is produced from fossil fuels. The three fossil fuels are coal, oil and natural gas.
As a result of innovations in oil and gas extraction, U.S. imports have dropped considerably. While the US still consumes a lot of oil for transportation, a lot more oil has been discovered and produced domestically.

The image is a line graph titled "U.S. energy net imports by major source, 1950-2023," measured in quadrillion British thermal units. The horizontal axis represents the years from 1950 to 2023, while the vertical axis measures energy quantities ranging from -10 to 25 quadrillion British thermal units. There are four colored lines, each representing a different energy source. The brown line shows crude oil imports, peaking around 2005 at over 15 units before declining to approximately 2 units by 2023. The maroon line indicates petroleum products, with fluctuations around 5 to 10 units until it declines to negative values in recent years. The blue line for natural gas remains relatively stable from the 1970s, eventually dipping below zero after 2000. The black line represents coal and coal coke, consistently near zero, slightly fluctuating around the mid-20th century. Each energy source is identified with corresponding colors in the legend below the graph. At the bottom left, the "eia" logo is visible, along with a text box citing the data source.
Looking at the U.S. Energy Profile, It can be seen from the imports profile that the US Crude oil imports have significantly reduced between 2005 and 2019 from a peak of 25 Quadrillion BTUs. Another significant change that can be noted is that the US is now exporting natural gas (below zero on the y axis) instead of importing it. Although crude oil is imported, US exports finished petroleum products resulting in less net imports. As a matter of fact, US total energy exports exceeded the imports in 2019 since 1950.
The top five countries (sources) of US total petroleum in 2019 were Canada (49%), Mexico (7%), Saudi Arabia (6%), Russia (6%) and Columbia (4%).
The U.S. also ranks:
- first in worldwide reserves of coal;
- sixth in worldwide reserves of natural gas;
- eleventh in worldwide reserves of oil.
US Energy Consumption by Source and the chart of the US Energy consumption by source and user sector shows each energy source and the amount of energy it supplies in British thermal units (BTU). Petroleum is the leading source of energy in the US in 2019 with 36.72 quadrillion BTUs. Next is natural gas with 32.10 quadrillion BTUs. Coal supplies 11.31 quadrillion BTUs of energy. Renewable energy and nuclear power are responsible for 11.46 and 8.46 quadrillion BTUs respectively. Of the total petroleum consumption, 72% is used for transportation and another 23% is used by the industrial sector. Similarly, 35% of the natural gas (largest fraction) is used for power generation. On the other hand, 76% of the residential and commercial energy needs are met by natural gas. The actual percentages are not required to be memorized but answers to the questions such as: Which fuel is most used by power plants for power generation? Which sector uses petroleum the most? Approximately what fraction of the electricity is generated by renewable energy? (10, 25, 50 or 90) What is the primary purpose of coal use? etc. need to be answered.
US Energy Consumption by Source and Sector
The graph shows how dependent the U.S. is on our petroleum supply, as it accounts for almost 37% of our energy. Our next two highest sources of energy, like petroleum, are non-renewable and include natural gas and coal. Only about 11% of our energy comes from renewable energy sources such as wood and water (hydroelectricity). According to Energy Information Administration, US renewable energy consumption surpassed coal for the first time in over 130 years in 2019. Of the 4.12 trillion kWh of electricity generated in the US, 38% was from natural gas, coal accounted for about 23% and nuclear adding another 20%. Renewable sources contributed to 17% of the total electricity generated.

The flow diagram illustrates the U.S. energy consumption by source and sector for the year 2024, measured in quadrillion British thermal units (Btu). On the left, the energy sources are listed with corresponding percentages: petroleum (35.3, 38%), natural gas (34.2, 36%), renewable energy (8.6, 9%), nuclear (8.2, 9%), and coal (7.9, 8%), totaling 94.2 quadrillion Btu. The lines connect these sources to various end-use sectors on the right: transportation (28.1, 38%), industrial (26.1, 35%), residential (11.2, 15%), and commercial (9.5, 13%) with a total of 74.9 quadrillion Btu. In the center, a section is dedicated to the electric power sector, splitting into electricity sales (13.5, 41%) and energy losses (19.3, 59%), with a total of 32.8 quadrillion Btu. Different colored lines represent energy flow from each source to sectors, indicating the percentage allocation.
In 2023, fossil fuels made up 84% of total U.S. energy consumption, the lowest fossil fuel share. The greatest growth in renewables over the past decade has been in solar and wind electricity generation. Liquid biofuels have also increased in recent years, contributing to the growing renewable share of total energy consumption. 2020 was the first year that renewables surpassed coal consumption in the U.S.
US Energy Consumption Over Time

The image is a line graph displaying energy consumption trends in the United States from 1950 to 2024, measured in quadrillion British thermal units (Btu). The horizontal axis represents years from 1950 to 2024, while the vertical axis represents energy consumption in quadrillion Btu, ranging from 0 to 50. Five colored lines represent different energy sources. The green line indicates petroleum consumption peaking around 40 quadrillion Btu in the early 2000s. The brown line, representing natural gas consumption, steadily rises, nearly intersecting petroleum consumption in 2020 and again in 2024. The blue line shows coal consumption, peaking around 1990 but sharply declining thereafter. The red line, depicting total renewable energy consumption, shows a gradual increase. The yellow line, representing nuclear electric power, rises sharply around 1970 and stabilizes. A legend at the bottom specifies the color coding for each energy type.
The most significant decline in recent years has been coal: US energy consumption from coal was at a high of 37% in 1950 to only 9% in 2023. Biomass, which includes wood as well as liquid biofuels like ethanol and biodiesel, remain relatively flat, as wood use declines and biofuel use increases slightly. In contrast, wind and solar are among the fastest-growing energy sources in the projection, ultimately surpassing biomass and nuclear.
US Energy Consumption History
The plot of US energy consumption shows the relative amounts of each type of energy that was consumed for each year. The history of the energy consumption profile of the United States indicates that petroleum makes the largest part of the energy demand over the past seven decades. Natural gas has taken the second over the past decade with the production of gas from shale. Coal has been replaced by renewable energy and natural gas for electricity generation. Among the renewable energy sources, biomass has the larger share followed by wind energy. Wind energy and solar energy are the fastest growing energy sources.


Answers to the following questions need to be looked for in the material presented above.
- Of all the renewable energy sources, which renewable source is used most?
- Which of the renewable sources is used most for transportation?
- Approximately what fraction of the electricity is generated by nuclear energy? (10, 20, 50 or 90)
Electricity
Electricity demand is expected to grow in the future. Visit the webpage US electricity explained - Sources and profiles
Examine for:
- Sources of U.S. electricity generation
- What are the notable changes in the major sources for electricity generation between 1950 and today?
- Role of renewable energy in the electricity generation.
Growth in electricity use for in the residential and commercial sectors is partially offset by improved efficiency. However, increases in demand from electric cars and data centers are causing a expected increase in electric demand. In 2023, Fossil Fuels accounted for 60% of US electricity generation, with natural gas accounting for most of that.
Most capacity additions over the next 10 years are expected to be renewables.
Did You Know?
Demand-side management programs address efficiency. By being more efficient, we can do more with less, and then reduce the demand for energy. This can include changing the time when higher use items are used, like dishwashers and EV charging to times when the demand on the grid is less.
Review & Extra Resources
Review
Watch the following 4 minute 50 second video Review for Lesson 2.
Hello again, Dr. hall here.
So you've finished lesson. two on energy supply and demand and again we've made a review sheet to help you identify some of the key components of this lesson to better prepare yourself for the quiz.
So one of the first points is gross domestic product. You may have seen this in an economics class but we're introducing this so you understand the relationship between productivity and nations and how that relates to energy use.
Another important concept is energy intensity so you can get a sense for how much each citizen in the world uses energy and how that varies across the globe. So because we're talking about national and global energy consumption and production, the units of energy that we're using are extraordinarily large. So we talk about quads or quadrillion BTUs which is 10 to the power 15 BTUs. That's right, so that's a lot of energy. A tremendous amount compared to how much we need to power our bodies in the day.
Right so the given amount of calories we consume or about 2,000 and comparing that to how many btus we use to do everything else in our life it's quite extraordinary what the differences are.
So we also covered world energy consumption and some of the trends that we've seen in the past and what we expect again the best of our knowledge what we expect they will look like in the future.
And there are some key points that you can learn from this. So number one oil is one of the most utilized energy resources across the world and it seems like it'll stay that way from 2020 on to 2050. Another fact that we're coming to terms with is energy consumption across the globe will likely continue to increase from 2020 on to 2050. In terms of the u.s, we have an extraordinary amount of fossil fuels in particular coal. But like much of the rest of the world what we use regularly the most is still oil and it looks like it will remain that way for a long time in the future.
Another thing that seems to be a constant is that the consumption of all different energy sources both renewable and non-renewable appear today will increase to meet our growing energy demand. Uh as you'd expect or what you you'd probably be familiar with in your real life. most of our use of petroleum and oil is in the form of transportation and that's why it's so high is we we move many things in this world and a lot of that relies on petroleum-based products. And in the U.S. we use so much of this that we regularly have to import this petroleum from somewhere else because we don't produce as much as we would need in order to satisfy the demand. And lastly the U.S. not only has a lot of coal in terms of itself but even in terms of the world we have about one fourth of the resorts overall.
Another interesting thing to consider is the doubling time ,right. This was important concept that we covered that helps us understand the role of growth and consumption how that relates to uh the supply of energy and the consumption that we have of it.
Uh when we talk about energy in terms of non-renewable sources. We have what's called reserves and resources and each of these represent two distinctly different qualities that we have in an energy resource. So when we look at those we can also do some rather straightforward math to see how long we expect those reserves to last. But in an ever and changing world where our relationship with energy keeps changing we can always estimate how long those reserves last but innovations sometimes improve how much we we have in terms of resources and reserves and it also changes our relationship with how we use them. Right so for example the emergence of renewable energy and electric cars that changes how long those reserves are last because it changes our our rate of consuming them.
So uh again uh I'm glad that you finished lesson two. I hope that you take into account each of these points uh review. Be sure to practice the practice questions and good luck on the quiz alright.
Thanks everyone.
Review Sheet – Energy Supply and Demand
- Gross Domestic Product (GDP)
- Energy Intensity
- Quadrillion Btus = 1015 Btus
- World Energy Consumption
- Oil is the most utilized energy source in both 2020 and 2050
- Energy Consumption will increase from 2020 to 2050
- United States Energy Consumption
- First in worldwide reserves of coal
- Oil is the most utilized energy source in both 2020 up to 2050.
- Consumption of all energy sources will increase from 2020 to 2050
- 66.5% of petroleum is used for transportation
- More than half of petroleum needs are met by imports
- US has almost one fourth of the world’s reserves of coal
- Doubling time
- Energy reserves and resources
- "Reserves" represent that portion of demonstrated resources that can be recovered economically with the application of extraction technology available currently or in the foreseeable future. Reserves include only recoverable energy.
- “Resources” represent that portion of the energy that is known to exist or even suspected to exist irrespective of technical or economic viability. So reserves are a subset of resources.
- How long will the reserves last?
Test Yourself
The questions below are your chance to test and practice your understanding of the content covered in this lesson. In other words, you should be able to answer the following questions if you know the material that was just covered! If you have problems with any of the items, feel free to post your question on the unit message board so your classmates, and/or your instructor, can help you out!
- Is energy use in the world increasing, decreasing or staying the same? Does it depend on where you live? Why?
- The United States, with 5% of the world's population, uses about 25% of the world's energy and contributes 25% of the world's greenhouse gas emissions. Explain.
- List the reasons why the United States per capita energy consumption is one of the highest. What other countries have high per capita energy consumption? Why?
- List reasons why the United States energy consumption per dollar of GDP is higher than most of the industrialized nations.
- What is the difference between reserves and resources?
- List the changes that you would make in your personal lifestyle if you were mandated to reduce your energy consumption by 25%.
- What variables determine the lifetime of a nonrenewable resource?
Extra Resources
For more information on topics discussed in Lesson 2, see these selected references:
- Hinrichs, R., Wade, R. H., & Clemons, J. L. (2024). Energy: Its use and the environment. Cengage.
- Energy Information Administration, Annual Energy Outlook, DOE/EIA 0383 (2025), U.S. Department of Energy, Washington D.C., 2025.
- Energy Information Administration, International Energy Outlook, DOE/EIA 0484 (2023), U.S. Department of Energy, Washington D.C., 2023.
Lesson 2 Deliverable
Deliverable
You must complete a short quiz that covers the reading material in lesson 2. The Lesson 2 Quiz can be found in the Lesson 2: Energy Supply and Demand module in Canvas. Please refer to the Calendar in Canvas for specific time frames and due dates.
Lesson 3: Energy Efficiency
The links below provide an outline of the material for this lesson. Be sure to carefully read through the entire lesson before returning to Canvas to submit your assignments.
Introduction
Welcome to Lesson 3!
Alright, we are into lesson 3. Lesson 3 basically deals with energy efficiency. Upon completing this lesson, you will really get a quantitative feel for what energy efficiency is and also how to calculate energy efficiency with a conversion device. A conversion device can be anything – an automobile or a power plant or any device that converts one form of energy to another form.
And we will also understand the concept of entropy. Entropy is disorder. Because of entropy, our efficiencies are lower than what we normally expect. And we will look at the operating principle of a heat engine. A heat engine is a device that converts heat to work. Particularly, automobiles are all heat engines, and they are notoriously inefficient. We will see 2 examples and calculations of why these automobiles are notoriously inefficient.
We can also calculate the efficiency of a whole process from the step efficiencies. For example, if it involves 2 or 3 steps like in a relay race. You know you have 3 or 4 players taking the baton and one lap by each of the athletes. So, what is the overall or team efficiency if we know the efficiency of each of those steps or the efficiency of each of those players? That is a very important concept in this chapter.
While doing this, we will also learn about temperature scales; Kelvin scale, Fahrenheit, and also Celsius. So there will be a lot of numerical problems in this lesson.
Alright! Good luck!
Lesson 3 Objectives
Upon completing this lesson, you should be able to:
- define and calculate efficiency of an energy conversion device;
- articulate the concept of entropy;
- explain operating principles of a heat engine; and
- calculate overall efficiency from step efficiencies.
See the calendar in Canvas for due dates/times.
Questions?
If you have any questions, please post them to the General Course Questions forum in located in the Discussions tab in Canvas. I will check that discussion forum daily to respond. While you are visiting the discussion board, feel free to post your own responses to questions posted by others - this way, you might help a classmate!
Energy Conversion Devices
In the first lesson, we saw that energy can be transformed from one form to another, and during this conversion, all the energy that we put into a device comes out. However, all the energy that we put in may not come out in the desired form.
For example, we put electrical energy into a bulb and the bulb produces light (which is the desired form of output from a bulb), but we also get heat from the bulb (undesired form of energy from an electric bulb).
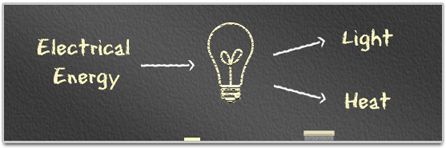
Therefore, energy flow into and out of any energy conversion device can be summarized in the diagram below:
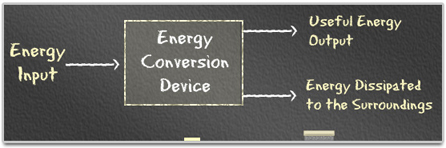
When all forms of energy coming out of an energy conversion device are added up, it will be equal to the energy that is put into a device. Energy output must be equal to the input. This means that energy can not be destroyed or created. It can only change its form.
In the case of an electric bulb, the electrical energy is converted to light and heat.
The amount of electrical energy put into a bulb = the amount of light energy (desirable form) plus the heat energy that comes out of the bulb (undesirable form).
Say you go to the mall with $100, and you come back with only $10. You need to account for the $90 that was spent. After thinking about it, you come up with the following list:
Gas ($15); Sandwich, fries, and a drink ($8); Lost ($5); New clothes ($62)
So you spent $62 on something useful - the clothes - but you spent additional money for other things that were necessary for your trip to the mall.
Self Check
Instructions: Identify the useful energy output(s) and undesirable energy output(s) in the energy conversion devices below. Enter your answers in the fields provided, and click the "Check" button to check your work.
Self Check:
Energy Conversion Devices
For each of the following examples, determine the types of useful energy and undesired energy for the given energy converter.
Example 1: Lawnmower with a chemical energy input. (Hint: How do you know when your neighbor is mowing the lawn?)
Example 2: Car with a chemical energy input. (Hint: Think about mufflers, tires, and generator.)
Example 3: Television with an electrical energy input. (Hint: Have you ever felt the back of your TV after it has been on for a few hours?)
Example 4: Desktop computer with an electrical energy input. (Hint: What’s in your tower and why?)
Answers:
Example 1: The useful energy for a lawnmower is mechanical, while the undesired energy is thermal (heat) and radiation (noise).
Example 2: The useful energy for a car is mechanical, while the undesired energy is thermal or heat (tail pipe).
Example 3: The useful energy for a TV is radiation (light and sound) and the undesirable energy is heat (from circuits).
Example 4: The useful energy for a computer is radiation (light and sound) and the undesirable energy is heat (circuits – electrons moving through system) and mechanical (fan for cooling).
Efficiency of Energy Conversion Devices
Efficiency is the useful output of energy. To calculate efficiency, the following formula can be used:
Example 1
An electric motor consumes 100 watts (a joule per second (J/s)) of power to obtain 90 watts of mechanical power. Determine its efficiency.
Solution:
Input to the electric motor is in the form of electrical energy, and the output is mechanical energy.
Using the efficiency equation:
Or efficiency is 90%.
Caution!
This is a simple example because both variables are measured in Watts. If the two variables were measured differently, you would need to convert them to equivalent forms before performing the calculation.
Practice Problem
Use the following link to generate a random practice problem similar to the Practice 1 example.
The previous example about an electrical motor is very simple because both mechanical and electrical power is given in Watts. Units of both the input and the output have to match; if they do not, you must convert them to similar units.
Example 2
The United States' power plants consumed 39.5 quadrillion Btus of energy and produced 3.675 trillion kWh of electricity. What is the average efficiency of the power plants in the U.S.?
Solution:
Total Energy input = 39.5 x 10^15 Btus and the Useful energy output is 3.675 x 10^12 kWh. Recall that both units have to be the same. So we need to convert kWh into Btus. Given that 1 kWh = 3412 Btus:
Step 1
Therefore:
Step 2
Use the formula for efficiency.
Practice 2
The United States' power plants consumed 39.5 quadrillion Btus of energy and produced 3.675 trillion kWh of electricity. What is the average efficiency of the power plants in the U.S.?
Practice Problem
Use the following link to generate a random practice problem similar to the Practice 2 example.
Energy Efficiencies
Energy efficiencies are not 100%, and sometimes they are pretty low. The table below shows typical efficiencies of some of the devices that are used in day to day life:
| Device | Efficiency |
|---|---|
| Electric Motor | 90 % |
| Home Gas Furnace | 95 % |
| Home Oil Furnace | 80 % |
| Home Coal Stove | 75 % |
| Steam Boiler in a Power Plant | 90 % |
| Overall Power Plant | 36 % |
| Automobile Engine (ICE) | 25 % |
| Electric Bulb: Incandescent | less than 10 % |
| Electric Bulb: Fluorescent | 60 % |
| Electric Buld: LED | 90 % |
From our discussion on national and global energy usage patterns in Lesson 2, we have seen that:
- about 40% of the US energy is used in power generation;
- about 27% of the US energy is used for transportation.
Yet the energy efficiency of a power plant is about 35%, and the efficiency of automobiles is about 25%. Thus, over 62% of the total primary energy in the U.S. is used in relatively inefficient conversion processes.
Why are power plant and automobile design engineers allowing this? Can they do better?
There are some natural limitations when converting energy from heat to work.
Measuring Thermal Energy
Thermal energy is energy associated with random motion of molecules. It is indicated by temperature, which is the measure of the relative warmth or coolness of an object.
A temperature scale is determined by choosing two reference temperatures and dividing the temperature difference between these two points into a certain number of degrees.
The two reference temperatures used for most common scales are the melting point of ice and the boiling point of water.
- On the Celsius temperature scale, or centigrade scale, the melting point is taken as 0°C and the boiling point as 100°C, with the difference between them being equal to 100 degrees.
- On the Fahrenheit temperature scale, the melting point is taken as 32°F and the boiling point as 212°F, with the difference between them being equal to 180 degrees.
It is important to realize, however, that the temperature of a substance is not a measure of its heat content, but rather, the average kinetic energy of its molecules resulting from their motions.
Try This!
Below is a 6-ounce cup with hot water and a 12-ounce cup with hot water at the same temperature.
- Do they have the same heat content?
- Do they have the same amount of energy?
Instructions: Click the play button to obtain a magnified view of what is happening. Draw your conclusions, enter your answer in the text field provided, and then click the link below the video to check your answer. (Note: The animation has no audio.)
Try This: Measuring Thermal Energy
A six ounce cup and a twelve ounce cup are both filled with 85 degree water.
Conclusion: They do NOT have the same heat content. Since water in the two cups is at the same temperature, the average kinetic energy of the molecules in the cups is the same; however, the 12 ounce cup has twice as many molecules when compared with the 6 ounce cup and thus has the greater total motion or heat energy.
Kelvin Scale
When water molecules freeze at 0°C, the molecules still have some energy compared to ice at -50°C. In both cases, the molecules are not moving, so there is no heat energy.
So what is the temperature at which all the molecules have absolutely zero energy? A temperature scale can be defined theoretically, for which zero degree corresponds to zero average kinetic energy. Such a point is called absolute zero, and such a scale is known as an absolute temperature scale. At absolute zero, the molecules do not have any energy.
The Kelvin temperature scale is an absolute scale having degrees the same size as those of the Celsius temperature scale. Therefore, all the temperature measurements related to energy measurements must be made on Kelvin scale.
You can convert a temperature in Celsius (c) to Kelvin (k) with this formula:
You can also change a temperature in Kelvin to Celsius:
To make calculations for this class easier, you may round off and use just 273 in your conversions.
Try This!
Instructions: Click the "Play" button below and notice what happens to the ice cube. Answer the questions that follow based on your observations. (Note: The animation has no audio.)
Heat Engines
Energy conversions occurring in an automobile are illustrated below:
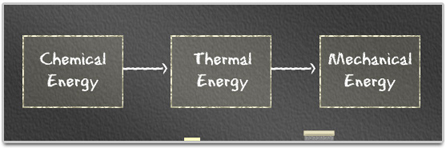
Any device that converts thermal energy into mechanical energy—such as an automobile or a power plant—is called a heat engine. In these devices, high temperature heat (thermal energy) produced by burning a fuel is partly converted to mechanical energy to do work and the rest is rejected into the atmosphere, typically as a low temperature exhaust.
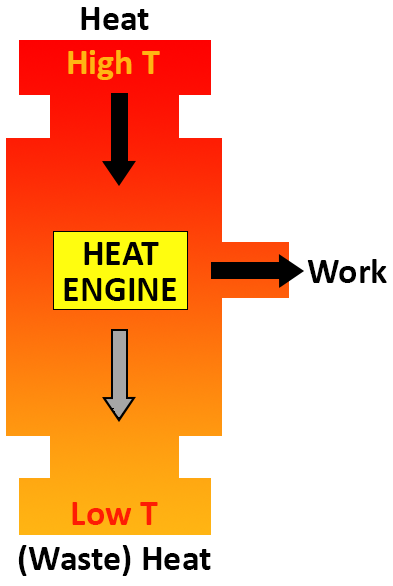
The Carnot Efficiency
A general expression for the efficiency of a heat engine can be written as:
We know that all the energy that is put into the engine has to come out either as work or waste heat. So work is equal to Heat at High temperature minus Heat rejected at Low temperature. Therefore, this expression becomes:
Where, QHot = Heat input at high temperature and QCold= Heat rejected at low temperature. The symbol (Greek letter eta) is often used for efficiency this expression can be rewritten as:
The above equation is multiplied by 100 to express the efficiency as percent.
French Engineer Sadi Carnot showed that the ratio of QHighT to QLowT must be the same as the ratio of temperatures of high temperature heat and the rejected low temperature heat. So this equation, also called Carnot Efficiency, can be simplified as:
Note: Unlike the earlier equations, the positions of Tcold and Thot are reversed.
The Carnot Efficiency is the theoretical maximum efficiency one can get when the heat engine is operating between two temperatures:
- The temperature at which the high temperature reservoir operates ( THot ).
- The temperature at which the low temperature reservoir operates ( TCold ).
In the case of an automobile, the two temperatures are:
- The temperature of the combustion gases inside the engine ( THot ).
- The temperature at which the gases are exhausted from the engine ( TCold ).
It's like taxes. The more money you earn (heat), the more money is taxed (cold), leaving you with less money to take home (efficiency). However, if you could earn more money (heat) and find a way to have less taxes taken out (better engine material), you would have more money to take home (efficiency).
Below is a table showing two temperature scales. The scale labeled "HOT," shows the range of temperatures for the combustion of gases in a car engine. The scale labeled "COLD," shows the range of temperatures at which gases are exhausted from the car engine.
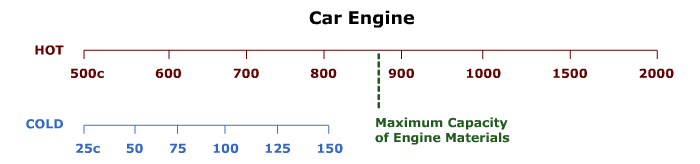
Instructions: Look carefully at the efficiency numbers in the body of the table. How do the Hot and Cold temperatures' effect on the efficiency.
| Hot 500°C |
Hot 600°C |
Hot 700°C |
Hot 800°C |
Hot 900°C |
Hot 1,000°C |
Hot 1,500°C |
Hot 2,000°C |
|
|---|---|---|---|---|---|---|---|---|
| Cold 150°C |
45 | 52 | 57 | 61 | 64 | 67 | 76 | 81 |
| Cold 125°C |
49 | 54 | 59 | 63 | 66 | 69 | 78 | 82 |
| Cold 100°C |
52 | 57 | 62 | 65 | 68 | 71 | 79 | 84 |
| Cold 75°C |
55 | 60 | 64 | 68 | 70 | 73 | 80 | 85 |
| Cold 50°C |
58 | 63 | 67 | 70 | 72 | 75 | 82 | 86 |
| Cold 25°C |
61 | 66 | 69 | 72 | 75 | 77 | 83 | 87 |
Answer the following questions based on the information in the Car Engine Efficiency table above.
Example
For a coal-fired utility boiler, the temperature of high pressure steam (Thot)would be about 540°C and Tcold, the cooling tower water temperature, would be about 20°C. Calculate the Carnot efficiency of the power plant:
Solution:
Carnot efficiency depends on high temperature and low temperatures between which the heat engine operates. We are given both temperatures. However, the temperatures need to be converted to Kelvin:
Practice
For a coal fired utility boiler, the temperature of high pressure steam would be about 540 degrees C and Tcold, the cooling tower water temperature, would be about 20 degrees C. Calculate the Carnot efficiency of the power plant.
Step 1
Convert the high and low temperatures from Celsius to Kelvin:
Step 2
Determine the efficiency using the Carnot efficiency formula:
From the Carnot Efficiency formula, it can be inferred that a maximum of 64% of the fuel energy can go to generation. To make the Carnot efficiency as high as possible, either Thot should be increased or Tcold (temperature of heat rejection) should be decreased.
Practice Problem
Use the following link to generate a random practice problem.
Entropy and Quality of Energy
Let’s look at an example of how temperature differences are used to generate power. Power plants convert chemical energy into electrical power. Here is a video overviewing the operation of a geothermal energy system, a classic thermal power generation plant.
You may have relaxed in a natural hot springs pool.
Or seen the old faithful geyser blasting hot water into the air in yellowstone national park. But have you ever thought of where all that heat comes from?
Well, it comes from deep beneath the surface of the earth -- and it's called geothermal energy...
And we can use it to generate clean renewable electricity. Ok, here's how geothermal works.
Heat from the earth's crust warms water that has seeped into underground reservoirs. When water becomes hot enough it can break through the earth's surface as steam or hot water. This usually happens where the earth's crust or 'plates' meet and shift.
In the past, taking advantage of geothermal energy was limited to areas where hot water flowed near the surface. But, as geothermal technologies advance, we can leverage even more of these natural renewable energy sources. Engineers have developed a few different ways to produce power from geothermal wells drilled into the ground.
Have a look at this. It's a dry steam geothermal power plant and it's the most common type of geothermal technology used today... Underground steam flows directly to a turbine to drive a generator that produces electricity. Pretty straightforward.
Another geothermal technology is called a flash steam power plant. A pump pushes hot fluid into a tank at the surface, where it cools. As it cools the fluid quickly turns into vapor-- or "flash" vaporizes. The vapor then drives a turbine -- and powers a generator.
A binary cycle plant works differently.
It uses two types of fluid. Hot fluid from underground heats a second fluid, called a heat transfer fluid, in a giant heat exchanger. The second fluid has a much lower boiling point than the first fluid and so it 'flashes' into vapor at a lower temperature. When the second fluid flashes... It spins a turbine that drives a generator.
The environmental benefits of this clean, round-the-clock renewable energy source are substantial: low emissions, small physical footprint, and minimal environmental impact. The few byproducts that can come up are often re-injected underground.
Geothermal energy can also help recycle wastewater. In california, wastewater from the city of santa rosa is injected into the ground to generate more geothermal energy.
Some plants do produce solid waste, but that solid waste may contain minerals that we can remove and sell... Which lowers the cost of this energy source.
The u.s. geological survey estimates that untapped geothermal resources in the united states, if developed, could supply the equivalent of 10% of today's energy needs. In fact, electricity generated by geothermal energy already provides about 60% of the power along the northern california coast...
From the golden gate bridge to the oregon state line.
Geothermal energy... ...helping to push america toward energy independence, and a clean, renewable way to meet our growing energy demands...
Below are two temperature scales. The scale labeled "HOT," shows the range of temperatures for the combustion of gases in a power plant. The scale, "COLD," shows the range of temperatures at which gases are exhausted from the power plant.
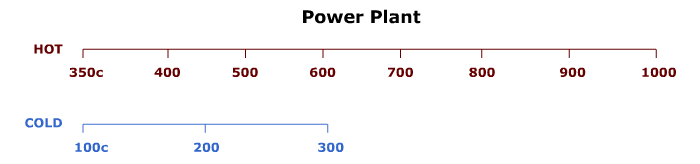
Instructions: Look carefully at the efficiency numbers in the body of the table. How do the Hot and Cold temperatures' effect on the efficiency.
| Hot 350°C |
Hot 400°C |
Hot 500°C |
Hot 600°C |
Hot 700°C |
Hot 800°C |
Hot 900°C |
Hot 1,000°C |
|
|---|---|---|---|---|---|---|---|---|
| Cold 300°C |
8 | 15 | 26 | 34 | 41 | 47 | 51 | 55 |
| Cold 250°C |
16 | 22 | 32 | 40 | 46 | 51 | 55 | 59 |
| Cold 200°C |
24 | 30 | 39 | 46 | 51 | 56 | 60 | 63 |
| Cold 150°C |
32 | 37 | 45 | 52 | 57 | 61 | 64 | 67 |
| Cold 100°C |
40 | 45 | 52 | 57 | 62 | 65 | 68 | 71 |
Answer the following questions based on the information in the Power Plant Efficiency table above.
Overall Efficiency
Calculating Overall Efficiency
Using the energy efficiency concept, we can calculate the component and overall efficiency:
Here the electrical energy is given in Wh and Chemical Energy in Btus. So Wh can be converted to Btus knowing that there are 3.412 Wh in a Btu.
This overall efficiency can also be expressed in steps as follows:
Applying this method to the above power plant example:
It can be seen that the overall efficiency of a system is equal to the product of efficiencies of the individual subsystems or processes. What is the implication of this?
Steps of Overall Efficiency
We have been looking at the efficiencies of an automobile or a power plant individually. But when the entire chain of energy transformations is considered—from the moment the coal is brought out to the surface to the moment the electricity turns into its final form—true overall efficiency of the energy utilization will be revealed. The final form at home could be light from a bulb or sound from a stereo. The series of steps as shown in the figure below are: 1) Production of coal (Mining), 2) Transportation to power plant, 3) Electricity generation, 4) Transmission of electricity, and 5) Conversion of electricity into light (Use).
We know what the cumulative efficiency is actually. We looked at that in the previous diagram. We talked about it. On this diagram, we are looking at cumulative or overall efficiency for a qualified power plant. Basically, in the ground, we have coal, right? We have to bring the coal out to the surface. That step is called mining. Obviously, we need to spend some energy to bring the coal from the ground to the surface. So mining by itself has some kind of, let's say, about 95% efficient. Or that step is 95% efficient. In other words, if we have 100 units in the ground, and by the time this energy comes out to the surface, we will be left with only 95 units. Because five units, we will be spending in operating the equipment and in bringing the coal from the ground to the surface.
Now, this 95 obviously is not readily available, because we need to take these 95 BTUs to a power plant. So the trucks have to use some energy to take these 95 BTUs all the way up to the power plant. So when it reaches the power plant, these 95 units may turn out to be 90 units. In other words, we will be spending about five units in the transportation. So once we put in 90 units into a power plant, which is roughly about by now 33% efficient or 35% efficient, what this tells us is when we put in 90 units into the power plant, the output from the power plant in the form of electricity is only 30 units.
So now, at this point, we have only 30 units left over when we started our business with 100 units. Now, these 30 units are transported through these high voltage lines to a user. By the time you get to the user, we're talking about a unit or two lost. All right? And now, when we have about, let's say for simplicity purposes we will still have about 29 units or 30 units. And as you all know, the efficiency of a light bulb is notoriously low. It's about 5% efficient. Which means that out of these 29 units or 30 units that we will get into the home, only 5% of that, or 1.5 units are converted, really, to the light.
So we started off with 100, and we ended up with 1.5 units of light. So that means the overall efficiency is 1.5 divided by 100. Both are BTUs here. So the overall efficiency is only 1.5%. That is pathetically low. Which means to use 1.5 units of light, we are taking from Mother Earth 100 units. And along the way, we are dumping about 98.5 units of energy during various steps of conversion processes, and we're using 1.5 BTUs and 1.5%. That is the message.
Efficiency of a Light Bulb
If the efficiency of each step is known, we can calculate the overall efficiency of production of light from coal in the ground. The table below illustrates the calculation of overall efficiency of a light bulb.
| Step | Step Efficiency | Cumulative Efficiency or Overall Efficiency |
|---|---|---|
| Extraction of Coal | 96% | 96% |
| Transportation | 98% | 94% = (0.96 x 0.98) * 100 |
| Electricity Generation | 35% | 33% = (0.94 x 0.35) * 100 |
| Transmission of Electricity | 95% | 31% = (0.33 x 0.95) * 100 |
| Lighting: Incandescent Bulb |
5% | 1.6 % = (0.31 x 0.05) * 100 |
| Lighting: Fluorescent Bulb |
60% | 18 % = (0.31 x 0.60) * 100 |
Efficiency of an Automobile
A similar analysis on automobile efficiency is shown in the Figure below.
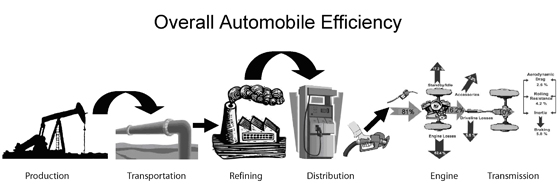 >
>
The table below shows that only about 10% of the energy in the crude oil in the ground is in fact turned into mechanical energy moving people.
| Step | Step Efficiency | Cumulative Efficiency or Overall Efficiency |
|---|---|---|
| Extraction of Crude | 96% | 96% |
| Refining | 87% | 84% |
| Transportation | 97% | 81% |
| Engine | 25% | 20% |
| Transmission | 50% | 10% |
Review and Extra Resources
Review
Please watch the 5:30 Lesson 3 Review below:
Hello everyone.
This is our review session for uh chapter three in this course where we're learning about energy efficiency and energy uh conversion processes.
So the real key of this chapter here is this one equation. And this is the one equation that i will not provide in the exams or in the sheets because i want you to memorize it because it is at the heart of this whole of this whole uh course. So useful energy out over total energy in is our energy efficiency.
Now remember the total energy in will always equal the total energy out, but many of it will be in forms that are not useful. So what that means is essentially we consume some primary energy source and then a fraction of that total energy we're putting in goes to something that we want it to. okay and it's always going to be less.
So whether we are moving the wheels on our car, we're trying to heat something up so that we can cook it the total energy in and that usefUl portion we're using to do some work it will be less.
Okay and so in each case we want to identify because there will be many energy outputs right and that's the first law of thermodynamics that the total energy in must always equal the total energy out. You cannot create or destroy energy and that's what's really encompassed in this first bullet here. All the energy we put in does not come out in the desired form. No such thing. An important thing to note when using this equation is that the energy should have the same units.
So you can't put joules in here and then say quads or btus or calories in here because the unit conversions will give you strain strange values for this efficiency. So it's really important when you use this to make sure that the units in both the top and the bottom match.
Another important note is that temperature of a substance is not a measure of its heat content. That's that's actually something that's energy related but instead it's the average kinetic energy of the molecules in their motion. Okay, one of the classic examples that was used long long ago to try to identify this equation and to describe it and what started the industrial revolution is the heat engine which is essentially a device that converts thermal energy into mechanical energy. So this comes up in our everyday lives well it used to come up more but as batteries and electrical energy conversion processes are coming in maybe it'll come up a bit less as we turn off of fossil fuels but still there are a lot of classic examples we can see.
Cars for example we take a gasoline which is chemical energy we then burn it to create thermal energy and then that thermal energy ends up spinning uh the wheels on our car or the blades on our lawn mowers. Right and it also works in a larger scale for coal and natural gas power plants when they're moving a turbine.
So these heat engines are described by the carnot efficiency which is a classic equation to tell us the limit of the absolute most energy we can get out of the thermal energy source. Right um to use this equation properly all the temperatures must be in kelvin. This is really important when you're ever dividing temperatures kelvin should always be used. And then you can see some clear relations with carnot efficiency that lets you know how a heat engine can be more or less efficient. A lot of that has to do with the temperature temperatures that are you're using right.
And so many of these principles are the key uh the key building blocks behind the workings of a power plant and as we had mentioned before right this thermal energy to mechanical energy isn't really one step but in fact in a total power plant there are many steps. Right so we have to go often from chemical energy to thermal energy to mechanical energy and then from mechanical energy we go to electrical energy and that's what we use to power our laptops and keep the lights on. And the way that we account for that is we essentially use our energy efficiency equation and we do that for each of those steps and then we multiply the efficiency of those steps together and that tells us our overall efficiency of the process. Right so what is the efficiency of going from chemical to thermo again it will never be a hundred percent so some will be we lost. And then from that useful thermo how much is going into mechanical and etc etc.
Okay so please take some time to review each of these key key points in this lecture and good luck on the quiz.
Okay.
Review Sheet Lesson 3 – Energy Efficiency
- Energy Conversion
- All the energy that we put in may not come out in the desired form
- Efficiency = Useful Energy Output / Total Energy Input
- Both energies must in the same units
- The temperature of a substance is not a measure of its heat content, but rather, the average kinetic energy of its molecules resulting from their motions
- Heat Engine
- Device that converts Thermal energy into Mechanical energy
- Carnot Efficiency
- All temperatures must be in Kelvin
- As Tlow decreases, efficiency increases. As Tlow increases, efficiency decreases
- As Thot decreases, efficiency decreases. As Thot increases, efficiency increases
- Workings of a Power plant
- Overall Efficiency = product of step efficiencies
Test Yourself
The questions below are your chance to test and practice your understanding of the content covered in this lesson. In other words, you should be able to answer the following questions if you know the material that was just covered! If you have problems with any of the items, feel free to post your question on the unit message board so your classmates, and/or your instructor, can help you out!
- A heat engine has Carnot efficiency of 30%. Useful output from the engine is 1000J. How much heat is wasted?
- How can we improve the Carnot efficiency of a heat engine by changing the hot and cold reservoir temperatures?
- Most of the energy conversion devices that we use in our day-to-day life can be classified as Heat Engines. Give two examples.
Extra Resources
For more information on topics discussed in Lesson 3, see these selected References:
- Hinrichs, R. A., “Energy,” Saunders College Publishers, Philadelphia, PA, 1992.
- Aubrecht, G. L., “Energy,” Prentice Hall, Inc., Englewood Cliffs, NJ, 1995.
- Fay, J.A. and Golomb, D. S., “Energy and the Environment,” Oxford University Press, New York, NY, 2002.
- Christensen, J. W., “Global Science: Energy Resources Environment."
Lesson 3 Deliverables
Deliverable 1
You must complete a short quiz that covers the reading material in lesson 3. The Lesson 3 Quiz, can be found in the Lesson 3: Energy Efficiency module in Canvas. Please refer to the Calendar in Canvas for specific time frames and due dates.
Lesson 4: Energy and the Environment
The links below provide an outline of the material for this lesson. Be sure to carefully read through the entire lesson before returning to Canvas to submit your assignments.
Introduction
Welcome to Lesson 4!
Lesson 4 deals particularly with Energy and the Environment. As mentioned before in the unit overview, this lesson is divided into 3 parts. Part A is basically looking at the products that are formed when we burn fossil fuels and the environmental effects of these fossil fuels products. In part B we are going to look at global effects of using fossil fuels and how they are changing the environment. We will also look, some other climate issues like acid rain, ozone layer destruction up above in the stratosphere. Go through part A, part B, and part C; together there will be one quiz for this lesson.
Lesson 4 Objectives
Upon completion of this lesson, you will be able to:
- demonstrate a familiarity with fossil fuel composition;
- describe basic combustion chemistry;
- explain the quantitative implications of fossil fuel combustion;
- state the health and environmental effects of products of combustion; and
- describe the effects of primary and secondary pollutants.
See the Calendar tab in Canvas for due dates/times.
Questions?
If you have any questions, please post them to the General Course Questions forum in located in the Discussions tab in Canvas. I will check that discussion forum daily to respond. While you are visiting the discussion board, feel free to post your own responses to questions posted by others - this way, you might help a classmate!
Lesson 4a: Fossil Fuels and Products of Combustion
Introduction to Fossil Fuels and Products of Combustion
In the first lesson on the world and the U.S. energy supply, we clearly established that the dependence on fossil fuels is still high (still at about 80 percent of the total energy in 2021).
In this section, we are going to look at what the fossil fuels are and the consequences when these fossil fuels are burnt.
As you may recall from an earlier lesson, these fuels, which we primarily depend on, were formed over millions of years by compression of organic material (plant and animal sources) prevented from decay and buried in the ground. They include:
- Coal
- Natural Gas
- Petroleum Oil
Fossil Fuel Elements
Fossil fuels are hydrocarbons comprised primarily of the following elements: carbon and hydrogen and some sulfur, nitrogen, oxygen, and mineral matter. Mineral matter turns into ash when burnt.
The composition and the amounts of these elements change for different fossil fuels (coal, petroleum, and natural gas), but the elements are the same. For example, there is more hydrogen in liquid fuels than in coal per unit mass.
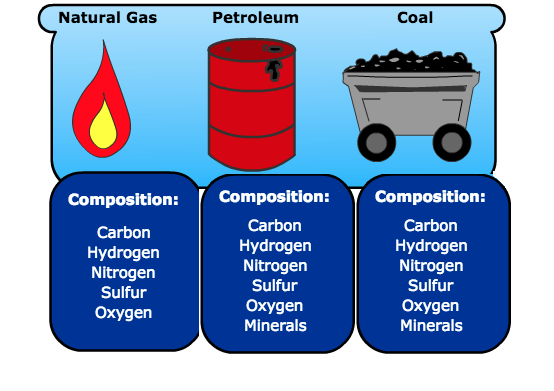
Natural gas is composed of carbon, hydrogen, nitrogen, sulfur, and oxygen.
Petroleum is composed of carbon, hydrogen, nitrogen, sulfur, oxygen, and minerals.
Coal is composed of carbon, hydrogen, nitrogen, sulfur, oxygen, and minerals.
Combustion is rapid oxidation of the fossil fuel’s elements resulting in the generation of heat. When these elements oxidize (or combine with oxygen), products of combustion are formed.
Instructions: Click on the purple hot spot shown above the piece of coal below to determine what products are formed from each during combustion.
Products of Combustion
Some of the fuel (hydrocarbon) may not completely burn during combustion and therefore is released into the atmosphere along with the products. The products that are formed during combustion of fossil fuels are shown in the image below:
Fossil fuels consisting mainly of carbon, hydrogen, nitrogen, sulfur, and oxygen produce the following products during combustion:
The primary pollutants are Carbon Monoxide (CO), Carbon Dioxide (CO2), Sulfur (SO2), Nitrogen Dioxide (NOx), Nitric Oxide (N2O), Volatile organic compounds (VOCs), and Hydrocarbons (HCs).
The particulate matter produced are Course particles less than 10 microns (PM10), Fine particles less than 2 microns (PM2.5), and Ammonia (NH3).
We will now look at six products of combustion:
- Carbon Dioxide
- Carbon Monoxide
- Sulfur Dioxide
- Nitrogen Oxides
- Lead
- Particulate Matter
Carbon Dioxide (CO2)
Carbon dioxide is one of the maor products of combustion with fossil fuels since carbon accounts for 60–90 percent of the mass of fuels that we burn.
China has emerged as the largest single emitter of energy-related CO2 emissions, surpassing the U.S. in carbon dioxide emissions back in 2010. Now, China emits more than 10 million metric tons while the U.S. hovers around 5 million metric tons. The chart below shows the trend in carbon dioxide emissions since 1980. For Asia and Oceania, and particularly for China and India, emissions can be seen to have increased significantly in the past two decades.
Click the Table, Map, and Chart tabs to see how CO2 emissions have changed over time and around the world:
In 2019, 29 % of CO2 emissions were from transportation, 25 % were from electricity production, 23 % were from industry processes the remaining quarter are from commercial, residential and agricultural applications.
Carbon Monoxide (CO)
If a carbon-based fuel and its products are not completely oxidized (i.e. not burned completely), carbon monoxide will be formed. Carbon monoxide, or CO, is a colorless, odorless gas. The figure below shows the contribution of various sources to the emissions of CO:
Carbon Monoxide is a component of motor vehicle exhaust, which contributes about 55 percent of all CO emissions nationwide. Other non-road engines and vehicles (such as construction equipment and boats) contribute about 22 percent of all CO emissions nationwide. Higher levels of CO generally occur in areas with heavy traffic congestion. In cities, 85 to 95 percent of all CO emissions may come from motor vehicle exhaust.
Other sources of CO emissions include industrial processes (such as metals processing and chemical manufacturing), residential wood burning, as well as natural sources such as forest fires. Woodstoves, gas stoves, cigarette smoke, and unvented gas and kerosene space heaters are sources of CO indoors.
The highest levels of CO in the outside air typically occur during the colder months of the year, when inversion conditions are more frequent. An inversion is an atmospheric condition that occurs when the air pollutants are trapped near the ground beneath a layer of warm air.
Sulfur Dioxide (SO2)
Sulfur dioxide, or SO2, belongs to the family of sulfur oxide gases (SOx). These gases dissolve easily in water. Sulfur is prevalent in all raw materials, including crude oil, coal, and ores that contain common metals, such as aluminum, copper, zinc, lead, and iron.
SOx gases are formed when fuel containing sulfur, such as coal and oil, is burned, and when gasoline is extracted from oil, or metals are extracted from ore. SO2 dissolves in water vapor to form acid and interacts with other gases and particles in the air to form sulfates and other products that can be harmful to people and their environment.
Nitrogen Oxides (NOx)
Nitrogen oxides, or NOx, is the generic term for a group of highly reactive gases, all of which contain nitrogen and oxygen in varying amounts. Many of the nitrogen oxides are colorless and odorless.
Nitrogen oxides form when fuel is burned at high temperatures, as in a combustion process. The primary sources of NOx are motor vehicles, electric utilities, and other industrial, commercial, and residential sources that burn fuels as shown in the figure below.
Although many of the nitrogen oxides are colorless and odorless, one common pollutant, nitrogen dioxide (NO2) along with particles in the air can often be seen as a reddish-brown layer over many urban areas.

Lead (Pb)
The major sources of lead emissions have historically been motor vehicles (such as cars and trucks) and industrial sources.
Due to the phase-out of leaded gasoline, metals processing is the major source of lead emissions to the air today. The highest levels of lead in air are generally found near lead smelters (devices that process lead ores). Other stationary sources are waste incinerators, utilities, and lead-acid battery manufacturers.

A man is pictured in a protective suit as he removes lead-based paint from the US Capitol Dome.
Lead is used in the manufacturing of many items, including
glass, rubber, paint, batteries, insecticides, plumbing, and
protective shielding for X-rays.
Particulate Matter (PM)
Particulate matter (PM) is the general term used to describe a mixture of solid particles and liquid droplets found in the air. Some particles are large enough to be seen as dust or dirt. Others are so small they can be detected only with an electron microscope.
Different sizes of Particles include:
- PM 2.5 describes the “fine” particles that are less than or equal to 2.5 µm (micro meter) in diameter.
- “Coarse fraction” particles are greater than 2.5 µm, but less than or equal to 10 µm in diameter.
- PM 10 refers to all particles less than or equal to 10 µm in diameter (about one-seventh the diameter of a human hair). PM can be emitted directly or formed in the atmosphere.
Different Sources of Particles include:
- "Primary" particles are formed from combustion sources and are emitted directly into the atmosphere. Examples of primary particles are dust from roads or black carbon (soot).
- "Secondary" particles are formed in the atmosphere from primary gaseous emissions. Examples of secondary particles are sulfates formed from SO2 emissions from power plants and industrial facilities; nitrates formed from NOx emissions from power plants, automobiles, and other combustion sources; and carbon formed from organic gas emissions from automobiles and industrial facilities.
The chemical composition of PM depends on location, time of year, and weather. Generally, primary particles make up coarse PM and secondary particles make up most of fine PM.
Health and Environmental Effects of Primary Pollutants
The pollutants that are emitted directly from a combustion process – or the products of combustion - are called “primary pollutants.” We just described these products earlier in the lesson, now we will look at their impact on the environment and human health.
Carbon Dioxide (CO2)
Carbon dioxide (CO2) is not a pollutant in the sense that would directly harm our health, but it is a proven greenhouse gas. It has an ability to absorb infrared radiation that is escaping from the surface of the earth, causing the atmosphere to warm up. Excessive emission of CO2 along with other greenhouse gases are linked to climate change, which is reaching a critical point.
Carbon Monoxide (CO)
As we learned earlier, Carbon monoxide, or CO, is a colorless, odorless and tasteless gas that is formed when carbon in fuel is not burned completely.
At much higher levels of exposure not commonly found in ambient air, CO can be poisonous, and even healthy individuals can be affected. Exposure to elevated levels of CO may result in:
- visual impairment;
- reduced work capacity;
- reduced manual dexterity;
- poor learning ability;
- difficulty in performing complex tasks.
The health threat from levels of CO sometimes found in the ambient air is most serious for those who suffer from cardiovascular disease such as angina pectoris.
In the human body, Hemoglobin (an iron compound) in the blood carries the oxygen (O20) from the lungs to various tissues and transports back carbon dioxide (CO2) to the lungs. Hemoglobin has 240 times more affinity toward CO than it does for oxygen. Therefore, when the hemoglobin reacts with CO, it reduces the hemoglobin that is available for the transport of O2. This in turn reduces oxygen supply to the body's organs and tissues.
Sulfur Dioxide (SO2)
High concentrations of SO2 can result in the following health problems:
Short-term exposure
- Adults and children with asthma who are active outdoors will experience temporary breathing impairment.
- Individuals with asthma may experience breathing difficulties with moderate activity and may exhibit symptoms such as wheezing, chest tightness, or shortness of breath.
Long-term exposure (along with high levels of PM)
- Aggravation of existing cardiovascular disease
- Respiratory illness
- Alterations in the lungs’ defenses
The subgroups of the population that may be affected under these conditions include individuals with heart or lung disease, as well as the elderly and children.
The body's reaction to regular and acidic air
Instructions: Click on the types of air and observe what happens for each. (Note: The animation has no audio.)
As a person breathes, regular air enters the lungs through open passageways, filters through the lungs and exits the body through the same open passage as carbon dioxide. However, when the air is acidic, it causes the airways to restrict, and the body must now use twice the energy to evacuate the same amount of carbon dioxide.
Together, SO2 and NOx (discussed on the next page) are the major precursors to acidic deposition (acid rain), which is associated with the acidification of soils, lakes, and streams and accelerated corrosion of buildings and monuments. We will talk more about this in the next section. SO2 also is a major precursor to PM 2.5, which is a significant health concern, and a main contributor to poor visibility.
Health and Environmental Effects of Primary Pollutants, page 2
Nitrogen Oxides (NOx)
Nitric oxide (NO) and nitrogen dioxide (NO2) together are represented by NOx. Most of the emissions from combustion devices (approximately 90%) are in the form of NO.
NOx react in the air to form ground-level ozone and fine particulates, which are associated with adverse health effects.
- Short-term exposures (e.g., less than 3 hours) to low levels of NO2 may lead to changes in airway responsiveness and lung function in individuals with preexisting respiratory illnesses. These exposures may also increase respiratory illnesses in children.
- Long-term exposures to NO2 may lead to increased susceptibility to respiratory infection and may cause irreversible alterations in lung structure.
NOx contributes to a wide range of environmental effects directly and when combined with other precursors in acid rain and ozone.
- Increased nitrogen inputs to terrestrial and wetland systems can lead to changes in plant species composition and diversity.
- Direct nitrogen inputs to aquatic ecosystems such as those found in estuarine and coastal waters (e.g., Chesapeake Bay) can lead to eutrophication (a condition that promotes excessive algae growth, which can lead to a severe depletion of dissolved oxygen and increased levels of toxins harmful to aquatic life).
- Nitrogen, alone or in acid rain, also can acidify soils and surface waters.
Acid rain can ruin a fishing trip!
Acidification of soils causes the loss of essential plant nutrients and increased levels of soluble aluminum that are toxic to plants. Acidification of surface waters creates conditions of low pH and levels of aluminum that are toxic to fish and other aquatic organisms. NOx also contributes to visibility impairment.
Particulate Matter (PM)
Particles smaller than or equal to 10 µm (micro meter or millionth of a meter) in diameter can get into the lungs and can cause numerous health problems. Inhalation of these tiny particles has been linked with illness and death from heart and lung disease. Various health problems have been associated with long-term (e.g., multi-year) exposures to these particles. Shorter-term daily and potentially even shorter term peak (e.g., 1-hour) exposures to these particles can also be associated with health problems.
Particles can aggravate respiratory conditions, such as asthma and bronchitis, and have been associated with cardiac arrhythmias (heartbeat irregularities) and heart attacks. People with heart or lung disease, the elderly, and children are at highest risk from exposure to particles.
Particles of concern can include both fine and coarse-fraction particles, although fine particles have been more clearly linked to the most serious health effects.
- Particles larger than 2 micro meters (µm) do not penetrate beyond the nasal cavity or trachea.
- Particles smaller than 0.1 µm tend to deposit in tracheobronchia tree and are removed when exhaling.
- Particles between 0.1 and 2.0 µm penetrate deep into the lungs and settle in respiratory bronchioles or alveolar sacs
In addition to health problems, PM is the major cause of reduced visibility in many parts of the United States by scattering and absorbing some of the light emitted or reflected by the body reducing the contrast. Airborne particles can also impact vegetation and ecosystems, and can cause damage to paints and building materials.
How particulate matter is breathed into the human body
Instructions: See what happens when the name of each size of particulate matter is clicked on. (Note: The animation has no audio.)
How particulate matter is breathed into the human body is dependent on the size of the matter.
Particles smaller than .1 micrometers tend to deposit in the tracheobronchial tree and are removed when exhaling. Particles between .01 and 2 micrometers penetrate deep into the lungs and settle in respiratory bronchioles or alveolar sacs. These particles stay in the lungs. Particles larger than 2 micrometers do not penetrate beyond the nasal cavity or trachea. They exit the body during a cough or sneeze.
Lead
Exposure to lead occurs mainly through inhalation of air and ingestion of lead in food, water, soil, or dust. It accumulates in the blood, bones, and soft tissues and can adversely affect the kidneys, liver, nervous system, and other organs.
- Excessive exposure to lead may cause neurological impairments such as seizures, mental retardation, and behavioral disorders.
- Even at low doses, lead exposure is associated with damage to the nervous systems of fetuses and young children, resulting in learning deficits and lowered IQ.
- Recent studies indicated that lead may be a factor in high blood pressure and subsequent heart disease.
- Lead can also be deposited on the leaves of plants, presenting a hazard to grazing animals and to humans through ingestion.
Instructions: Click the "play" button to see the impact of using unleaded rather than leaded gasoline. (Note: The animation has no audio.)
In the mid-1970s, the use of leaded gasoline caused the amount of lead particles in the air to reach 200 million tons. The use of unleaded gasoline has reduced that amount to 4 million tons of lead particles in the air today.
Secondary Pollutants
The pollutants that are emitted directly from a combustion process are called “primary pollutants.” When emitted into the atmosphere, these primary pollutants combine with other reactants and form “secondary” pollutants.
An example of a secondary pollutant would be ozone. When hydrocarbons are emitted, and they react with NOx in presence of sunlight, they form ozone. Health and environmental effects of secondary pollutants are discussed in the next section: Global and Regional Effects of Pollutants.
Lesson 4b: Global and Regional Effects of Secondary Pollutants
Introduction to Global and Regional Effects of Secondary Pollutants
The Earth is continuously receiving energy from the sun. Energy also leaves the Earth at night (of course in the form of invisible infrared energy!). Otherwise, the Earth would be continuously warming up. This delicate balance between the energy coming in and leaving due to natural greenhouse effect is what keeps the planet warm enough for us to live on.
It is very obvious that if more energy comes in than the energy that leaves, the planet will become warm. Similarly, if the energy that leaves is more than the energy that comes in, the planet will become cool. The atmospheric temperature fluctuates over centuries due to certain natural causes. However, our "recent" (on a geological timescale) use of fuels that have been trapped underground are quickly changing the environment outside of these natural norms.
Go to the next screen to view an animation of the greenhouse effect.
Greenhouse Effect
In the first lesson, we saw that energy can be transformed from one form to another, and during this conversion, all the energy that we put into a device comes out. However, all the energy that we put in may not come out in the desired form. Please watch the following presentation:
What is the greenhouse effect?
Earth is a comfortable place for living things. It’s just the right temperatures for plants and animals – including humans – to thrive.
Why is Earth so special? Well, one reason is: the greenhouse effect! A greenhouse is a building with glass walls and a glass roof. The clear glass allows sunlight to shine into the greenhouse, while also trapping the Sun’s heat inside. This is how a greenhouse keeps plants warm, even at night and in the winter.
The greenhouse effect keeps Earth warm in pretty much the same way. Earth isn’t surrounded by glass, but it is surrounded by a jacket of gases called the atmosphere. In the daytime, the Sun shines through the atmosphere warming Earth’s surface. After the Sun goes down, Earth’s surface cools. This releases heat back into the air. But, some of that heat is trapped by the gases in the atmosphere. These heat-trapping gases are called greenhouse gases. Carbon dioxide, water vapor and methane are all examples of greenhouse gases.
Earth needs a balance of greenhouse gases to maintain just the right temperature for living things. But, some human activities are changing Earth’s natural greenhouse effect. For example, burning fossil fuels – like coal and oil – releases more carbon dioxide into our atmosphere. These extra greenhouse gases can cause the atmosphere to trap more and more heat, leading to a warmer Earth.
NASA satellites are constantly measuring the gases in our atmosphere from space. They have observed increases in the amount of carbon dioxide and other greenhouse gases. The information from NASA satellites can help scientists figure out where greenhouse gases are coming from and how they are ending up in our atmosphere. This information will help us better understand the impact that greenhouse gases have on our climate. And help us better understand this very special greenhouse that we call home.
Find out more about our Earth at NASA Climate Kids!
As can be seen from the Figure below, the amount of CO2 currently in the atmosphere is dramatically higher than previous levels even if we go back 800,000 years!
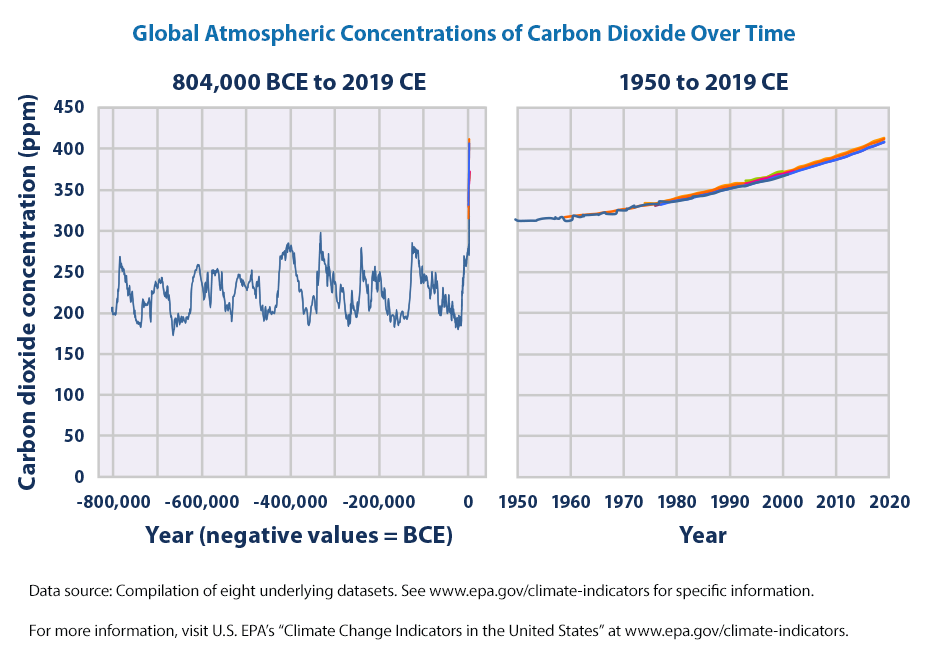
The onset of this dramatic rise corresponds to the industrial revolution and humanities increased use of CO2 producing fuels.
Greenhouse Gases
Our relationships with the greenhouse effect and greenhouse gases are complicated. A little bit is a good thing, and it plays a big role in what keeps us comfortable. However, too many greenhouse gases will heat up our planet and dramatically change climates throughout the world. It's also worth mentioning that CO2 is not the only greenhouse gas being produced by human activity.
The concentration of greenhouse gases in the atmosphere has been changing over the past 150 years. Since pre-industrial times, atmospheric concentrations of the gases have increased:
- CO2 has climbed over 31 percent.
- CH4 has climbed over 151 percent.
- N2O has climbed 17 percent.
Scientists have confirmed that this is primarily due to human activities, which include burning coal, oil, and gas, and cutting down forests.

Check this out!
Hold your mouse over the pie chart to see what percentage each gas accounts for in the total greenhouse emissions in the United States, and look at the table below for information about the sources of the gasses.
| Greenhouse Gas | Percent of Total Greenhouse Gases |
|---|---|
| Carbon Dioxide (C02) - Energy Related | 82% |
| Carbon Dioxide (C02) - Other | 2% |
| Methane (CH4) | 9% |
| Nitrous Oxide (N2O) | 5% |
| Other Gases (CFC-12, HCFC-22, CF4, SF6) | 2% |
The following list shows the greenhouse gasses and the source of emission:
- Carbon dioxide (CO2): Energy related CO2: 82% and Other CO2: 2%.
Produced by combustion of solid waste, fossil fuels, and wood and wood products. - Methane (CH4): 9%.
Source is the production and transport of coal, natural gas, and oil. Methane emissions also result from the decomposition of organic wastes in municipal solid waste landfills, and the raising of livestock. - Nitrous Oxide (N2O): 5%.
Produced by agricultural and industrial activities, as well as during combustion of solid waste and fossil fuels. - Other gases (SO2, CFC-12, HCFC-22, Perfluoromethane [CF4], and Sulfur Hexaflouride [SF6]): 2%.
Produced by industrial processes.
As you can see, energy related CO2 and CH4 accounts for 90 percent of the total greenhouse gas emissions in the United States. This highlights the impact of energy use on the environment.
Atmospheric lifetime is the period of time during which a gas changes and is either transformed or removed from the atmosphere.
GWP is an index defined as the cumulative radiative forcing (infrared radiation absorption) between the present and some chosen time horizon caused by a unit mass of gas emitted now, expressed relative to a reference gas such as CO2, as is used here. GWP is an attempt to provide a simple measure of the relative radiative effects of different greenhouse gases. In terms of GWP, methane is a much stronger greenhouse gas (~30x more potent) compared to CO2.
How Has CO2 Concentration Changed?
As you can see from the graph below, CO2 values have risen dramatically in a very short amount of time. These changes correspond to our increased reliance on fossil fuels which took off in the 1900s.
Try This!
Instructions: In the graph below, observe how CO2 concentration in the atmosphere has changed over the past 50 years. Based on your observations, answer the questions that follow.
| Year | Parts per million (ppm) |
|---|---|
| 1960 | 310 |
| 1970 | 320 |
| 1980 | 340 |
| 1990 | 360 |
| 2000 | 380 |
| 2010 | 390 |
| 2020 | 420 |
Data from the graph above was obtained from ice core samples of trapped air. More specifically, ice in the Polar Regions traps air from that particular time period, and then new ice is deposited over the previously deposited ice, trapping more air from the past. Thus, the analysis of ice core samples provides the composition of past air, which can be used to determine the past temperatures.
The increase in the greenhouse gases between 1950 and 2020 is believed to have caused an increase in the global temperature. The mean increase in the global temperature over the past one century is about 1 degree Celsius. However, this is the global average, which does not distinguish between ocean surface and land surface temperatures. The ocean surface increased by about 0.77 degree C whereas land temperatures increased by a staggering 1.43 degree C compared to pre-1900 temperatures. In other words, land areas are heating up about twice as fast!
Instructions: Review the graph below, showing the Annual mean for the Global surface temperature between years 1960 and 2020. The annual mean will show the detailed fluctuations.
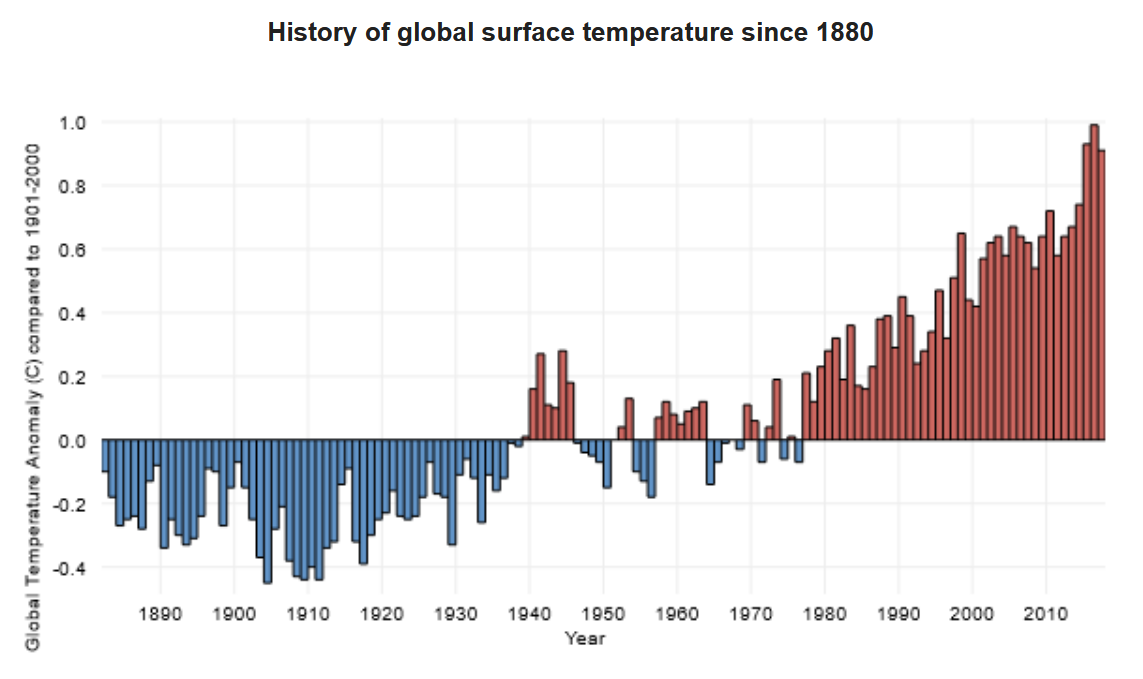

Since 1880, about when the industrial age first started, the average increase in global temperature has been 1 degree Celsius.Not only has there been an increase in temperatures with the increase of greenhouse gasses, there has also been an increase in CO2 emissions from fossil fuels – this has been apparent over the last 150 years (since about 1850).
If we overlay the temperature plot with CO2 emissions, you can see a strong correlation between the rise in temperature and increased CO2 production.
So what will happen in the next few decades? Well, it is hard to say because it depends on what we do in the future. Do we continue to replace fossil fuels with renewables, or do we hold onto our existing practices a bit longer? Experts have tried to predict what will happen to global temperatures based on what we currently know about our climate. A key variable is how much additional CO2 we emit over the next few decades.

These assumptions are used within climate models to predict possible temperature changes into the year 2100.

Though a few degrees doesn't seem like much, this is only the average temperature across the whole planet. In practice, many regions on land will have temperature increases far beyond a few degrees. As such, many predict an increase in the frequency and magnitude of heat waves, forest fires and other nature disasters. These factors are pushing societies to weigh the consequences of cheap fuels with their environmental impacts.
What is Known for Certain
Human activities change the earth's atmosphere.
Scientists know for certain that human activities are changing the composition of Earth's atmosphere. Increasing levels of greenhouse gases in the atmosphere, like carbon dioxide (CO2), have been well documented since pre-industrial times. There is no doubt this atmospheric buildup of carbon dioxide and other greenhouse gases is largely the result of human activities.
It's well accepted by scientists that greenhouse gases trap heat in the Earth's atmosphere and tend to warm the planet. By increasing the levels of greenhouse gases in the atmosphere, human activities are strengthening Earth's natural greenhouse effect. The key greenhouse gases emitted by human activities remain in the atmosphere for periods ranging from decades to centuries.
A warming trend of about 1oC has been recorded since the late 19th century. Warming has occurred in both the northern and southern hemispheres, and over the oceans. Confirmation of twentieth-century global warming is further substantiated by melting glaciers, decreased snow cover in the Northern Hemisphere, and even warming below ground.
What is Likely but Uncertain, Impact of Global Warming
Impact of Global Warming on such things as health, water resources, polar regions, coastal zones, and forests is likely, but it is uncertain to what extent.
Health
The most direct effect of climate change would be the impacts of the hotter temperatures, themselves. Extremely hot temperatures increase the number of people who die on a given day for many reasons:
- People with heart problems are vulnerable because one's cardiovascular system must work harder to keep the body cool during hot weather.
- Heat exhaustion and some respiratory problems increase.
- Higher air temperatures also increase the concentration of ozone at ground level.
- Diseases that are spread by mosquitoes and other insects could become more prevalent if warmer temperatures enabled those insects to become established farther north; such "vector-borne" diseases include malaria, dengue fever, yellow fever, and encephalitis.
Water Resources
Changing climate is expected to increase both evaporation and precipitation in most areas of the United States. In those areas where evaporation increases more than precipitation, soil will become drier, lake levels will drop, and rivers will carry less water. Lower river flows and lower lake levels could impair navigation, hydroelectric power generation, and water quality, and reduce the supplies of water available for agricultural, residential, and industrial uses. Some areas may experience increased flooding during winter and spring, as well as lower supplies during summer.
Polar Regions
Climate models indicate that global warming will be felt most acutely at high latitudes, especially in the Arctic, where reductions in sea ice and snow cover are expected to lead to the greatest relative temperature increases. Ice and snow cool the climate by reflecting solar energy back to space, so a reduction in their extent would lead to greater warming in the region.
Coastal Zones
Sea level is rising more rapidly along the U.S. coast than worldwide. Studies by EPA and others have estimated that along the Gulf and Atlantic coasts, a one-foot (30 cm) rise in sea level is likely by 2050.
In the next century, a two-foot rise is most likely, but a four-foot rise is possible. Rising sea level inundates wetlands and other low-lying lands, erodes beaches, intensifies flooding, and increases the salinity of rivers, bays, and groundwater tables. Low-lying countries like the Maldives located in the Indian Ocean and Bangladesh may be severely affected. The world may see global warming refugees from these impacts.
Forests
The projected 2°C (3.6°F) warming could shift the ideal range for many North American forest species by about 300 km (200 mi.) to the north.
- If the climate changes slowly enough, warmer temperatures may enable the trees to colonize north into areas that are currently too cold, at about the same rate as southern areas became too hot and dry for the species to survive. If the Earth warms 2°C (3.6°F) in 100 years, however, the species would have to migrate about 2 miles every year.
- Poor soils may also limit the rate at which tree species can spread north.
- Several other impacts associated with changing climate further complicate the picture:
- On the positive side, CO2 has a beneficial fertilization effect on plants, and also enables plants to use water more efficiently. These effects might enable some species to resist the adverse effects of warmer temperatures or drier soils.
- On the negative side, forest fires are likely to become more frequent and severe if soils become drier.
What is Uncertain
The long-term effects of global warming
Scientists have identified that our health, agriculture, water resources, forests, wildlife, and coastal areas are vulnerable to the changes that global warming may bring. But projecting what the exact impacts will be over the twenty-first century remains very difficult. This is especially true when one asks how a local region will be affected.
Scientists are more confident about their projections for large-scale areas (e.g., global temperature and precipitation change, average sea level rise) and less confident about the ones for small-scale areas (e.g., local temperature and precipitation changes, altered weather patterns, soil moisture changes). This is largely because the computer models used to forecast global climate change are still ill-equipped to simulate how things may change at smaller scales.
Some of the largest uncertainties are associated with events that pose the greatest risk to human societies. IPCC cautions, "Complex systems, such as the climate system, can respond in non-linear ways and produce surprises." There is the possibility that a warmer world could lead to more frequent and intense storms, including hurricanes. Preliminary evidence suggests that, once hurricanes do form, they will be stronger if the oceans are warmer due to global warming. Stil, the net result appears to be a more complex environment that is less hospitable compared to what we are accustomed.
Solutions for Global Warming
Today, there is no single action that will reverse the course of climate change. The main question is whether we want to wait and adapt to a new environment, or whether we want to start to do something now?
There is certainty that human activities are rapidly adding greenhouse gases to the atmosphere, and that these gases warm our planet. This is the basis for concern about global warming.
The fundamental scientific uncertainties are these: How much more warming will occur? How fast will this warming occur? And what are the potential adverse effects? These uncertainties will be with us for some time, but many suspect that point of no return is well past us. If we don't change our habits soon, we will be stuck with a warmer world until we find a way to reduce the concentration of greenhouse gases in our atmosphere.
Global warming poses real risks, and those risks increase as we continue to change the composition of the atmosphere. Ultimately, this is why we have to use our best judgment—guided by the current state of science—to determine what the most appropriate response to global warming should be.
What difference can I make?
When faced with this question, individuals should recognize that, collectively, they can make a difference. In some cases, it only takes a little change in lifestyle and behavior to make some big changes in greenhouse gas reductions. For other types of actions, the changes are more significant.
When that action is multiplied by the 300 million people in the U.S. or the 7 billion people worldwide, the savings are significant. The actions include being energy efficient in the house, in the yard, in the car, and in the store.
Everyone's contribution counts, so why not do your share?
Energy Efficiency Means Doing the Same (or More) with less Energy. When individual action is multiplied by the 300 million people in the U.S., or the 6 billion people worldwide, the savings can be significant.
How Can I Save the Environment?
Instructions: You can help save the environment by making changes from the top to the bottom of your home. Click on the hot spots below to see how you can make a difference:
Review
To review, these are the things you can do in your home – from top to bottom - to protect from the environment:
- Purchase "Green Power" - electricity that is generated from renewable sources such as solar, wind, geothermal, or biomass - for your home's electricity, if available from your utility company. Although the cost may be slightly higher, you'll know that you are buying power from an environmentally friendly energy source.
- Insulate your home – you’ll learn more about this in Home Activity Three.
- Use low-flow faucets in your showers and sinks.
- Replace toilets with water-saving lavatories.
- Purchase home products—appliances, new home computers, copiers, fax machines, that display the ENERGY STAR® label - You can reduce your energy consumption by up to 30 percent and lower your utility bills! Remember, the average house is responsible for more air pollution and carbon dioxide emissions than is the average car.
- When your lights burn out, replace them with energy-efficient compact fluorescent lights.
- Lower the temperature on your hot water tank to 120 degrees.
- Tune up your furnace.
- Insulate your water heater and all water pipes to reduce heat loss.
When you remodel, build, or buy a new home, incorporate all of these energy efficiency measures—and others.
Each of us, in the U.S., contributes about 22 tons of carbon dioxide emissions per year, whereas the world average per capita is about 6 tons.
The good news is that there are many ways you and your family can help reduce carbon dioxide pollution and improve the environment for you and your children.
Lesson 4c: Acid Rain and the Ozone
Introduction to Acid Rain and the Ozone
Acid rain is a serious environmental problem around the world, particularly affecting Asia, Europe, and large parts of the U.S. and Canada. The acidic pollutants such as SO2 and NOx are emitted into the environment by combustion of fossil fuels.
Most of the sulfur in any fuel combines with oxygen and forms SO2 in the combustion chamber. This SO2 when emitted into the atmosphere slowly oxidizes to SO3. SO3 is readily soluble in water in the clouds and forms H2SO4 (sulfuric acid).
Most of the NOx that is emitted is in the form of NO. This NO is oxidized in the atmosphere to NO2. NO2 is soluble in water and forms HNO3 (nitric acid).
Acid Deposition
Sunlight increases the rate of most of the SO2 and NO reactions. The result is a mild solution of sulfuric acid and nitric acid. "Acid rain" is a broad term used to describe several ways that acids fall out of the atmosphere. A more precise term is acid deposition, which has two parts: wet and dry.
- Wet deposition - refers to acidic rain, fog, and snow. As this acidic water flows over and through the ground, it affects a variety of plants and animals. The strength of the effects depend on many factors, including:
- the acidity of the water;
- the chemistry and buffering capacity of the soils involved;
- the types of fish, trees, and other living things that rely on the water.
- Dry deposition - refers to acidic gases and particles. About half of the acidity in the atmosphere falls back to earth through dry deposition.
- Acidic particles and gases are blown by the wind onto buildings, cars, homes, and trees.
- Dry deposited gases and particles can also be washed from trees and other surfaces by rainstorms. When that happens, the runoff water adds those acids to the acid rain, making the combination more acidic than the falling rain alone.
Process of Acid Deposition
Prevailing winds blow the compounds that cause both wet and dry acid deposition across state and national borders, and sometimes over hundreds of miles. Please watch the 1:22 presentation below to learn more about the process of acid deposition.
In this diagram, we are seeing how the acid deposition occurs. When the sources emit pollutants such as SO2, NOx, mercury, and volatile organic compounds, primarily SO2 and NOx, which are acidic gases, are deposited in two ways. One is dry deposition, the other one is wet deposition. The SO2 and NOx when they deposit back either gaseous pollutants or as particulates, it's called dry deposition. When these pollutants dissolve in water, cloud water, and then deposit, it's called wet precipitation. Or that is what we call acid rain. The dry, gaseous pollutants or particulate matter can sometimes get dissolved in water and come down again as wet precipitation. Receptors are the species that receive this acid rain and get affected. These receptors can be materials that we care about, or aquatic life, human beings, or lakes and streams.
pH Scale
Acid rain is measured using a pH scale.
pH is a measure of hydrogen ion concentration, which is measured as a negative logarithm. In other words, acids produce hydrogen ions and alkalis produce hydroxyl ions, so pH is the power of a solution to yield hydrogen ions [H+].
The pH scale ranges from 0 to 14 and indicates how acidic or basic a substance is.
- A pH of 7 is neutral.
- A pH less than 7 is acidic.
- A pH greater than 7 is basic.
The lower a substance's pH, the more acidic it is. Each whole pH value below 7 (the neutral point) is ten times more acidic than the next higher value.
- For example, a pH of 4 is ten times more acidic than a pH of 5 and 100 times (10 times 10) more acidic than a pH of 6.
The higher a substance’s pH, the more basic or alkaline it is.
- Each whole pH value above 7 is ten times more alkaline (another way to say basic) than the next lower whole value.
- For example, a pH of 10 is ten times more alkaline than a pH of 9.
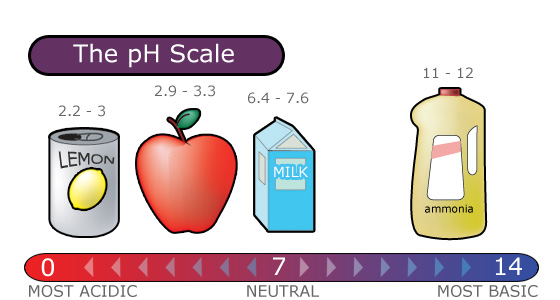
Effects of Acid Rain
Overview
Pure water has a pH of 7.0. Normal rain is slightly acidic because carbon dioxide dissolves into it, so it has a pH of about 5.5. As of the year 2000, the most acidic rain falling in the US has a pH of about 4.3.
Below is a video demonstration that replicates the effect of acid rain on plant life. In this video, beans are placed in: a) water, b) slightly acidic water and c) acidic water, and their growth is observed over a period of three days. Please watch the following 5:35 video:
We are learning about the environmental effects of acid rain. Acid rain is basically the compounds that form acid are mixing with the water in the clouds and coming down acidic rain. As it can be created at home using various day-to-day ingredients, one of them is vinegar, or you could use, also, lemon juice, that has a lot of acid. So what we are going to do in this demonstration today is to see the effect of acid rain on spouting off moon beans. These are a special kind of beans. And you can use, actually, most of the types of beans which have hard shell on the outside. So we are using here three different bowls here. Each of these bowls is filled with 20 beans, 20 seeds of these moon beans. And we are going to pour plain water in this one, and slightly acidic water in this bowl, and highly acidic water in this bowl, and see every day-- tomorrow, day after, and a day after that-- how this acid changes the spouting off these beans.
So let's actually prepare this and add plain water to the first one. This is plain water, just water from the faucet. I'm going to add enough water so that these beans are all immersed in the water. Now the slightly acidic water I'm preparing by adding vinegar that I have here. And now this is a bottle of vinegar. And I'm going to add two spoons of vinegar to this. So this water in this cup is slightly acidic. I'm going to mix this and use this water. This is slightly acidic water. And I'm going to pour slightly acidic water in here. There are 20 beans in this cup, in this bowl, also. And I'm going to prepare highly acidic water here with the same vinegar. I'm going to add five spoons-- one, two, three, four, five. This is a little bit stronger than the other acid that we prepared. Now I'm going to add this highly acidic water to this bowl to the same level. And as the water evaporates, whatever type of water-- as the water evaporates, we need to refill with the same kind of water-- plain water in this bowl, slightly acidic water in this bowl. And highly acidic water in this bowl-- and observe the results.
And what I want you to now hypothesize is which one would have the significant effects. Which one would have the significant effect? Or which one of these bowls will have more sprouting than the other? And when you look at day one, day two, day three, I need you to count the number of seeds that are sprouting. And you can prepare a plot. Let's say on day one, the plain water ones sprouted six out of 20, which means 30% have sprouted. Slightly acidic ones, four out of 20. So that's 25%. Highly acidic one, six out of 20. That's, again, 30%. So you can plot that as a function of time and see at the end of four or five days how many of these seeds sprout. Let's watch for three days. OK. We are on day three today. And you can see on day one itself we had all 20 out of 20 sprouted in this plain water. And slightly acidic water, we didn't have any sprouts. Even today, we don't have any sign of sprouting in highly acidic water. That is the impact that you can see of the acidity on sprouting of seeds.
Now you can imagine what it would be like for the entire planet if it is covered with acidic rain. And what would be the impact on agriculture? What would be the impact on food supply chain to the humanity? So that is what we learned from this exercise.
Negative Consequences
Acid rain results in many negative consequences. Place your mouse over the image below to see the effects of acid deposition.
Effects of Acid Rain on Forests and Aquatic Life
Effects of Acid Rain on Forests
Acid rain does not usually kill trees directly. Instead, it is more likely to weaken trees by:
- damaging their leaves
- limiting the nutrients available to them
- exposing them to toxic substances slowly released from the soil
Quite often, injury or death of trees is a result of these effects of acid rain in combination with one or more additional threats. Click on the hot spots in the image below to see the effects of acid rain on the forest:
Effects of Acid Rain on Aquatic Life
Acid rain causes acidification of lakes and streams and contributes to damage of trees at high elevations (for example, red spruce trees above 2,000 feet) and many sensitive forest soils. Several regions in the U.S. were identified as containing many of the surface waters sensitive to acidification. They include the:
- Adirondacks and Catskill Mountains in New York State;
- Mid-Appalachian Highlands along the east coast;
- Upper Midwest;
- Mountainous areas of the Western United States.
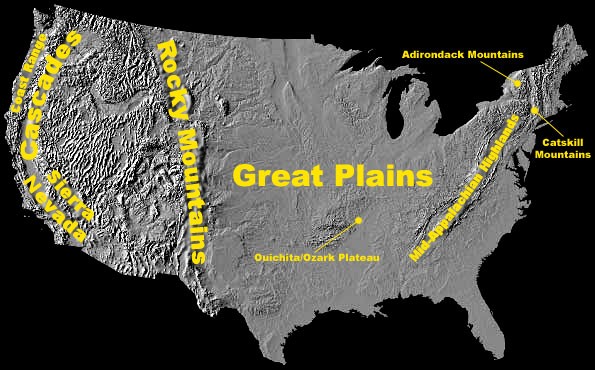
Some types of plants and animals can handle acidic waters. Others, however, are acid-sensitive and will be lost as the pH declines. View the image of the fish, shellfish, and insects below to see what pH levels they can tolerate:
Bass - Acid tolerance of up to pH 5.5
Perch - Acid tolerance of up to pH 4.5
Frogs - Acid tolerance of up to pH 4.0
Salamander - Acid tolerance of up to pH 5.0
Clams - Acid tolerance of up to pH 6.0
Crayfish - Acid tolerance of up to pH 5.5
Snails - Acid tolerance of up to pH 6.0
Mayfly - Acid tolerance of up to pH 5.5
Effects of Acid Rain on Materials, Visibility and Human Health
Effects of Acid Rain on Materials
Acid rain and the dry deposition of acidic particles contribute to the corrosion of metals (such as bronze) and the deterioration of paint and stone (such as marble and limestone). These effects seriously reduce the value to society of buildings, bridges, cultural objects (such as statues, monuments, and tombstones), and cars.

Effects of Acid Rain on Visibility
Sulfates and nitrates that form in the atmosphere from sulfur dioxide (SO2) and nitrogen oxides (NOx) emissions contribute to visibility impairment, meaning we can't see as far or as clearly through the air.
Eastern United States
Sulfate particles account for 50 to 70 percent of the visibility reduction in the eastern part of the United States, affecting our enjoyment of national parks, such as the Shenandoah and the Great Smoky Mountains.
Through the Acid Rain Program, SO2 reductions will be completed to improve visual range at national parks located in the eastern United States. Based on a study of the value national park visitors place on visibility, these reductions are expected to be worth over a billion dollars annually by the year 2010.

Western United States
In the western part of the United States, nitrates and carbon also play roles, but sulfates have been implicated as an important source of visibility impairment in many of the Colorado River Plateau national parks, including the Grand Canyon, Canyonlands, and Bryce Canyon.
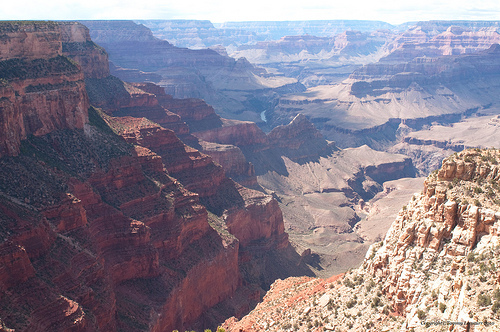
Effects of Acid Rain on Human Health
Acid rain looks, feels, and tastes just like clean rain. The harm to people from acid rain is not direct. Walking in acid rain, or even swimming in an acid lake, is no more dangerous than walking or swimming in clean water. However, the pollutants that cause acid rain also damage human health.
- Effects of Sulfur Dioxide (SO2): These gases interact in the atmosphere to form fine sulfate and nitrate particles that can be transported long distances by winds and inhaled deep into people's lungs. Fine particles can also penetrate indoors. Many scientific studies have identified a relationship between elevated levels of fine particles and increased illness and premature death from heart and lung disorders, such as asthma and bronchitis.
- Effects of Nitrogen Oxide (NOx): Decrease in nitrogen oxide emissions are also expected to have a beneficial impact on human health by reducing the nitrogen oxides available to react with volatile organic compounds and form ozone. Ozone impacts on human health include a number of morbidity and mortality risks associated with lung inflammation, including asthma and emphysema.
Protecting the Environment
You can do the following to protect the environment:
- Turn off lights, computers, and other appliances when you're not using them.
- Use energy efficient appliances: lighting, air conditioners, heaters, refrigerators, washing machines, etc.
- Only use electric appliances when you need them.
- Keep your thermostat at 68°F in the winter and 72°F in the summer. You can turn it even lower in the winter and higher in the summer when you are away from home.
- Insulate your home as best you can.
- Carpool, use public transportation, or better yet, walk or bicycle whenever possible.
- Buy vehicles with low NOx emissions, and maintain all vehicles well.
Introduction to Ozone
Ozone (O3) is a triatomic oxygen molecule gas that occurs both in the Earth’s upper atmosphere and at ground level. Ozone can be good or bad, depending on where it is found: It is a bluish gas that is harmful to breathe. Therefore, it is bad at the ground level.
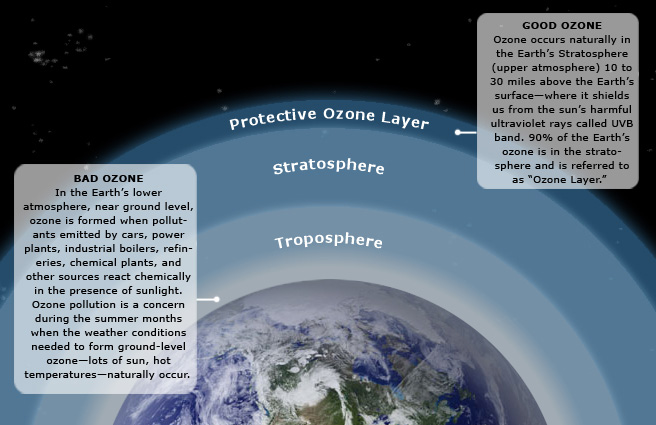
Good ozone occurs naturally in the Earth's Stratosphere (upper atmosphere) 10 to 30 miles above the Earth's surface-where it shields us from the sun's harmful ultraviolet rays called UVB band. 90% of the Earth's ozone is in the stratosphere and is referred to as Ozone Layer.
Bad ozone occurs in the Earth's lower atmosphere, near ground level, when pollutants emitted by cars, power plants, industrial boilers, chemical plants, and other sources react chemically in the presence of sunlight. Ozone pollution is a concern during the summer months, when the weather conditions needed to form ground level ozone (lots of sun and hot temperatures) naturally occur.
The Ozone Cycle
The presentation below shows the process of ozone depletion. Ozone depletion is caused by chlorofluorocarbons (CFCs) and other ozone-depleting substances. Please watch the following 1:16 video.
In this picture we are seeing how the ozone layer is destroyed and the effects of that destruction. Certain compounds such as chlorofluorocarbons, CFC’s, are released into the atmosphere by human activities and these CFC’s particularly, they are very, very unreactive at the atmospherical ground level and they go all the way up to the stratosphere and then the CFC’s dissociate or give up the chlorine. Each chlorine atom is capable of destroying or basically turning ozone into oxygen and which again doesn’t have the same capability as ozone does in shielding us from the UV radiation. And once that ozone layer or the number of ozone molecules in that layer goes down, more and more UV rays can pass through the atmosphere and reach the surface and can cause more skin cancer and cataracts in older people.
Production and Destruction of Ozone
Ozone is constantly produced and destroyed in a natural cycle, as shown in the figure below. However, the overall amount of ozone is essentially stable. This balance can be thought of as a stream's depth at a particular location. Although individual water molecules are moving past the observer, the total depth remains constant. Similarly, while ozone production and destruction are balanced, ozone levels remain stable. This was the situation until the past several decades. Please watch the following 1:32 video about ozone destruction.
Here we are looking at the ozone science. How the ozone is produced and how the ozone is destroyed. In the first step, the oxygen molecules are photolyzed or converted by the UV rays that are coming from the sun into two oxygen atoms; nascent oxygen atoms. Oxygen atoms are very, very reactive, and they react with another oxygen molecule and form ozone, O3. Ozone and oxygen atoms are continually being interconverted as rays break the ozone and turns into nascent oxygen and oxygen molecules. And the oxygen atom again reacts with the oxygen molecules, forms ozone. Our activities, which are producing the CFC’s and liberating into the atmosphere, they are going, and these chlorine atoms are destroying the ozone molecules in addition to the natural process of formation and destruction. That is what is causing the reduction in the concentration of ozone in the stratosphere and when the concentration goes down below certain levels, like 220 Dobson units, we call that ozone hole. Ozone hole does not mean that there is a big hole up there, but what it means is that the concentration is below a certain level.
Large increases in stratospheric chlorine and bromine, however, have upset the balance of the Ozone. In effect, they have added a siphon downstream, removing ozone faster than natural ozone creation reactions can keep up. Therefore, ozone levels fall.
Since ozone filters out harmful UVB radiation, less ozone means higher UVB levels at the surface. The more the ozone is depleted, the larger will be the increase in incoming UVB radiation. UVB has been linked to:
- skin cancer;
- cataracts;
- damage to materials like plastics;
- harm to certain crops and marine organisms.
Although some UVB reaches the surface even without ozone depletion, its harmful effects will increase as a result of this problem.
Ozone-Depleting Substance(s) (ODS) are:
- CFCs;
- HCFCs (used in the energy related to refrigeration and air conditioning in homes, commercial buildings, and cars, and manufacture of foam products);
- Halons (used in fire extinguishers);
- Methyl bromide, carbon tetrachloride;
- Methyl chloroform (used as solvents in chemical industries).
The Ozone Hole
Recent studies by NASA and others have indicated that about 40 percent of the ozone in the Antarctica has been destroyed and that about 7 percent of ozone is destroyed from the Arctic Circle. The destruction of ozone is also called “Ozone Hole."
Ozone hole does not mean that there is no ozone in the region. The ozone hole is defined as the area having less than 220 dobson units (DU) of ozone (concentration) in the overhead column (i.e., between the ground and space).
The image below shows the reduction in ozone concentration over Antarctica. This hole in the Antarctica is unfortunately allowing more Australians to be exposed to UV radiation. However, if this kind of ozone destruction ever takes place in the Arctic zone, more humans (in the Northern Hemisphere) would be exposed to higher levels of UVB radiation.
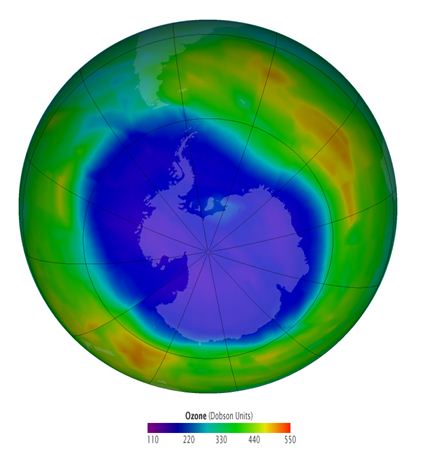

A Dobson Unit is the measure of the amount or thickness of ozone in the atmosphere. It is based on a measurement taken directly above a specific point on the Earth's surface. One Dobson unit refers to a layer of ozone that would be 0.001 cm thick under conditions of standard temperature (0 degree C) and pressure (the average pressure at the surface of the Earth). The Dobson unit was named after G.M.B. Dobson, who was a researcher at Oxford University in the 1920s. He built the first instrument (now called the Dobson meter) to measure total ozone from the ground.
The size of the Southern Hemisphere ozone hole as a function of the year is shown in the figure below. The graph compares the size of the hole over a twenty-year period, from 1980 to 2010. It can be seen that the size increased each year. Each year, in the spring, the ozone hole is at its largest.

Effects of Ozone Depletion on skin
Effects of ozone depletion can result in 1) increased cases of skin cancer, 2) skin damage, 3) cataracts and other eye damage, and 4) immune suppression.
Skin Cancer
The incidence of skin cancer in the United States has reached epidemic proportions. One in five Americans will develop skin cancer in their lifetime, and one American dies every hour from this devastating disease.
Medical research is helping us understand the causes and effects of skin cancer. Many health and education groups are working to reduce the incidence of this disease, of which 1.3 million cases have been predicted for 2000 alone, according to The American Cancer Society. The figure below shows the sources of ozone depleting substances.
Melanoma
Melanoma, the most serious form of skin cancer, is also one of the fastest growing types of cancer in the United States. Many dermatologists believe there may be a link between childhood sunburns and melanoma later in life. Melanoma cases in this country have more than doubled in the past 2 decades, and the rise is expected to continue.
Nonmelanoma Skin Cancers
Nonmelanoma skin cancers are less deadly than melanomas. Nevertheless, left untreated, they can spread, causing disfigurement and more serious health problems. More than 1.2 million Americans will develop nonmelanoma skin cancer in 2000 while more than 1,900 will die from the disease. There are two primary types of nonmelanoma skin cancers.
- Basal Cell Carcinomas are the most common type of skin cancer tumors. They usually appear as small, fleshy bumps or nodules on the head and neck, but can occur on other skin areas. Basal cell carcinoma grows slowly, and rarely spreads to other parts of the body. It can, however, penetrate to the bone and cause considerable damage.
- Squamous Cell Carcinomas are tumors that may appear as nodules or as red, scaly patches. This cancer can develop into large masses, and unlike basal cell carcinoma, it can spread to other parts of the body.
These two cancers have a cure rate as high as 95 percent if detected and treated early. The key is to watch for signs and seek medical treatment.
Other Skin Damage
Other UV-related skin disorders include actinic keratoses and premature aging of the skin.
- Actinic keratoses are skin growths that occur on body areas exposed to the sun. The face, hands, forearms, and the "V" of the neck are especially susceptible to this type of lesion. Although premalignant, actinic keratoses are a risk factor for squamous cell carcinoma. Look for raised, reddish, rough-textured growths and seek prompt medical attention if you discover them.
- Chronic exposure to the sun also causes premature aging, which over time can make the skin become thick, wrinkled, and leathery. Since it occurs gradually, often manifesting itself many years after the majority of a person's sun exposure, premature aging is often regarded as an unavoidable, normal part of growing older. With proper protection from UV radiation, however, most premature aging of the skin can be avoided.
Protect yourself against sunburn. Minimize sun exposure during midday hours (10 am to 4 pm). Wear sunglasses, a hat with a wide brim, and protective clothing with a tight weave. Use a broad spectrum sunscreen with a sun protection factor (SPF) of at least 15. To be safer, 30 is better.
Effects of Ozone Depletion on eyes and immune system
Cataracts and Other Eye Damage
Cataracts are a form of eye damage in which a loss of transparency in the lens of the eye clouds vision. If left untreated, cataracts can lead to blindness. Research has shown that UV radiation increases the likelihood of certain cataracts. Although curable with modern eye surgery, cataracts diminish the eyesight of millions of Americans and cost billions of dollars in medical care each year.
Instructions: Place your mouse over the image below to see the effect cataracts can have on vision. (Note: This video has no audio.)
Other kinds of eye damage include pterygium (i.e., tissue growth that can block vision), skin cancer around the eyes, and degeneration of the macula (i.e., the part of the retina where visual perception is most acute). All of these problems can be lessened with proper eye protection from UV radiation.
Immune Suppression
Scientists have found that overexposure to UV radiation may suppress proper functioning of the body's immune system and the skin's natural defenses. All people, regardless of skin color, might be vulnerable to effects including impaired response to immunizations, increased sensitivity to sunlight, and reactions to certain medications.
Protecting the Environment- Ozone Depletion
Your “Power” in Protecting the Environment from Ozone Depletion
- Make sure that technicians working on your car air conditioner, home air conditioner, or refrigerator are certified by an EPA-approved program to recover the refrigerant (this is required by law).
- Have your car and home air conditioner units and refrigerator checked for leaks. When possible, repair leaky air conditioning units before refilling them.
- Contact local authorities to properly dispose of refrigeration or air conditioning equipment.
International Action in Protecting the Environment from Ozone Depletion
In 1987, the Montreal Protocol, an international environmental agreement, established requirements that began the worldwide phase out of ozone-depleting CFCs (chlorofluorocarbons). These requirements were later modified, leading to the phase out in 1996 of CFC production in all developed nations.
Ground Level Ozone and Photochemical Smog
Ozone is a secondary pollutant that forms from the primary pollutants such as Volatile Organic Compounds (Hydrocarbons) and nitrogen oxides (NOx) in the presence of sunlight. Its formation is mainly from the automobile emissions.

Below is a demonstration on how ozone forms at the ground level (note ground level ozone is also known as “bad” ozone). Please watch the following 5:29 video:
This demonstration is basically looking at how ozone forms or how photochemical smog forms at the ground level because of the pollutants that we emit. Ozone emission or ozone formation depends on two ingredients, nitrogen oxides that are emitted by pollutants that are going out to the tail pipe of a car and in a power plant with a stack. Nitrogen oxides react with volatile organic compounds. Volatile organic compounds are also emitted by the tailpipe of the cars and some of them are coming from petroleum refineries and petroleum industries. VOCs + NOx = Ozone.
These volatile organic compounds react to form ozone only in the presence of sunlight. That is the critical thing, only in presence of sunlight. So, to see this demonstration, we need sunlight. Obviously, we don’t have the sunlight here, but I can create sunlight or the wave lengths that are important to create the same effects. That is the reason I am using a UV lamp. You see this lamp here? This blue light is producing the UV light that is required to create ozone. And this ozone again reacts with volatile organic compounds to produce photochemical smog.
So first of all I am trying to create here ozone. The way I am creating ozone is not with Nitrogen oxides and volatile organic compounds, but turning the oxygen that is there in the beaker into ozone by using this UV light. So let me close this and in about three or four minutes, the oxygen that is there inside will turn into ozone. So we have one ingredient. The second ingredient that is required is Nitrogen oxides or volatile organic compounds to produce smog. Once ozone is formed, I can introduce one of those ingredients, and we can see the smog. Ok, I guess we have probably enough ozone in there. Now we need to add Nitrogen oxides and volatile organic compounds to form the photochemical smog that we are seeing or that we should be seeing. Ozone + VOCs + NOx = Photochemical Smog.
Since I don’t have my car with me or the tail pipe, I need to somehow produce hydro-carbons in this room. So what I am doing is hydro carbons and Nitrogen oxide, cause even is nitrogen oxides are not there, we can form photochemical smog if we have hydro carbons. The composition will be slightly different. So now I am taking my orange, this is the orange, and you know the beautiful smell that you normally smell with an orange is because of linolenic acid. Linolenic acid is the orange smell that you get. And I’m just taking a small peel of this orange, this is the source of hydrocarbons, and I am trying to put it in here - nothing big deal. And this ozone that is there inside will slowly react with this hydrocarbon that are produced, that are emitted from this orange peel and produce the photochemical smog.
Do you see anything going on here? Are you able to still see through the beaker? Is the atmosphere clear in the beaker, or is it becoming hazy? Let me turn this little bit around, and you may be able to see now, I don’t know. Can you see anything coming out of this? That is the photochemical smog, actually. Let me open this and show you. That is the smog that you see and when the smog or when this smoke kind of smog is in the beaker or in the atmosphere, you can not see through and since this has ozone in it, it is not good for our health. When you live in cities filled with this kind of smog, you generally experience breathing problems and other health problems. Your eyes start to water when you drive home from work late in the afternoon, or your nose starts to run because your body tries to get rid of, get rid of these pollutants. So that is photochemical smog and if we keep this orange peel like this we probably can generate enough smog for about 24 hours to 36 hours like this, with this little orange peel. Now you can see what we are doing to the atmosphere by emitting roughly 10, 12, 13 million tons of nitrogen oxides into the atmosphere and several million tons of volatile organic compounds into the atmosphere.
As previously mentioned, the formation of ozone is mainly from automobile emission. A typical profile of pollutants in the air of major cities is well repeatable and is shown in the figure below. Note how the formation changes over the course of a day:
- Early in the morning - During peak traffic hours, NO and Hydrocarbons are emitted along with CO.
- Mid-morning - NO is slowly oxidized to NO2.
- Mid-afternoon - In the presence of sunlight, NOx react with VOCs to form ozone.
Ozone, by itself, is damaging to health and also to the environment. Ozone triggers a variety of health problems even at very low levels and may cause permanent lung damage after long-term exposure. Ozone also leads to the formation of smog or haze, causing additional problems such as a decrease in visibility as well as damage to plants and ecosystems.
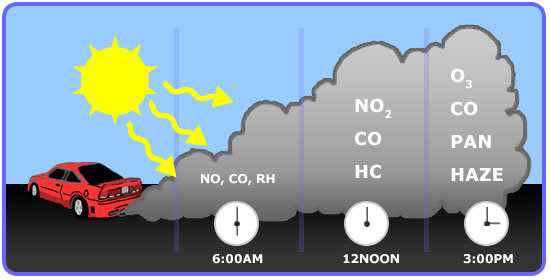
Basic Chemistry and Sources
As we have learned, volatile Organic Compounds (Hydrocarbons) combine with nitrogen oxides (NOx) in the presence of sunlight to form ozone.
In turn, sunlight and hot weather cause ground-level ozone to form in harmful concentrations in the air. As a result, it is known as a summertime air pollutant.
Many urban areas tend to have high levels of "bad" ozone, but even rural areas are also subject to increased ozone levels because wind carries ozone and pollutants that form it hundreds of miles away from their original sources.
View the graph below to compare the major sources of NOx and VOC that help to form ozone.
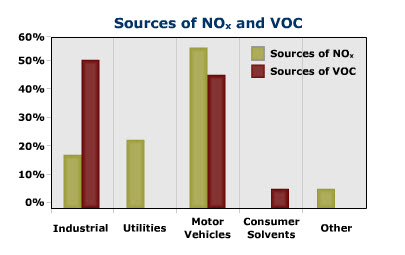
| Source | Amount of NOx | Amount of VOC |
|---|---|---|
| Industrial | 18% | 50% |
| Utilities | 24% | 0% |
| Motor Vehicles | 55% | 45% |
| Consumer Solvents | 0% | 5% |
| Other | 5% | 0% |
Health and Environmental Impact
Several groups of people are particularly sensitive to ozone—especially when they are active outdoors—because physical activity causes people to breathe faster and more deeply. In general, as concentrations of ground-level ozone increase, more and more people experience health effects, the effects become more serious, and more people are admitted to the hospital for respiratory problems. When ozone levels are very high, everyone should be concerned about ozone exposure.

Below is a listing of Health Effects of Ground Level Ozone
- Ozone can irritate your respiratory system, causing you to start coughing, feel an irritation in your throat and/or experience an uncomfortable sensation in your chest.
- Ozone can reduce lung function and make it more difficult for you to breathe as deeply and vigorously as you normally would. When this happens, you may notice that breathing starts to feel uncomfortable. If you are exercising or working outdoors, you may notice that you are taking more rapid and shallow breaths than normal.
- Ozone can aggravate asthma. When ozone levels are high, more people with asthma have attacks that require a doctor's attention or the use of additional medication. One reason this happens is that ozone makes people more sensitive to allergens, which are the most common triggers for asthma attacks. Also, asthmatics are more severely affected by the reduced lung function and irritation that ozone causes in the respiratory system.
- Ozone can inflame and damage cells that line your lungs. Within a few days, the damaged cells are replaced, and the old cells are shed—much in the way your skin peels after a sunburn.
- Ozone may aggravate chronic lung diseases such as emphysema and bronchitis and reduce the immune system's ability to fight off bacterial infections in the respiratory system.
- Ozone may cause permanent lung damage. Repeated short-term ozone damage to children's developing lungs may lead to reduced lung function in adulthood. In adults, ozone exposure may accelerate the natural decline in lung function that occurs as part of the normal aging process.
Protecting the Environment
Click on the hotspots in the image below to find out what you can do to protect the environment.
Review and Extra Resources
Review
Review Sheet Lesson 4 – Energy and the Environment
- Fossil fuels
- Natural gas, Petroleum, Coal
- Fossil fuel composition (Carbon, Hydrogen, Nitrogen, Sulfur, Minerals)
- Products of Combustion
- Primary pollutants
- Carbon Dioxide (majority), Carbon Monoxide, Sulfur Dioxide, Nitrogen Oxides, Lead
- Secondary Pollutants
- Difference between primary and secondary
- Particulate matter
- Primary particles
- Secondary particles
- Primary pollutants
- Health and environmental effects of
- CO2, CO, SO2, NOx, Lead
- PM
- Very Small (smaller than 0.1 μm)
- Intermediate (between 0.1 μm and 2 μm) Most dangerous
- Coarse size (larger than 2 μm)
- Global and Regional effects of Secondary Pollutants
- Greenhouse effect - What is it?
- Greenhouse gases and GWP
- CO2, H2O, CH4, N2O, Other gases [CFC-12, HCFC-22,Perfluoromethane (CF4), Sulfur hexafluoride (SF6)]
- CO2 and temperature fluctuations (pre-industrial and current concentrations and temperature changes)
- Global warming:
- What is it?
- Difference between greenhouse effect and Global warming
- Factors affecting Global climate change
- Potential consequences on global temperature, change in sea levels, polar icecaps, precipitation levels, etc.
- What is known for certain?
- What is likely but uncertain?
- What is uncertain?
- Solutions for global warming
- Acid Rain and Ozone
- Acid Deposition, Basic chemistry of formation, gases responsible for acid deposition
- Wet deposition
- Dry Deposition
- pH scale (ranges from 0 to 14)
- pH of 7 is neutral
- pH less than 7 is acidic
- pH greater than 7 is basic
- Effects of acid rain on human health, vegetation, aquatic life, visibility, and materials
- Ozone
- Good Ozone (stratospheric ozone) vs. Bad Ozone (ground level ozone)
- Ozone Hole (Dobson units)
- Effects of Ozone depletion – basic chemistry
- Ground level Ozone and Photochemical smog formation- Basic chemistry
- Health and Environmental effects
- Your power in protecting the environment
- Acid Deposition, Basic chemistry of formation, gases responsible for acid deposition
Test Yourself
The questions below are your chance to test and practice your understanding of the content covered in this lesson. In other words, you should be able to answer the following questions if you know the material that was just covered! If you have problems with any of the items, feel free to post your question on the unit message board so your classmates, and/or your instructor, can help you out!
- What is the difference between primary and secondary pollutants?
- How can scientists extrapolate historical climate changes by analyzing ice cores?
- What is the greenhouse effect? Explain the difference between greenhouse effect and global warming? Which gases contribute to the greenhouse effect?
- Explain how ozone is formed at the ground level with the help of the basic reactions. Which end users of energy are responsible for the emissions of the compounds involved?
- Explain how the stratospheric ozone layer is being destroyed. Which sector is responsible for the emission of the gases that are responsible for this?
- What is acid rain? How is it formed? What are the effects of acid rain?
- List five steps that you, as an individual, can take to reduce potential global warming, and explain how each of these steps will reduce the emissions.
- List 5 ways in which you, as an individual, can reduce gaseous emissions that contribute to acid rain.
- State the arguments that scientists are making who say that global warming is not due to burning of fossil fuels.
- What are the effects of ground level ozone?
- Briefly describe the methods by which information is gathered and used to show that the planet is warming up.
Lesson 4 Deliverables
Deliverable 1
You must complete a short quiz that covers the reading material in lesson 4. The Lesson 4 Quiz, can be found in the Lesson 4: Energy and the Environment module in Canvas. Please refer to the Calendar in Canvas for specific time frames and due dates.
Lesson 5: Appliances
The links below provide an outline of the material for this lesson. Be sure to carefully read through the entire lesson before returning to Canvas to submit your assignments.
Introduction
Welcome to Lesson 5!
Welcome to the Appliances lesson! This is the most important one for most students--most important in the sense that it can make a difference in both energy consumption and environmental protection because we use a lot of appliances at home. We use a lot of energy for these appliances. In this chapter we are going to learn the basic operating principles of most of the residential big ticket items, for example refrigerators, or water heaters. Water heaters are one of the most energy-consuming appliances. And we will talk about clothes washers and dryers. We are not going to look at how to do the laundry, but we are going to look at the basic operating principles. In other words, how these things really operate. What are all the things that govern energy consumption, and what are all the things we need to look for when we buy some of these appliances?
We'll also learn how to do a cost benefit analysis. To do that, we will learn how to read energy guide labels. Energy guide labels are the yellow, ugly looking labels on appliances that give you the amount of energy that a model consumes. So when you go shopping (I'm sure you are all going to do that with your significant others in a few years) you're going to compare different options. You are going to look at a couple of models -- 3, 4 or 5 models, and say, "Okay, this is better than this; this is worse than this," and so on.
What are the factors that go into comparing several models and picking the right one, both with respect to energy consumption and environment protection? I will show you what kind of information you can get from these energy guides and how these can be used to compare model A vs. model B. For example, model A may cost $1000 and Model B may cost $1500. What you are basically deciding is, is it worth it to pay $500 extra to get the benefits that this model will give? In other words, the more expensive model obviously "should" give you more features that you want, or it should give you energy savings in the long run -- for example, cutting your energy bill by $50 every month. So it's going to really take about 10 months to recover the $500 you are paying up front. This kind of analysis is basically called life cycle analysis--what it would cost to buy a piece of equipment and to operate that over its lifetime. And we do that calculation for two models and see, in the long run, that one model is going to be cheaper and environmentally friendlier than another model. So we are going to learn how to do that. That discussion will be very common for all the appliances, and this calculation of payback period is the key for most of this lesson as well as the lessons to come. We will also look at refrigerators and calculate the efficiency of these refrigerators and how to use the efficiency we need to calculate how much energy these things consume. We will do that with clothes washers and dryers.
From here on you will also encounter some acronyms and energy efficiency terms, so you will need to pay attention to those. And, as I told you, these calculations and the use of the energy guides are the most important concepts in this lesson.
Lesson 5 Objectives
Upon completing this lesson, you should be able to:
- Explain the operating principles of day-to-day residential appliances
- Read and use Energy Guide labels
- Calculate life-cycle analysis of appliances
- Recommend ways to save energy and money based on good operating practices
Questions?
If you have any questions, please post them to the General Course Questions forum in located in the Discussions tab in Canvas. I will check that discussion forum daily to respond. While you are visiting the discussion board, feel free to post your own responses to questions posted by others - this way, you might help a classmate!
Appliance Energy Consumption
Most homes have a variety of appliances with a wide range of operating costs. Typical costs of operation of basic household appliances are shown in the graph below.
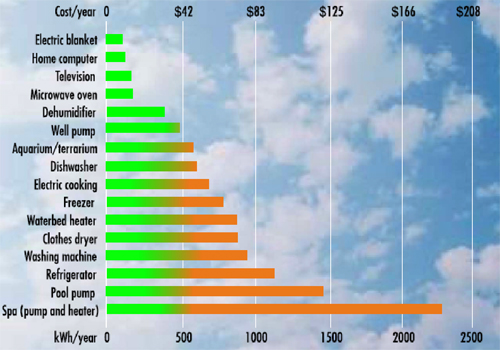
Household appliances, cooking, and lighting consume 33% of the energy at home as shown in the pie chart below. Water heating (not included in the appliances) is the second largest energy expense after home heating and cooling. It typically accounts for about 14% of the utility bill.
Energy Guide Labels
All major home appliances must meet the Appliance Standards Program set by the US Department of Energy (DOE). Manufacturers must use standard test procedures developed by DOE to prove the energy use and efficiency of their products. Test results are printed on yellow Energy Guide labels (pictured below) which manufacturers are required to display on many appliances. This label provides the necessary information to perform a Life Cycle Analysis when comparing different models.
Instructions: View detailed descriptions about the information found on Energy Guide labels.
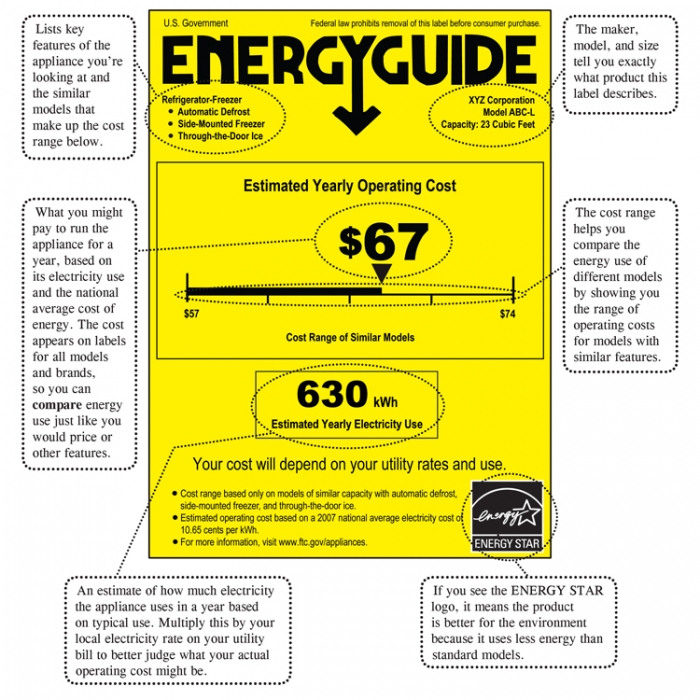
The Federal Trade Commission's Appliance Labeling Rule requires appliance manufacturers to put these labels on refrigerators, freezers, dishwashers, clothes washers, water heaters, furnaces, boilers, central air conditioners, room air conditioners, heat pumps, and pool heaters. The law requires that the labels specify:
- the capacity of the particular model—for refrigerators, freezers, dishwashers, clothes washers, and water heaters;
- the energy efficiency rating and the estimated annual energy consumption of the model—for air conditioners, heat pumps, furnaces, boilers, and pool heaters;
- the range of estimated annual energy consumption, or energy efficiency ratings, of comparable appliances.
How to Use the Labels
A worksheet on how to use the labels in choosing a cost-effective and environmentally friendly appliance is given below.
| Part A - General Information | |
|---|---|
| 1. Are the appliances comparable in size and features? | Answer has to be yes |
| 2. What is the price of the more energy- efficient model? | $ ________ |
| 3. What is the price of the less energy-efficient model? | $ ________ |
| 4. What is the price of electricity in your region? | $ ________ / kWh |
| 5. How long do you expect to keep the appliance? What is the life of the Appliance? | ________ |
| PART B - Determining why you should buy an energy efficient model | |
| 1. Calculating the price difference: | |
| 2. Price of the more energy-efficient model | $ ________ |
| 3. Price of the less energy-efficient model | $ ________ |
| 4. Price Difference | $ ________ |
| Determining the annual energy savings | |
| 1. Annual energy consumption of the less energy-efficient model | ________ kWh |
| 2. Annual energy consumption of the more energy-efficient model | ________ kWh |
| 3. Annual energy savings | ________ kWh |
| Determining the savings | |
| 1. Annual energy savings | ________ kWh |
| 2. Annual monetary savings on energy (energy savings x price) | $ ________ |
| 3. Energy savings over the life time of the appliance | ________ kWh |
| (Life in years x annual energy savings) | |
| 1. Cost of energy savings over life time of the appliance | $ ________ |
| Determining the Pay Back Period | |
| 1. Price difference between the models | $ ________ |
| 2. Annual monetary savings on energy (energy savings x price) | $ ________ |
| 3. Pay Back Period (years to recover the additional investment ) | $ ________ |
| 4. Monetary savings on energy over the lifetime | $ ________ |
| 5. Price Difference | $ ________ |
| 6. Total monetary benefit for choosing environmentally friendly appliance (4 – 5) | $ ________ |
Water Heaters
Heat is continuously flowing from the tank of the water heater and the pipes to the room because the water heater is always at a higher temperature than the surroundings (basement or garage). Thermal energy flows from high temperature to low temperature. Heat is lost whether you use water or not.
Like most appliances, water heaters have improved greatly in recent years. Today's models are much more energy efficient, and you will be able to purchase a more efficient water heater that will save you money on energy each month. The average life expectancy of a water heater is 13 years. Therefore, the initial purchase price should not be an important factor in selecting a water heater.
Costs of Water Heaters
Just like other appliances, there are two costs associated with water heaters - initial purchase price and operating costs. Water heaters typically last for about 13 years, after which they need to be replaced. Also, each month, you pay for the fuel you use. An energy-efficient model could save hundreds of dollars in the long run in the energy costs and may offset the higher initial purchase price.
It can be compared to automobile mileage—some cars get 15 miles to a gallon, while other, more efficient, vehicles can go 30 miles or more on a gallon of gas. In the same way, some water heaters use energy more efficiently.
One should buy an energy-efficient water heater and spend less money each month to get the same amount of hot water.
Typical Water Use at Home
The table below shows typical water use for various purposes at home.
| Use | Gallons per use |
|---|---|
| Shower | 7-10 |
| Bath (standard tub) | 20 |
| Bath (whirlpool tub) | 35-50 |
| Clothes washer (hot water wash, warm rinse) | 32 |
| Clothes washer (warm wash, cold rinse) | 7 |
| Automatic dishwasher | 8-10 |
| Food preparation and cleanup | 5 |
| Personal (hand-washing, etc.) | 2 |
Energy costs increase with water temperature. Dishwashers require the hottest water of all household uses, typically 135ºF to 140ºF. However, these devices are usually equipped with booster heaters to increase the incoming water temperature by 15ºF to 20ºF. Setting the water heater between 120ºF and 125ºF and turning the dishwasher’s booster on should provide sufficiently hot water while reducing the chances for scalding.
Energy Required for Water Heating
The amount of energy required to heat water is proportional to the temperature difference of what?
To calculate the Heat Required, use this equation:
Where …
= mass of water heated
= the heat capacity of water (1 BTU / lb ºF)
= temperature difference.
Remember to make your units of measurements consistent. Since Cp is measured in pounds, your mass of water heated should be measured in pounds as well. Thus, if you only know the number of gallons, you must convert it into pounds. One gallon of water = about 8.3 pounds, so multiply number of gallons by 8.3 to determine the weight in pounds.
Example 1
It is estimated by the United States Department of Energy that a family of four, each showering for 10 minutes a day, consumes about 700 gal of hot water a week. Water for the showers comes into the home at 55ºF and needs to be heated to 120ºF.
To calculate the heat required, determine the variables:
m = mass of water heated = 700 gallons = 5810 lbs
Cp is the heat capacity of water = 1 BTU/lb ºF (given)
ΔT = temperature difference = 120 ºF – 55 ºF
Heat energy required to heat 700 gal can be calculated as follows:
Heat Required = 5810 lbs x 1 BTU/lb ºF x (120 ºF – 55 ºF)
Heat Required = 5810 lbs x 65 ºF
Heat Required = 377,650 BTU/week
The heat requirement for one year is :
377,650 BTU/Week x 52 Weeks/Year = 19,637,800 BTU/year or 5,755 kWh
Assuming that the natural gas costs $ 10/MMBTU (1 MMBTU = 1000000 BTU) and electricity costs 0.092 per kWh, the gas costs would be $196.37 while electric costs would be $529.46. Clearly, electric heat is more expensive than natural gas.
Example 2
Estimate the % energy savings of an electric water heater that heats 100 gallons of per day when the temperature is set back at 110° instead of 120°F. The basement is heated and is at 65°F. The life of the water heater is expected to be about 10 years. Use an appropriate cost for electricity and compare the operating expenses.
Heat required (BTU) = m x Cp x (Temperature Difference)
Where Cp is the heat capacity of water (1 BTU/lb/F) and m is the mass of the water (Assume 1 gal has 8.3 lb of water and the 3,412 BTU = 1 kWh)
Solution:
Energy required for heating the water to 120°F:
In a year the energy required is:
In a 10-year period, the energy required is 166,622,500 BTU which is equal to 48,834 kWh.
Operating cost over its lifetime is:
Energy required for heating the water to 110°F:
In a year, the energy required is:
In a 10-year period, the energy required is 136,327,500 BTU which is equal to 39,995 kWh .
Operating cost over its lifetime is:
Estimated % Energy Savings:
Types of Water Heaters: Storage or Tank
There are several types of water heaters that are available on the market:
- Storage or tank
- On demand
- Heat pump
- Tankless coil
- Indirect
- Solar
However, most water heaters use a storage tank type.
Storage or tank-type water heaters are relatively simple devices and by far the most common type of residential water heater used in the United States. They range in size from 20 to 80 gallons, and can be fueled by electricity, natural gas, propane, or oil.
Parts of an Electric Hot Water Heater
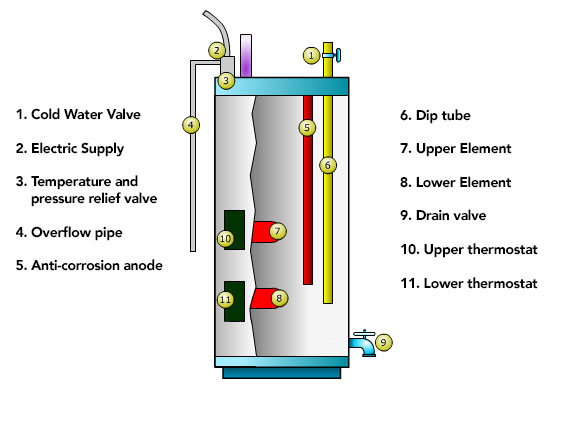
Parts of a Gas Hot Water Heater
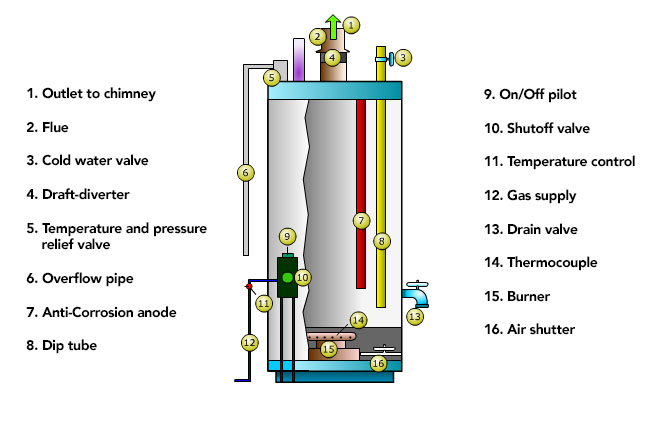
How a Gas Hot Water Heater Works
When you turn on a hot water faucet or use hot water in a dishwasher or clothes washer, water pipes draw hot water from the tank. To replace that hot water, cold water enters the bottom of the tank, ensuring that the tank is always full. Depending on the type of fuel that is used, either electrical heating elements or a natural gas burner is used to heat the water.
Click the “play” button on the animation below to see how a gas hot water heater works. (41 seconds)
First, cold water flows in from the cold inlet tube into the bottom of the tank. A gas burner underneath the tank then heats the water to the desired temperature. The hot water exits through the warm outlet tube at the top to be distributed through the house, while the exhaust from the gas burner escapes through the chimney in the center of the tank.
Electric water heaters are generally less expensive to install (purchase price) than gas-fired types because they don't require gas lines and vents to let the combustion products out of the house. In previous lessons, and in Home Activity 2, we have seen that natural gas costs about 7–12 dollars per million BTUs, whereas electrical energy is 20–25 dollars per million BTUs, making electric water heaters more expensive to operate.
Storage tank-type water heaters raise and maintain the water temperature to the temperature setting on the tank (usually between 120°–140°F). Because the water is constantly heated and kept ready for use in the tank, heat energy can be lost even when no faucet is on. This is called standby heat loss. These standby losses represent 10 to 20 percent of a household's annual water heating costs. Newer, more energy-efficient storage models can significantly reduce the amount of standby heat loss, making them much less expensive to operate.
Types of Water Heaters: Demand Water Heaters
Demand Water Heaters do not have storage tanks, so there is no standby heat loss from the tank, and energy consumption is reduced by 20 to 30 percent. Demand water heaters are available in propane (LP), natural gas, or electric models.
In these types of water heaters, cold water travels through a pipe into the unit, and either a gas burner or an electric element heats the water only when needed. With these systems, you never run out of hot water. However, the flow rate is limited by the outlet temperature.
The appeal of demand water heaters is the elimination of the tank standby losses, the resulting lower operating costs, and the fact that the heater delivers hot water continuously.
How a Demand Water Heater works
Click the “play” button to see how a Demand Water Heater works.
Cold water flowing into the building is split off to a cold water line and a hot water line. When a faucet is turned on, water flows through the hot water line past has a heating unit where several heating elements quickly raise the water's temperature. The now hot water flows back into the hot water line and travels to where it is needed.
Typically, demand heaters provide hot water at a rate of 2 to 4 gallons per minute. This flow rate might meet the requirements of a household's hot water needs as long as the hot water is not needed in more than one location at a time (e.g., one cannot shower and do the laundry simultaneously). To meet hot water demand when multiple faucets are being used, demand heaters can be installed in parallel sequence.
Although gas-fired demand heaters tend to have higher flow rates than electric ones, they can waste energy even when no water is being heated if their pilot lights stay on. However, the amount of energy consumed by a pilot light is quite small. Thus, in most cases, gas demand water heaters will cost less to operate than electric water heaters.
Demand water heaters cost more than conventional storage tank-type units. Small point-of-use heaters that deliver 1 to 2 gallons per minute (gpm) sell for about $200. Larger gas−fired demand units that deliver 3 to 5gpm cost $550 - $1,000. The more hot water the unit produces, the higher the cost.
Advantages and Disadvantages of Demand Water Heaters
| Advantages | Disadvantages |
|---|---|
|
|
Types of Water Heaters: Solar Water Heaters
An estimated one million residential and 200,000 commercial solar water-heating systems have been installed in the United States. Although there are a large number of different types of solar water-heating systems, the basic technology is very simple.
Sunlight strikes and heats an "absorber" surface within a "solar collector" or an actual storage tank. These roof-mounted solar heaters supply about 80% of the hot water for the home. Either a heat-transfer fluid or the actual potable water to be used flows through tubes attached to the absorber and picks up the heat from it. (Systems with a separate heat-transfer-fluid loop include a heat exchanger that then heats the potable water.) The heated water is stored in a separate preheat tank or a conventional water heater tank until needed.
If additional heat is needed, it is provided by electricity or fossil-fuel energy by the conventional water-heating system.
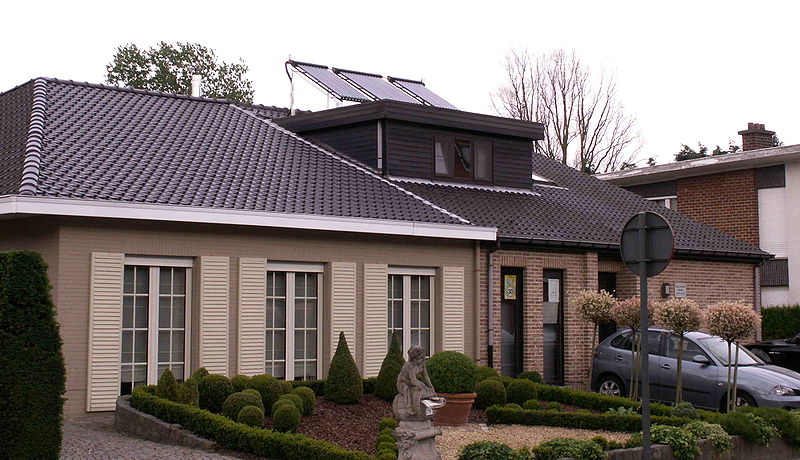
How a Solar Water Heater Works
Click the “play” button to see how a solar water heater operates.
Cold water is pumped to the solar collector on the roof of the house, where it is warmed by sunlight. The warm water then travels down into a storage tank and then to a conventional water heater. The water is heated further and becomes hot and available for use.
By reducing the amount of heat that must be provided by conventional water heating, solar water-heating systems directly substitute renewable energy for conventional energy, reducing the use of electricity or fossil fuels by as much as 80%.
Today's solar water-heating systems are proven reliable when correctly matched to climate and load. The current market consists of a relatively small number of manufacturers and installers that provide reliable equipment and quality system design.
A quality assurance and performance-rating program for solar water-heating systems, instituted by a voluntary association of the solar industry and various consumer groups, makes it easier to select reliable equipment with confidence.
Building owners should investigate installing solar hot water-heating systems to reduce energy use. However, before sizing a solar system, water-use reduction strategies should be put into practice.
Types of Solar Hot Water Heaters
There are five types of solar hot water systems:
- Thermosiphon Systems. These systems heat water or an antifreeze fluid, such as glycol. The fluid rises by natural convection from collectors to the storage tank, which is placed at a higher level. No pumps are required. In thermosiphon systems, fluid movement, and therefore heat transfer, increases with temperature, so these systems are most efficient in areas with high levels of solar radiation.
- Direct-Circulation Systems. These systems pump water from storage to collectors during sunny hours. Freeze protection is obtained by recirculating hot water from the storage tank, or by flushing the collectors (drain-down). Since the recirculation system increases energy use, while flushing reduces the hours of operation, direct-circulation systems are used only in areas where freezing temperatures are infrequent.
- Drain-Down Systems. These systems are generally indirect water-heating systems. Treated or untreated water is circulated through a closed loop, and heat is transferred to potable water through a heat exchanger. When no solar heat is available, the collector fluid is drained by gravity to avoid freezing and convection loops, in which cool collector water reduces the temperature of the stored water.
- Indirect Water-Heating Systems. In these systems, freeze-protected fluid is circulated through a closed loop and its heat is transferred to potable water through a heat exchanger with 80 to 90 percent efficiency. The most commonly used fluids for freeze protection are water-ethylene glycol solutions and water-propylene glycol solutions.
- Air Systems. In this indirect system, the collectors heat the air, which is moved by a fan through an air-to-water heat exchanger. The water is then used for domestic or service needs. The efficiency of the heat exchanger is in the 50% range.
Direct-circulation, thermosiphon, or pump-activated systems require higher maintenance in freezing climates. For most of the United States, indirect air and water systems are the most appropriate. Air solar systems, while not as efficient as water systems, should be considered if maintenance is a primary concern since they do not leak or burst.
Types of Water Heaters: Heat Pump Water Heaters
Heat pumps are a well-established technology for space heating. The same principle of transferring heat is at work in heat pump water heaters (HPWHs) except that they extract heat from air (indoor, exhaust, or outdoor air) and deliver it to water. Some models come as a complete package, including tank and back-up resistance heating elements, while others work as an adjunct to a conventional water heater.
The simplest HPWH is the ambient air-source unit, which removes heat from surrounding air, providing the additional benefit of space cooling. Exhaust air units extract heat from a continuously exhausted air stream and work better in heating-dominated climates because they do not cool ambient air. Some units can even be converted between the two modes of operation for optimum operation in either summer or winter.
In mild climates, you can place ambient air-source units in unheated but protected spaces such as garages, essentially using outdoor air as a heat source.
Because it extracts heat from air, the HPWH delivers about twice the heat for the same electricity cost as a conventional electric resistance water heater.
Parts of a Heat Pump Water Heater (HPWH)
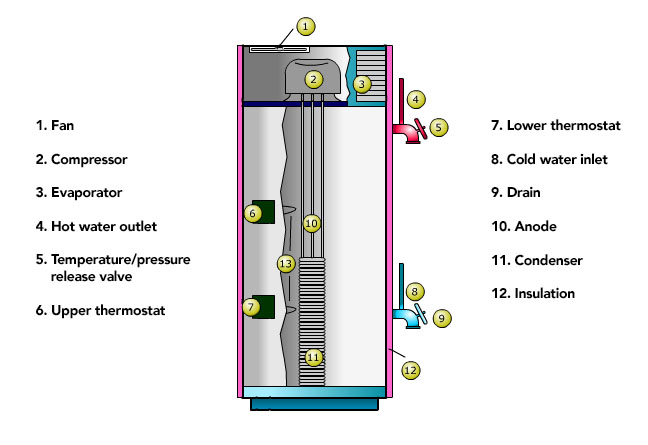
Desuperheaters
The Desuperheater feature is available on some central air conditioners and is a variation of the stand-alone HPWH. It provides economical supplemental water heating as a byproduct of air conditioning.
Desuperheater water heating can be part of an integrated package with a heat pump or air conditioner system. In most such systems, the heat pump water heating only occurs during normal demand for space conditioning, with resistance electric coils providing water heating the rest of the time.
During the cooling season, the Desuperheater actually improves the efficiency of the air conditioning system while heating water at no direct cost. In an average climate, a desuperheater might meet 20 to 40 percent of annual water heating demand.
Heat pump water heaters can provide up to 60 percent energy savings over conventional water heaters.
How a Heat Pump Water Heater Works
The Heat Pump Water Heater (HPWH) consists of three circuits. The HPWH consists of three circuits. Watch the video below to learn more about how a HPWH works. (30 seconds)
How a Heat Pump Water Heater Works
The heat pump water heater (HPWH) consists of three circuits; a Heat Pump circuit, a Geothermal Heat circuit, and a Desuperheater circuit.
The Heat Pump circuit consists of an indoor coil, a compressor, and a Desuperheater. Cool water flows from the indoor coil to the compressor. The water becomes heated as it travels through the compressor to the Desuperheater. The heat from the water is transferred to the water in the Desuperheater circuit through the adjacent coils.
The cool water then flows to the coils adjacent to the Geothermal Heat circuit and becomes heated as it flows back to the indoor coil.
The Geothermal heat circuit consists of a geothermal unit in the ground, a "from earth connection," and a "to earth connection." Water warmed by the earth flows from the "from earth connection" through the coils adjacent to the Heat Pump circuit, transferring the heat energy. The cool water flows back into the geothermal unit in the ground.
The Desuperheater circuit consists of the hot water tank that supplies water to the house and a set of coils adjacent to the Desuperheater coils in the Heat Pump circuit. The water from the tank cycles through the coils and is heated by the Heat Pump circuit.
Note: The concept shown in the animation is applicable to all HPWH: heat is picked up and delivered into some source – which could either be the ground, air, or water.
Most of the heat delivered to the water comes from the evaporator of the unit, not through the electrical input to the machine. Consequently, the efficiency of the HPWH is much higher than for direct-fired gas or electric storage water heaters.
The installed cost of commercial HPWH systems is typically several times that of gas or electric water heaters; yet the low operating costs can often offset the higher total installed cost, making the HPWH the economic choice for water heating.
The HPWH becomes increasingly attractive in building applications where energy costs are high, and where there is a steady demand for hot water. This attractiveness is less a function of building type than it is of water demand and utility cost.
Energy Efficiency of Water Heaters
The federal efficiency standards for water heaters took effect in 1990, assuring consumers that all new water heaters meet certain minimum-efficiency levels. New standards, which took effect in January 2004, will increase the minimum efficiency levels of these products.
Water heater efficiency is reported in terms of the energy factor (EF). EF is an efficiency ratio of the energy supplied in heated water divided by the energy input to the water heater, and it is based on recovery efficiency, standby losses, and cycling losses. The higher the EF, the more efficient the water heater.
- Electric resistance water heaters have EFs ranging from 0.7 and 0.95.
- Gas water heaters from 0.5 and 0.6, with some high-efficiency models ranging around 0.8.
- Oil water heaters from 0.7 and 0.85.
- Heat-pump water heaters from 1.5 to 2.0.
There is little difference between the most efficient electric resistance storage water heaters and the minimum-efficiency standard that will take effect in January 2004. If you need to rely on electricity to heat your water, keep your eye out for the further development of heat-pump water heaters. This technology uses one-third to one-half as much electricity as a conventional electric resistance water heater.
Energy Efficiency Recommendations
Everything else being equal, select a water heater with the highest energy factor (EF). Below is a table with energy efficiency recommendations.
| Storage Type | Recommended | Best Available | ||
|---|---|---|---|---|
| Size | Energy Factor | Annual Energy Use (kWh) | Energy Factor | Annual Energy Use (kWh) |
| Less than 60 gallons | 0.93 | 4,721 | 0.95 | 4,622 |
| 60 gallons or more | 0.91 | 4,825 | 0.92 | 4,773 |
The higher the EF, the more efficient the water heater.
Other Considerations
In addition to EF, also look for a water heater with at least one-and-a-half inches of tank insulation and a heat trap.
In addition, capacity of a water heater is an important consideration. The water heater should provide enough hot water at the busiest time of the day. For example, a household of two adults may never use more than 30 gallons of hot water in an hour, but a family of six may use as much as 70 gallons in an hour.
The ability of a water heater to meet peak demands for hot water is indicated by its "first hour rating." This rating accounts for the effects of tank size and the speed by which cold water is heated. Water heaters must be sized properly. Over-sized water heaters not only cost more but increase energy use due to excessive cycling and higher standby losses.
Life Cycle Analysis
Let’s use the Energy Guide to perform a life-cycle analysis to help choose a water heater. Different models of water heaters with the same capacity can vary dramatically in the amount of electricity they use.
Instructions: Use the two EnergyGuide Labels for the different water heaters, to answer questions 1-8.

Click here to open a text description comparing the two Energy Guide Labels.
Compare the Two EnergyGuide Labels
Water Heater #1:
- Water heater: Electric
- Capacity (first hour rating): 58 gallons
- This model uses 4622 kwh/year
- Energy use range of all similar models (kwh/year): 4624 (uses least energy) - 5109 (uses most energy)
- This model's estimated yearly operating cost is $388
- Based on a 1994 U.S. Government national average cost of $0.0841 per kWh for electricity. Your actual operating cost will vary depending on your local utility rates and your use of the product.
- Sold for $380
Water Heater #2:
- Water heater: Electric
- Capacity (first hour rating): 58 gallons
- This model uses 4989kwh/year
- Energy use range of all similar models (kwh/year): 4624 (uses least energy) - 5109 (uses most energy)
- This model's estimated yearly operating cost is $419
- Based on a 1994 U.S. Government national average cost of $0.0841 per kWh for electricity. Your actual operating cost will vary depending on your local utility rates and your use of the product.
- Sold for $335
Compare the Two Models
Determine Savings
Determine the Pay Back Period
Still trying to figure out the payback period? The price difference between the two models was $45, and your annual monetary savings was $33.76. So after one year, you got back $33.76 out of the $45 extra you spent on the superior model. How much longer would it take you to get back the remaining $11.24? Since $11.24 is about a third of $33.76, it would take you about a third of a year. Thus, your payback period is 1.33 years.
Obviously, it pays to buy an energy-efficient water heater by saving $393.96. It also helps the environment by not using 4,771 kWh of electrical energy and thereby not emitting 9,652 lb of CO2, 21 lb of NOx, 75 lb of SO2 and 1 lb of CO and particulate matter each and into the environment. See the individual’s power!
Water Heaters: Your “Power” in the Environmental Protection
- Do as much cleaning as possible with cold water to save the energy used to heat water.
- Check your faucets for leaks. They waste both water and energy!
- Conserve hot water by installing water-saving showerheads. A new showerhead can save as much as $10 a year in water and energy.
- Once your water is hot, insulate to help keep it that way. Wrapping exposed hot water pipes with insulation will minimize heat loss. So will installing an R-12 insulation blanket around your water heater, unless the manufacturer does not recommend it.
- Reduce your water heater's temperature to 120 degrees Fahrenheit. That will produce plenty of hot water and still save energy. For homes with a dishwasher, a setting of 140 degrees is required to clean properly, but most of the new dishwashers have a built-in water temperature booster.
- Many new water heaters have a "vacation" setting you can use to save energy if you're away for more than a few days. Turn the thermostat "down" or "off" when you're gone for more than three days.
Refrigerators
Refrigerators are heat movers, which move heat from a low temperature (inside the refrigerator) to a high temperature (outside the refrigerator into the kitchen). Heat movers do not produce any heat, but just move from one location to another. (Note: The animation has no audio.)
How Does a Refrigerator Work?
The principle of operation of a refrigerator is similar to an air conditioner. It moves the heat energy from inside to outside. There are four basic components in a refrigerator and their functions are as follows:
- Expansion valve - A liquid refrigerant at high pressure flows through an expansion valve. As the refrigerant moves through the expansion valve, it moves from a high-pressure zone to a low-pressure zone. The decrease in pressure corresponds with a decrease in temperature.
- Evaporator or heat exchanging pipes - A set of coiled tubes carrying the low pressure, expanded refrigerant. In the evaporator, the liquid refrigerant also expands and evaporates. The evaporation of liquid takes away heat, creating cold gas in the coils. The cold refrigerant flowing through the coils absorbs heat from the refrigerator. The food gets cold. However, the refrigerant warms up because of the absorption of heat.
- Compressor - A device that pressurizes the warm refrigerant and makes it hot (hotter than the kitchen temperature). This hot refrigerant goes into the condenser.
- Condenser or second heat exchanger coil - Located at the back of the refrigerator where it gives off the heat to the air in the kitchen.
Click the “play” button to learn how a refrigerator works.
Click here to open a text description of how a refrigerator works.
How a Refrigerator Works
Compressed liquid refrigerant passes through an expansion valve that reduces the pressure and, in turn, the temperature. The now cold liquid travels through a series of evaporator coils. As it travels through the coils, the liquid evaporates, drawing the heat energy needed for evaporation from the food in the fridge. This process leaves the food cold as the heat has been moved to the refrigerant.
The evaporated refrigerant passes through a compressor that raises the pressure and temperature of the refrigerant and turns it back into a liquid. The liquid dispenses the heat collected from inside the fridge through the condenser coils and then passes through the expansion valve again to repeat the process.
Types and Features
There are four types of refrigerators: top-freezer (or top-mount), bottom-freezer (or bottom-mount), side-by-side, and built-in (as shown below).
Refrigerators also come in four size categories: small (7 to 9.9 cubic feet), medium (10 to 13.9 cubic feet), large (14 to 19.9 cubic feet), and extra large (20 to 29 cubic feet).
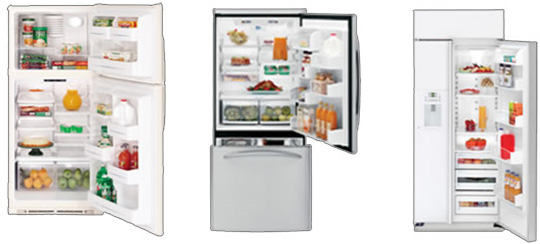
Energy Efficiency of a Refrigerator
Most of the energy used by a refrigerator is used to pump heat out of the cabinet. A small amount is used to keep the cabinet from sweating, to defrost the refrigerator, and to illuminate the interior.
The efficiency of a refrigerator is based on the energy consumed per year for a given size. The efficiency of a refrigerator is expressed in volume cooled per unit electric energy per day. Volume is measured in cubic feet and electrical energy is measured in kilowatt-hours.
Refrigerator Efficiency = Volume Cooled (ft3) / Unit Electrical Energy per day (KWh)
The energy efficiency of refrigerators and freezers has improved dramatically over the past three decades. For example, the energy bill for a typical new refrigerator with automatic defrost and top-mounted freezer will be about 55 dollars / year, whereas a typical model sold in 1973 will cost nearly 160 dollars / year (almost three times the energy consumption).
The Department of Energy (DOE) standards set maximum allowable annual energy consumption for different sizes and classes of refrigerators. These Federal efficiency standards first took effect in 1993, requiring new refrigerators and freezers to be more efficient than ever before. A new set of stricter standards took effect July 1, 2001.
Energy Guide Labels
Refrigerators now come with an EnergyGuide label that tells you in kilowatt-hours (kWh) how much electricity a particular model uses in a year. The smaller the number, the less energy the refrigerator uses and the less it will cost you to operate.
- Full-sized refrigerators that exceed the federal standard by 15% or more (and full-sized freezers that exceed it by 10%) qualify for the ENERGY STAR label.
- Compact refrigerators and freezers must exceed the standard by 20% to qualify for ENERGY STAR.
ENERGY STAR qualified refrigerators provide energy savings without sacrificing the features you want. ENERGY STAR–qualified models have
- High-efficiency compressors
- Improved insulation
- More precise temperature
- More precise defrost mechanisms
These models also use at least 15% less energy than required by current federal standards, and 40% less energy than the conventional models sold in 2001.
Many ENERGY STAR qualified models include automatic ice-maker and through-the-door ice dispensers. Qualified models are also available with top, bottom, and side-by-side freezers.
What to look for in a Refrigerator
When selecting a refrigerator, remember the following:
- Refrigerators with the freezer on either the bottom or top are the most efficient. Bottom freezer models use approximately 16 percent less energy than side-by-side models, and top freezer models use about 13 percent less than side-by-side.
- Through-the-door ice makers and water dispensers are convenient and reduce the need to open the door, which helps maintain a more constant temperature; however, these convenient items will increase your refrigerator's energy use by 14 to 20 percent.
- Mini-doors give you easy access to items most often used. The main door is opened less often, which saves energy.
- Too large a refrigerator may waste space and energy. One that's too small can mean extra trips to the grocery store. Your best bet is to decide which size fits your needs, and then compare the EnergyGuide label on each, so you can purchase the most energy efficient make and model. (filling your refrigerator helps with efficiency, so long as it's not overfilled!)
- A manual defrost refrigerator uses half the energy of an automatic defrost model, but must be defrosted regularly to stay energy efficient.
- Refrigerators with anti-sweat heaters consume 5 percent to 10 percent more energy. Look for models with an "energy saver" switch that lets you turn down—or off—the heating coils (which prevent condensation).
Technology Improvements
The improvement in the energy efficiency over the past three decades is due to the:
- addition of vacuum insulation panels around the freezer section to reduce heat transfer;
- addition of polyurethane foam to the doors to double insulation thickness;
- replacement of AC motors with more efficient DC motors;
- replacement of automatic defrost control with an adaptive defrost that operates only when needed.
Refrigerators & Environmental Protection
Refrigerators: Your “Power” in the Environmental Protection
- Keep your refrigerator or freezer at the following temperatures: 37–40°F for the fresh food compartment of the refrigerator, 0–5°F for the freezer section. Use a thermometer to check inside temperatures.
- Regularly defrost manual-defrost refrigerators and freezers; don't allow frost to build up more than 1/4 inch.
- Make sure your refrigerator and freezer door seals are airtight. Check the seal on door gaskets periodically by closing the door on a dollar bill. If it pulls out easily, you may need a new gasket.
- Keep the doors closed as much as possible and make sure they are closed tightly.
- To ensure proper cooling of its contents, don't crowd food items. Too many dishes obstruct air circulation.
- Cover liquids and wrap foods stored in the refrigerator. Uncovered foods release moisture and make the compressor work harder.
- Replace paper wrappings on food items with aluminum foil or plastic wrap. Paper is an insulator.
- Consider turning off the butter conditioner, since it is a little heater inside your refrigerator.
- Experiment with the "energy saver" switch in your refrigerator—it allows you to adjust the heating coil under the "skin" of the refrigerator (the purpose of the heating coils is to prevent condensation on your refrigerator).
- Placement of the refrigerator is very important. Direct sunlight and close contact with hot appliances will make the compressor work harder. More importantly, heat from the compressor and condensing coil must be able to escape freely, or it will cause the same problem. Don't suffocate the refrigerator by enclosing it tightly in cabinets or against the wall. The proper breathing space will vary depending on the location of the coils and compressor on each model—something important to know before the cabinets are redesigned.
- Regularly brush off or vacuum the refrigerator coils on the back or bottom of the unit.
- Because most refrigerators reject heat from the bottom and/or back, they need adequate clearance to allow sufficient airflow. While no specific studies have been done to calculate the optimum clearance space, one general rule-of-thumb is to double the space recommended by manufacturers for refrigerator installation. Another rule-of-thumb is to allow 2 inches of air flow around the refrigerator.
- Don't keep that old, inefficient fridge running day and night in the garage for those few occasions when you need extra refreshments. A 15-year-old refrigerator could cost \$100–\$150 per year.
Clothes Washers
Clothes washers and dryers account for 10 percent of the residential energy consumption, with most of the energy consumed for hot water used for washing.
- An estimated 85 percent to 90 percent of the energy is used for heating the water.
- Relatively, 10 percent to 15 percent of the energy is used by the clothes washer itself to operate the motor and controls.
A typical household does nearly 400 loads of laundry a year, and each load in a conventional washer uses 40 gallons of water. Therefore, any reduction in energy consumption for clothes washing application would involve reduction in hot water use.
Types of Clothes Washers
The basic principle for cleaning clothes has remained unchanged—wet the garment, agitate it to loosen the dirt from the cloth fibers, and then use more water to rinse the dirt off. What has changed over the millennia is the method of agitation? Pounding garments with stones was common for several thousand years, and along the way someone also figured out that using heated water got out a lot more dirt.
Clothes washers come in two types: Horizontal axis (h-axis) or front loading and Vertical axis (v-axis) or top loading (shown below).
Most clothes washers produced for the U.S. consumer are vertical axis (v-axis) washers with a central agitator. While there are variations, most v-axis washers suspend the clothes in a tub of water for washing and rinsing.
As an alternative, the horizontal axis (h-axis) washer tumbles the wash load repeatedly through a small pool of water at the bottom of the tub to produce the needed agitation. This tends to reduce the need for both hot and cold water.
The h-axis washer, popular in Europe, has a very limited market share in the United States at present. Yet, estimates have shown that a large quantity of energy and water could be saved through the replacement of conventional v-axis washers with the h-axis design.
H-axis washer
H-axis or tumble-action machines repeatedly lift and drop clothes, instead of moving clothes around a central axis. H-axis washers also use sensor technology to closely control the incoming water temperature. To reduce water consumption, they spray clothes with repeated high-pressure rinses to remove soap residues rather than soaking them in a full tub of rinse water.
Click the "play" button to see how an H-axis washing machine works. (Note: The animation has no audio.)
In a study conducted by Oak Ridge national Laboratory (ORNL) in 1998 for U.S. Department of Energy, it was found that, on average, the h-axis washer used 62.2 percent of the water used by the v-axis washer, and this yielded total water savings of 37.8 percent. Moreover, the average h-axis washer consumed 42.4 percent of the energy used by a typical v-axis washer in the study, resulting in energy savings of 57.6 percent.
Features of the h-axis washer include:
- Auto temperature. The machine will mix hot and cold water to a preset "warm" and "cold" so that the water is warm enough for the detergent to dissolve and optimally perform. During the winter in many parts of the country, cold tap water can be too cold to wash your clothes well.
- Water level settings. Some of the very high-end machines sense the amount of clothing and automatically adjust the water level, but all except the most basic machines offer at least four settings.
- Capacity. If you have a large household or athletes who produce an astounding amount of laundry each week, a larger capacity machine is a must. The front loaders generally hold more because they don't have the agitator. A definite minus for the front loaders, however, is the actual loading because you have to bend over to put in the clothes. To minimize this fact, the machines and their matching dryers are often displayed in stores on a raised platform.
Energy Efficiency and Water Usage
Stricter new federal standards for clothes washers took effect in two stages. The first stage was in force as of January 2004. Then in 2007, the second stage further strengthened the standard. Three factors are used in determining the federal standards:
- Energy Factor is a metric that was previously used to compare relative efficiencies of clothes washers. The higher the Energy Factor is, the more efficient the clothes washer is. For clothes washers, Energy Factor is calculated using the following formula:
- Water Factor is the number of gallons per cycle per cubic foot that the clothes washer uses. The lower the water factor, the more efficient the washer is. So, if a clothes washer uses 30 gallons per cycle and has a tub volume of 3.0 cubic feet, then the water factor is 10.0. Note: the energy factor for washers does not indicate the real energy efficiency because of the tub size and other factors. Therefore, the Energy Factor is modified to include the tub size and drying characteristics.
- Modified Energy Factor (MEF) is a new equation that replaced Energy Factor as a way to compare the relative efficiency of different units' clothes washers. MEF takes into account the amount of dryer energy used to remove the remaining moisture content in washed items.
For more information about MEF circulation, please see the August 27, 1997 Federal Register entry regarding 10 CFR Part 430.
Clothes Washers & Environmental Protection
Your “Power” in the Environmental Protection
- Wash full loads—Clothes washers are most efficient when operated with full loads.
- Wash clothes in cold water – It will conserve energy and is also recommended for colored and many delicate fabrics.
In addition:
- Consider Front loaders – Since they use less water, they use less energy. The most efficient front loaders use less than half the amount of water used in the average top loaders.
- Purchase washing machines with the Energy Star designation – They are 50 percent more energy efficient than the current minimal allowable standard.
Many new energy-efficient, water-conserving clothes washers have been introduced over the past few years. These resource-efficient washers are available in a variety of sizes and configurations, offering consumers a wide range of front-loading and top-loading styles in many different price ranges.
Clothes Dryers
A clothes dryer dries wet clothes in a rotating drum through which hot air is circulated.
- The hot air removes the residual moisture from the clothes.
- The humid air from the dryer is vented out of the house.
- The drum is rotated with the help of a motor at relatively slow speeds to create a tumbling effect.
Clothes dryers can be of two types: electric and gas.
- In an electric dryer, electrical energy is used for both the motor to rotate the drum and heating the air.
- In a gas dryer, the motor requires electrical energy but the air is heated by natural gas.
Energy Efficiency of Dryers
Dryers work by heating and aerating clothes. The efficiency of clothes dryer is measured by a term called the Energy Factor. It is similar to the miles per gallon for a car, but in this case the measure is pounds of clothing per kilowatt-hour of electricity.
The minimum Energy Factor rating for a standard capacity electric dryer is 3.01. For gas dryers, the minimum energy factor is 2.67. The rating for gas dryers is provided in kilowatt-hours though the primary source of fuel is natural gas.
Unlike most other types of appliances, energy consumption does not vary significantly among comparable models of clothes dryers. Clothes dryers are NOT required to display EnergyGuide labels.
Clothes Dryers: Your “Power” in the Environmental Protection
- Locate your dryer in a heated space. Putting it in a cold or damp basement will make the dryer work harder and less efficiently.
- Make sure your dryer is vented properly. If you vent the exhaust outside, use the straightest and shortest metal duct available. Flexible vinyl duct isn't recommended because it restricts the airflow, can be crushed, and may not withstand high temperatures from the dryer.
- Check the outside dryer exhaust vent periodically. If it doesn't close tightly, replace it with one that does in order to keep the outside air from leaking in. This will reduce heating and cooling bills.
- Clean the lint filter in the dryer after every load in order to improve air circulation and reduce risk of fire. Regularly clean the lint from vent hoods.
- Dry only full loads, as small loads are less economical; but do not overload the dryer.
- When drying, separate your clothes and dry similar types of clothes together. Lightweight synthetics, for example, dry much more quickly than bath towels and natural fiber clothes.
- Dry two or more loads in a row, taking advantage of the dryer's retained heat.
- Use the cool-down cycle (permanent press cycle) to allow the clothes to finish drying with the residual heat in the dryer.
- In good weather, hang clothes dry outside. This the ultimate energy saver for clothes drying
Dishwashers
A dishwasher typically uses the equivalent of 700–850 kilowatt-hours of electricity annually, or nearly as much energy as a clothes dryer or freezer. About 80 percent of this energy is used, not to run the machine, but to heat the water for washing the dishes.
- Older dishwashers use about 8–14 gallons of water for a complete wash cycle.
- Newer dishwashers, built in the past 10 years, have been using 7–10 gallons per cycle.
The dishwasher is the only device at home that requires a water heater temperature that is about 140°F. The units built recently have supplemental heaters in the dishwashers to bump up the temperature so that the main water heater temperature can be set at 120°F or less. Remember that each 10°F reduction in water heater temperature lowers the water heater energy cost by 3 percent to 5 percent.
How a Dishwasher Works
A dishwasher is essentially an insulated water tight box. The dirty dishes are systematically arranged in the dishwasher. As shown below, hot water is sprayed on to the dishes as jets. Repeated jets of water emanating from a spray arm clean the dishes. Some models have two spray arms: one at the bottom of the dishwasher (lower spray arm) and one at the top (upper spray arm). The dirty water passes through a filter and re-circulates until the dishes are finished. Fresh water is then spayed during the rinse cycle to remove the soapy water. Then the dishes are dried with either electric heat or simply with air.
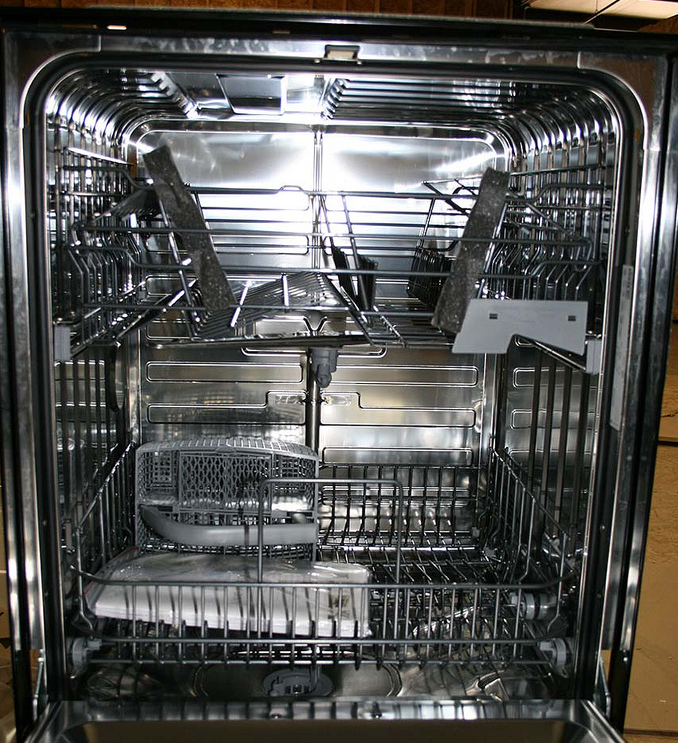
Press the “play” button to see how a dishwasher works. This is also described in the paragraph above. (Note: The animation has no audio.)
Features of a Dishwasher
Dishwashers can be built-in or portable. Built-ins are mounted under a kitchen countertop usually next to a sink. Portables are on wheels with finished tops and sides. Most models can be converted into under-counter mounting. However, because of the additional connection hardware and finished sides, portables usually cost more than similar built-in models.
Some of the additional features that are offered are:
- Interior layout—configuration of sliding racks, baskets, and trays. Does the washing arm reduce the amount of loadable space?
- Water heating—Most homes have water heaters set to 110 degrees. However, to clean well, a dishwasher should use water at 140 degrees. Many budget units now offer a water heating feature.
- Number of cycles—light cycles, normal, heavy or pans, and rinse and hold to remove food if dishes will sit in the washer a while before the wash cycle is run.
- Water-saving cycles—If you live in an area where fresh water is scarce, you’ll want to consider this feature.
- Sound insulation—The sound level will vary from one model to another. Consider how important a quiet wash cycle is before you purchase.
- Build in food disposers—will grind up food similar to in-sink units, allowing the user to spend less time cleaning dishes before they go into the dishwasher.
- Controls—Entry-level machines feature knob and dial controls. On mid- to upper-end models, you will find push-button switches hidden behind smooth, one-piece, plastic console covers. Some of the highest priced dishwashers feature electronic touchpad controls with lighted displays for an uncluttered, high-tech look. And the highest-end European models now integrate controls on the top of the door so they can't be seen when the machine is closed.
- Countdown timer — lets you know how much time is left in a cycle.
- Clean light — signals that cycle is complete and dishes are clean.
- Soil sensors — take the guesswork out of cycle selection. Sensors optically analyze dirtiness of water and adjust water level and wash length accordingly.
- Delay-start — timer that allows starting dishwasher automatically; lets you take advantage of late-night off-peak power rates or run the dishwasher after everyone has taken a shower.
- Color and Appearance—Does the dishwasher fit in your kitchen? Do you like its appearance?
- Delay Start Timer—Allows the user to load the washer and have it start a few hours later.
Energy Efficiency and Test Criteria
Energy Factor (EF) is the dishwasher energy performance metric. EF is expressed in cycles per kWh and is the reciprocal of the sum of the machine electrical energy per cycle, M, plus the water heating energy consumption per cycle, W.
This equation may vary based on dishwasher features such as water-heating boosters or truncated cycles. The greater the EF, the more efficient the dishwasher is.
The EF is the energy performance metric of both the federal standard and the ENERGY STAR qualified dishwasher program. The federal EnergyGuide label on dishwashers shows the annual energy consumption and cost. These figures use the energy factor, average cycles per year, and the average cost of energy to make the energy and cost estimates. The EF may not appear on the EnergyGuide label.
Test Criteria for ENERGY STAR Qualified Dishwashers
Dishwasher manufacturers must self-test their equipment according to the new Department of Energy (DOE) test procedure defined in 10 CFR 430, Subpart B, Appendix C. This DOE test procedure was announced on August 29, 2003, and all models had to be tested using the new procedure by February 25, 2004.
This test procedure establishes a separate test for soil-sensing machines. Included in the final rule was a decision to add standby energy consumption to the annual energy and cost calculation, but not to the energy factor calculation. Also, the average cycles per year has been lowered from 264 cycles per year to 215 cycles per year. Energy Star dishwashers are at least 25 percent more energy efficient than minimum federal government standards.
The table below lists the standard and the ENERGY STAR approved dishwasher energy factors.
| Product Type | Federal Standard Energy Factor | ENERGY STAR Energy Factor |
|---|---|---|
| Standard ( > 8 place settings + six serving pieces) | > 0.46 | > 0.58 |
| Compact (< 8 place settings + six serving pieces) | > 0.62 | NA |
The current ENERGY STAR criteria for dishwashers became effective January 1, 2001. This criteria of at least 25 percent above the federal standard and applies only to models manufactured after January 1, 2001. The previous ENERGY STAR criterion was 13 percent above the federal standard.
Dishwashers & Environmental Protection
Your “Power” in the Environmental Protection
Buying the correct size appliance for your needs is critical to saving money, energy, and water. In dishwashers, there are compact and standard-capacity units. Compact models use less energy and water per load, but you may actually consume more energy operating them more frequently. The following tips help you to save even more:
- Avoid rinsing dishes before you load them in the dishwasher or, if you must rinse, use cold water.
- Run your dishwasher with a full load. Most of the energy used by a dishwasher goes to heat water. Since you can't decrease the amount of water used per cycle, fill your dishwasher to get the most from the energy used to run it.
- Avoid using the heat-dry, rinse-hold, and pre-rinse features. Instead, use your dishwasher's air-dry option. If your dishwasher does not have an air-dry option, prop the door open after the final rinse to dry the dishes.
Review and Extra Resources
Review Sheet Lesson 5 – Appliances
- Appliance energy consumption
- Use Energy guide labels
- Should be able to calculate/perform
- Annual energy savings when comparing two models
- Payback period when comparing two models
- Life cycle analysis when comparing two models
- Should be able to calculate/perform
- Water heaters
- Should be able to calculate energy required for heating water
- Gas vs. electric
- Types of water heaters (advantages and disadvantages)
- Storage or tank
- Type on demand
- Heat pump
- Tankless coil
- Indirect
- Solar
- Energy Efficiency of water heater
- Energy Factor (EF)
- Environmental protection
- Refrigerators
- How Does a Refrigerator Work? Function of:
- Expansion valve
- Evaporator
- Compressor
- Condenser
- Types of refrigerators
- Top Mounted
- Bottom Mounted
- Side-by-side
- Energy Efficiency
- Environmental Protection
- How Does a Refrigerator Work? Function of:
- Clothes Washer
- Types
- Horizontal Axis (front loading)
- Vertical Axis (top loading)
- Efficiency
- Energy Factor (EF)
- Water Factor (WF)
- Modified Energy Factor (MEF)
- Environmental Protection
- Types
- Clothes Dryer
- Energy Efficiency
- Environmental Protection
- Dish Washer
- How a Dishwasher works
- Environmental Protection
Test Yourself
The questions below are your chance to test and practice your understanding of the content covered in this lesson. In other words, you should be able to answer the following questions if you know the material that was just covered! If you have problems with any of the items, feel free to post your question on the unit message board so your classmates, and/or your instructor, can help you out!
- Describe three operating practices in using refrigerators that can save energy and money.
- List the five main components of a refrigerator, and explain how a refrigerator works.
- Describe five ways in which you, with good operating practices, can reduce energy consumption of water heaters at home.
- Explain the advantages and disadvantages between Storage and Demand water heaters.
- What are the various methods in which solar energy can be collected for water heating?
- What is EF? And how does it describe the efficiency of a water heater?
- How do electric and gas compare for water heating?
- Why are ENERGY STAR appliances better in terms of efficiency, and how can they help the environment?
- What are Energy Guide Labels? What information can be obtained from these labels, and how can this information can be used to select an environmentally friendly appliance?
- Briefly describe five ways in which we can save energy in using clothes washers and dryers.
- Compare and contrast the v-axis (top loading) and h-axis (front loading) water heaters.
- Explain how energy efficiency of clothes washers is evaluated.
- What are good operating practices for clothes dryers?
- How can you describe the energy efficiency of dishwashers?
- Describe appliance-operating practices that can help the environment.
- Calculate the amount of heat energy required to heat 200 lbs of water that is heated from 55 degrees F to 130 degrees F.
- 200 gal of water is heated in a heater from 60 degrees F to 120 degrees F every day by a family of four. What is the annual energy requirement?
- An electric water heater heats 250 gallons of water per day from 58 degrees F to 140 degrees F. How many kWh of energy are required? Recall that, 3412 Btus =1 kWh.
- If the temperature of the water heater was reduced to 120 degrees F, what percent of energy can be saved?
- What is the cost of operating the water heater in Problem 3, if electricity cost is $0.08 per kWh?
- A water heater heats 200 gal of water a day from 55 degrees F to 130 degrees F using natural gas. How many CCF of natural gas are required every month?
- What would be the monthly cost of natural gas in problem 6?
- What would be the monthly cost of energy if electricity was used for heating the water in problem 6?
- If the temperature of the water heater was reduced to 120 degrees F in Problem 6, how many kWh could be saved and what would be the cost savings?
- Estimate the % energy savings of an electric water heater that heats 100 gallons per day when the temperature is set back at 110 instead of 120 F. The basement is heated and is at 65 F. The life of the water heater is expected to be about 15 years.
- Use an appropriate cost for electricity, and compare the operating expenses with the approximate initial cost of the water heater (from the lectures).
- Heat required (BTUS) = m x Cp x (Temperature Difference)
- Where Cp is the heat capacity of water (1 Btu/lb/F)
- And m is the mass of the water (Assume 1 gal has 8.3 lb of water and the 3,412 Btus = 1 kWh)
- An old refrigerator consumed 150 W of power. Assuming that the refrigerator operates for 20 hours in a day, what is the annual operating cost, assuming the cost of electricity to be $0.06 per kWh?
- Suppose that an oven lasts for 10 years. For a given heating effect, the least efficient oven draws 1,000 W. The most efficient one uses 450 Watts. Assuming that the oven uses 700 W annually, and that the local energy cost is 0.06 per kWh, can you save any money? If so, how much money over its lifetime? If the more efficient oven costs $100 more than the least efficient one, would you buy the more efficient model?
- Suppose you are comparing two refrigerators, both of which last for 10 years. The least efficient refrigerator draws 275 W of power. The most efficient one uses 250 Watts. Assuming that the refrigerator operates 4000 hours annually and that the local energy cost is 0.06 per kWh, can you save any money with the energy efficient model? If so, how much money over its lifetime? If the more efficient refrigerator costs $100 more than the least efficient one, would you buy the more efficient model?
Lesson 5 Deliverables
Deliverable 1
You must complete a short quiz that covers the reading material in lesson 5. The Lesson 5 Quiz, can be found in the Lesson 5: Appliances module in Canvas. Please refer to the Calendar in Canvas for specific time frames and due dates.
Lesson 6: Lighting
The links below provide an outline of the material for this lesson. Be sure to carefully read through the entire lesson before returning to Canvas to submit your assignments.
Introduction
Welcome to Lesson 6!
Welcome to the lesson on lighting. In this chapter, we are basically going to look at basic lighting principles and definitions. Light can be generated in several ways, and we are going to look at the ways in which we can generate light and discover which is the most efficient of all these methods. We will also learn a little bit about some of the definitions, like how light is measured and what the intensity is, and how to measure the efficacy or efficiency of lighting and so on and so forth.
We will also look at the different types of bulbs that are available around for us to use. The U.S. is currently in a transition to more efficient lightbulbs. 10 years ago, incandescent lightbulbs dominated the market, but now ~100 % of all lightbulb replacements are some form of energy efficient model. Some of you may be familiar with light emitting diode (LED) and compact florescent (CFL) bulbs, and we will be looking at how each of these types work and also how the light is generated. What is the efficiency with which we generate lighting?
As far as calculations are concerned, we will be doing the most important calculation in this chapter again, and that is life cycle analysis. Life cycle analysis is, as I mentioned in the last chapter, the total cost over the life cycle of a product. The life cycle begins the moment you buy and lasts until the moment the product dies or is put to retirement. Until then, what does it cost? In other words, the costs would be to buy it and to feed it the electricity or the energy, and then if there are any maintenance costs, they are also involved. So we have to calculate all of these aspects over the lifetime of a particular bulb, and then compare bulb A with bulb B. That life cycle analysis is what you will have to spend quite a bit of time with and make sure you understand it.
We'll also consider the way we measure the efficiency and the efficacy of lighting, and also improved lighting controls. If we have an existing home or existing system, what can we add; how can we improve the efficiency? How can we get more light for less energy? So this is a chapter where we can work to save a lot of energy. And we spend about, almost 40 billion dollars a year in this country on lighting, so easily we can save about 20 billion dollars and the associated energy that is involved and the impact. Think about it -- the impact that we can make on the environment by using more efficient light. So let’s get started.
Lighting
These are some statistics on lighting in the US. Information like this does not get updated often (The U.S. hasn't been spending money on these types of studies), so here is where we were as of 2015:
- Lighting accounts for 5 to 10 percent of all electricity consumed in the United States.
- An average household dedicates ~4 percent of its energy budget to lighting. Commercial establishments consume about ~20 percent of their total energy just for lighting.
- Technologies developed during the past 15 years can help us cut lighting costs 30 to 75 percent while enhancing lighting quality and reducing environmental impacts.

Lesson 6 Objectives
Upon completing this lesson, students will be able to:
- explain basic lighting principles and definitions;
- list the various types of lighting and explain how each type works;
- describe energy efficient lighting options;
- calculate life cycle costs (LCC) for different types of lighting.
Questions?
If you have any questions, please post them to the General Course Questions forum in located in the Discussions tab in Canvas. While you are visiting the discussion board, feel free to post your own responses to questions posted by others - this way, you might help a classmate!
How Lighting is Measured
When most people buy a light bulb, they look for watts (W). Recall that watt is a unit of power, (i.e., the rate at which energy is consumed from the electricity supplier). It does not say anything about the light.
The most common measure of light output (or luminous flux) is the lumen. All lamps are rated in lumens, as shown in the figure below, and every bulb has 3 parameters listed on the package:
- Lamp lumen output or light output
- Power consumption in watts
- Life of the bulb in hours
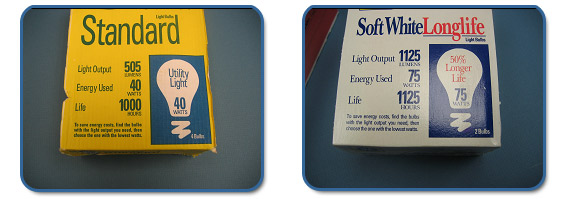
Watch this video (1:44) below to find out more about lumens.
Today you’ll see more light bulb options in stores. These bulbs will give you the light you want while saving you energy—and money.
Here’s something to consider. In the past, we bought light bulbs based on how much energy—or how many watts—they use. But today’s energy-saving light bulbs use up to eighty percent less power to give you the same amount of light. So wouldn’t it make more sense to buy light bulbs based on how much light they provide? With lumens, you can do just that.
Lumens are a measure of brightness. So if you know how many lumens you want, you’ll buy just the right bulb for any spot in your home.
Instead of buying an inefficient sixty-watt bulb, look for an efficient replacement that gives you about eight hundred lumens of light. If you’re replacing a one hundred-watt bulb, look for an energy-saving bulb that gives you about sixteen hundred lumens.
Just think: the more lumens, the brighter the light.
To help you shop for the light you want, you’ll find an easy-to-read label on light bulb packages. So you’ll have a simple way to see the bulb’s brightness, how much the bulb will cost to operate for a year, and other qualities like light color—from warm yellowish to cool bluish.
With more energy-saving choices appearing on store shelves, including compact fluorescents, or CFLs, light emitting diodes, or LEDs, and energy-saving incandescents, you’ll have more options that save you money.
So when shopping for a new bulb, look for lumens—or how bright the bulb is. Remember, lumens is the new way to shop for light.
Footcandles
A footcandle (fc) is the Standard unit of measure for illumination on a surface. It is a lumen of light distributed over a 1-square-foot (0.09-square-meter) area.
The average footcandle level on a square surface is equal to the amount of lumens striking the surface, divided by the area of the surface.
Example
A 40 watt bulb produces about 505 lumens and has a life of about 1,000 hours. When this bulb is used to light a room of 10 x 10 feet, these 505 lumens are distributed over 100 square feet of floor area. What is the illumination?
How Much Lighting is Needed
How much light is needed in a room depends on the task(s) being performed (contrast, requirements, space, size, etc.). There are three different types of task-oriented lighting: Ambient, Task, and Accent. The light requirement also depends on the ages of the occupants and the importance of speed and accuracy of the task.
- Ambient lighting is general purpose lighting—an example is the lighting used in hallways for safety and security. An illumination of 30–50 fc is generally the maximum that one needs for this purpose.
- Task lighting is lighting that is designed for specific tasks. Reading and writing are the most light-intensive tasks and require about 50 fc at home. Tasks like cooking, sewing, or repairing a wrist watch require more -- about 200–300 fc. However, the area with this level of illumination will be small. Increasing the light everywhere is not required and is a waste of energy.
- Accent lighting is the lighting that is provided to highlight certain objects or areas, for example, the use of floodlights to highlight a painting or a statue. Accent lighting also illuminates walls, so they blend more closely with naturally bright areas like ceilings and windows. Accent lighting can be high intensity or subtle.
How Much Light is needed?
Now we are going to examine the question, "How much lighting we need?" The answer depends on what kind of task we are doing.
a. Task being performed; Ambient, Task, or Accent
Say if you are just walking in the hallway; you need a little bit of light to see each other and to recognize what is there. That lighting is called ambient lighting, or general purpose lighting. Here's an example where I am sitting here in this conference room and trying to take notes or reading a book, and this type of lighting, the type of lighting that I need here, is called task lighting. I am doing the specific task of reading a book. Or you can take another example of cooking. You know, you are cooking something, and you need to know exactly whether it is done or not; you need lighting there. That is again, task oriented lighting.
So, it depends on the task that you are doing. There are three types usually: first is the ambient, the second one is task lighting, and the third one is accent lighting. The idea there is you want to highlight certain aspects; maybe a painting, maybe a statue that you own or any other thing, a map. You know, whatever you want to highlight. Instead of highlighting entire room lighting, you can highlight that particular piece with some special lighting, and that type of lighting is called accent lighting.
b. Age of the occupants
How much light we need also depends on the age of the group, the age of the people that are in there, in the room. Usually, older people need higher amounts of light than younger people.
c. Importance of speed and accuracy
We also must consider the speed and accuracy with which we want to do certain things. Say, for example, a person is repairing a small wristwatch. Obviously they need more lighting, especially if they want to repair very fast. So speed and accuracy with which we want to do a job also dictate how much light we want.
Color Rendering Index
Lamps are assigned a color temperature (according to the Kelvin temperature scale) based on their "coolness" or "warmness." The human eye perceives colors as cool if they are at the blue-green end of the color spectrum, and warm if they are at the red end of the spectrum.
Instructions: Click "play" to see examples of the light sources that temperatures represent. (Note: The video has no audio.)
Color Rendering Index
Based on the previous description of color temperature, here are some examples of light sources that a color temperature (measured in Kelvin) might represent.
- 10,000° K - Clear blue sky
- 7,000° K - Overcast sky
- 5,500° K - The Sun at noon
- 4,000° K - Fluorescent light
- 3,000° K - Halogen bulb
- 2,800° K - Light bulb
- 1,900° K - Candle light
- 1,000° K - Sunrise
The ability to see colors properly is another aspect of lighting quality. Objects' colors appear to be different under different types of light. The color rendering index (CRI) scale is used to compare the effect of a light source on the color appearance of its surroundings. A scale of 0 to 100 defines the CRI. A higher CRI means better color rendering, or less color shift.
Instructions: Move the drag button in the center of the picture below to see the difference between low CRI and high CRI.
Factors Affecting the Number of Lamps Required
Instructions: Click on the hot spots below to determine the factors that affect the number of lamps required:
Types of Lighting: Incandescent Bulbs
There are five basic types of lighting:
- Incandescent
- Fluorescent
- High-intensity discharge
- LED
Incandescent Bulbs
Thomas Alva Edison invented the incandescent light bulb with reasonable life. Lewis Latimer has perfected it with the use of carbon filament.
The incandescent bulb consists of a sealed glass bulb with a filament inside. When electricity is passed through the filament, the filament gets hot. Depending on the temperature of the filament, radiation is emitted from the filament.
The filament's temperature is very high, generally over 2,000º C, or 3,600º F. In a "standard" 60-, 75-, or 100-Watt bulb, the filament temperature is roughly 2,550º C, or roughly 4,600º F. At high temperatures like this, the thermal radiation from the filament includes a significant amount of visible light.
This principle of obtaining light from heat is called ‘incandescence.” At this high temperature of 2,000º C, about 5 percent of the electrical energy converts into visible light and the rest of it is emitted as heat or infrared radiation.
Instructions : Press play to see how an incandescent light bulb works. (Note: The animation has no audio.)
How an Incandescent Light Bulb Works
In an incandescent light bulb, electricity travels up and through the filament, causing it to heat up and glow brightly. To prevent the filament from combusting, all of the oxygen is removed from the bulb.
Let’s now look at several different types of incandescent bulbs.
Standard incandescent bulbs
Standard incandescent bulbs are most common and yet are the most inefficient. Larger wattage bulbs have a higher efficacy (more lumens per Watt) than smaller wattage bulbs.
Instructions: Click the “graph” button below to create a graph comparing Watts and efficiency, and then answer the question below.
Comparison of Watts and Efficiency for an Incandescent Bulb
The table below compares the number of Watts of a light bulb to its efficiency (lumens per Watt).
| Watts (power) | 25 | 40 | 60 | 75 | 100 | 150 |
|---|---|---|---|---|---|---|
| Efficiency (lumens per Watt) | 8 | 12 | 14 | 15 | 17 | 19 |
Based on this data, it is clear that as the number of Watts increase, so does the efficiency.
Tungsten halogen bulbs
Tungsten halogen is an incandescent lamp with gases from the halogen family sealed inside the bulb and an inner coating that reflects heat back to the filament. It has similar light output to a regular incandescent bulb, but with less power. Halogens in the gas filling reduce the material losses of the filament caused by evaporation and increase the performance of the lamp.

Tubular tungsten-halogen bulbs
Tubular tungsten-halogen bulbs are commonly used in “torchiere” floor lamps, which reflect light off of the ceiling, providing more diffused and suitable general lighting.
Although these provide better energy efficiency than the standard A-type bulb, these lamps consume significant amounts of energy (typically drawing 300 to 600 W) and become very hot (a 300-W tubular tungsten-halogen bulb reaches a temperature of about 2600° C compared to about 600° C for a compact fluorescent bulb). Because Tungsten-halogen lamps operate at very high temperatures (high enough to literally fry eggs), they should not be used in fixtures that have paper- or cellulose-lined sockets.

Halogen bulbs
A halogen bulb is often 10 to 20 percent more efficient than an ordinary incandescent bulb of similar voltage, wattage, and life expectancy. Halogen bulbs may also have two to three times as long a lifetime as ordinary bulbs. How much the lifetime and efficiency are improved depends largely on whether a premium fill gas (usually krypton, sometimes xenon) or argon is used. The image below shows a picture taken with an Infrared camera comparing the heat produced by a halogen and a compact fluorescent light bulb. The red and white color zones are extremely hot, and the blue zones are cooler.
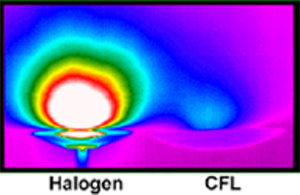
Reflector Lamps
Reflector Lamps - Light waves from a bulb spread in all directions. The light that goes toward the back is not useful when the light is most needed in the front. Reflector lamps (Type R) are designed to spread light over specific areas.
Reflector lamps have silver coating on the sides, like any mirror, and therefore all the light waves passing through the sides or the back are reflected to the front. Therefore, they are called reflector lamps and are also called floodlighting, spotlighting, and down lighting bulbs.
Instructions: Click the buttons below to see the difference between a regular and reflective lamp light bulb:
(Note: The animations have no audio.)
Parabolic aluminized reflector (PAR) lamps
Parabolic aluminized reflector (PAR) lamps (shown in the image below) are also available with halogen technology to operate at 120 volts. A standard 150-W incandescent spotlight can be replaced with a lower wattage halogen lamp, reducing electricity consumption by up to 40 percent.
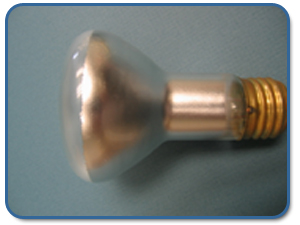
Types of Lighting: Fluorescent Bulbs
The fluorescent lamp is a major advancement and a commercial success in small-scale lighting since the original tungsten incandescent bulb. These bulbs are highly efficient compared to incandescent bulbs. Fluorescence is the phenomenon in which absorption of light of a given wavelength by a fluorescent molecule is followed by the emission of light at longer wavelengths. Please watch the following 2:19 presentation about fluorescent bulbs:
Types of Lighting, Fluorescent
These fluorescent bulbs that you are seeing, the long tubes, basically have two electrodes on the sides. And you pass electric current, and that creates an arc between the two electrodes, and that tube is filled with inert gasses. The inert gasses are argon or an argon plus krypton mixture. No air in there. Just an argon plus krypton mixture, and you spark it with a little bit of mercury in there. When you generate that arc between two electrodes, on the two sides of that tube, that arc excites these mercury atoms to a higher state. And then when they are coming back to the ground state, they have to release that excess energy that they absorbed, and they release it as non-visible UV light.
UV light is not visible. UV light is dangerous. Remember, UV light is what comes out when the mercury atoms are coming back to the ground state. But you know this tube is coated on the inside. The inside wall is coated with a different material, a special material called phosphorous. And those particles that are coated have a unique ability to absorb this UV light that is released when the mercury atoms are coming to the ground state. So that is absorbed, and that phosphorous coating will give out visible light. It absorbs UV light and gives out visible light. So without that phosphorous coating in there, a fluorescent bulb would not work. Fluorescence is absorbing UV light in the phosphorous and giving out visible light.
So, change of frequency, or change of energy status, is called fluorescence and a bulb that uses this principle is called a fluorescent bulb.
A fluorescent bulb consists of a glass tube with a phosphorus coating, a small amount of inert gas (usually argon or krypton), mercury, and a set of electrodes. Contact points on the outside of the tube carry electricity into the bulb.
Instructions: The animation below (1:04) shows a step-by-step depiction of how fluorescent lamps provide light. You may replay the video to review steps. (Note: The animation has no audio.)
How a Fluorescent Light Bulb Works
A fluorescent bulb consists of a glass tube with a phosphorous coating, a small amount of inert gas (usually argon or krypton), mercury, and a set of electrodes. Contact points on the outside of the tube carry electricity into the bulb.
When you turn on the light switch, electricity travels into the tube and to the electrodes, which produce electrons and allow a current to pass from one side of the tube to the other. Voltage between the electrodes causes electrons and charged argon molecules to move within the tube. The electrical currents also cause some of the liquid mercury to turn into gas.
As the moving electrons and charged argon molecules collide with the mercury atoms, they become excited. When they return to their normal state, they release energy in the form of ultraviolet photons. Because UV light has a very short wavelength that we cannot see, the phosphorous coating on the tubing converts the UV photons into visible light protons that we can see.
Fluorescent lamps are about 2 to 4 times as efficient as incandescent lamps at producing light at the wavelengths that are useful to humans. Thus, they run cooler for the same effective light output. The bulbs themselves also last a lot longer—10,000 to 20,000 hours versus 1,000 hours for a typical incandescent.
Fluorescent lights need ballasts (devices that control the electricity used by the unit) for starting and for circuit protection. Ballasts require energy, and for some type of ballasts, efficiency is only achieved if the fluorescent lamp is left on for long periods of time without frequent on-off cycles.
The image below shows a picture of a full-size fluorescent lamp fixture. The energy savings for existing fluorescent lighting can be increased by:
- re-lamping (e.g., replacing an existing lamp with one of a lower wattage);
- replacing ballasts;
- replacing fixtures with more efficient models.
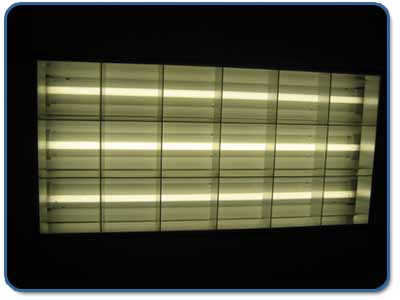
Full-size fluorescent lamps are available in several shapes, including straight, U-shaped, and circular configurations. Lamp diameters range from 1" to 2.5". The most common lamp type is the four-foot (F40), 1.5" diameter (also called T12) straight fluorescent lamp. More efficient fluorescent lamps are now available in smaller diameters, including the 1.25 " (also called T10) and 1" (also called T8).
Fluorescent lamps are available in color temperatures ranging from warm (2700 K) "incandescent-like" colors to very cool (6500 K) "daylight" colors.
Cool white (4100 K) is the most common fluorescent lamp color. Neutral white (3500 K) is becoming popular for office and retail use.
Compact Fluorescent Lamps
Compact Fluorescent Lamps are miniaturized fluorescent lamps that usually have premium phosphors, which often come packaged with integral or modular ballast, as shown in the image below.
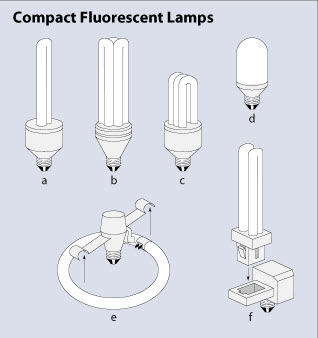
Compact fluorescent lamps (CFLs) come in a variety of sizes and shapes including (a) twin-tube integral, (b and c) triple-tube integral, (d) integral model with casing that reduces glare, (e) modular circline and ballast, and (f) modular quad-tube and ballast. CFLs can be installed in regular incandescent fixtures, and they consume less than one-third as much electricity as incandescent lamps.
Compact Fluorescent Lamps have the following characteristics. They:
- Typically have a standard screw base that can be installed into nearly any table lamp or lighting fixture that accepts an incandescent lamp.
- Come in a variety of sizes and shapes and are being used as energy saving alternatives to incandescent lamps.
- Have a much longer life—6,000 to 20,000 hours (10 to 20 times longer), compared to 750 to 1000 hours for a standard incandescent.
- Can replace incandescent bulbs that are roughly 3 to 4 times their wattage, but can cost up to 10 times more than comparable incandescent bulbs.
- produce ~70 lumens per watt.
- Are an energy-efficiency investment. Although they cost more, they are very economical in the long run.
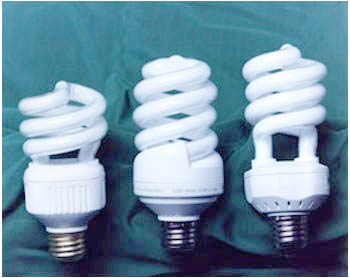
Types of Lighting: High-intensity Discharge
High-intensity discharge (HID) lamps are similar to fluorescents in that an arc is generated between two electrodes. The arc in an HID source is shorter, yet it generates much more light, heat, and pressure within the arc tube.
Below are HID sources, listed in increasing order of efficacy (lumens per watt):
- mercury vapor
- metal halide
- high-pressure sodium
- low-pressure sodium
Like fluorescent lights, HID also requires ballasts, and they take a few seconds to produce light when first turned on because the ballast needs time to establish the electric arc.
| Advantages of HID lamps | Disadvantages of HID lamps |
|---|---|
|
|
Types of High-Intensity Discharge Lamps
Mercury vapor lamps
Mercury vapor lamps are widely used to light both indoor and outdoor areas such as gymnasiums, factories, department stores, banks, highways, parks, and sports fields.
Mercury vapor lamps consist of an inner arc discharge tube constructed of quartz surrounded by an outer hard borosilicate glass envelope. Shortwave UV, a result of the decay of mercury atom electrons from an excited to a stable state, is readily transmitted through the inner quartz tube but is virtually blocked by the outer glass envelope during normal operation.
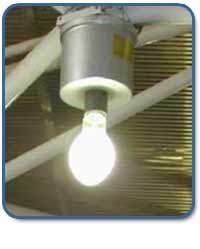
Metal Halide lamps
Metal Halide lamps are similar to mercury vapor lamps but use metal halide additives inside the arc tube along with the mercury and argon. These additives enable the lamp to produce more visible light per watt with improved color rendition.
Wattages range from 32 to 2,000, offering a wide range of indoor and outdoor applications. The efficacy of metal halide lamps ranges from 50 to 115 lumens per watt, typically about double that of mercury vapor.
Because of the good color rendition and high lumen output, these lamps are good for sports arenas and stadiums. Indoor uses include large auditoriums and convention halls. These lamps are sometimes used for general outdoor lighting, such as parking facilities, but a high-pressure sodium system is typically a better choice.
| Advantages of Metal Halide Lamps | Disadvantages of Metal Halide Lamps |
|---|---|
|
|
High-Pressure Sodium (HPS) Lamp
The high-pressure sodium (HPS) lamp is widely used for outdoor and industrial applications. Its higher efficacy makes it a better choice than metal halide for these applications, especially when good color rendering is not a priority.
HPS lamps differ from mercury and metal-halide lamps in that they do not contain starting electrodes; the ballast circuit includes a high-voltage electronic starter. The arc tube is made of a ceramic material which can withstand temperatures up to 2,372°F. It is filled with xenon to help start the arc, as well as a sodium-mercury gas mixture.
The efficacy of the HPS lamp is very high (as much as 140 lumens per watt.) For example, a 400-watt high pressure sodium lamp produces 50,000 initial lumens. The same wattage metal halide lamp produces 40,000 initial lumens, and the 400-watt mercury vapor lamp produces only 21,000 initially.
Sodium, the major element used, produces the "golden" color that is characteristic of HPS lamps. Although HPS lamps are not generally recommended for applications where color rendering is critical, HPS color rendering properties are being improved. Some HPS lamps are now available in "deluxe" and "white" colors that provide higher color temperature and improved color rendition. The efficacy of low-wattage "white" HPS lamps is lower than that of metal halide lamps (lumens per watt of low-wattage metal halide is 75-85, while white HPS is 50-60 LPW).
Types of Lighting: LED
As we mentioned before, LED stands for light emitting diode. This type of lighting is completely different than the other types of lighting we have discussed so far. They do not need specific gases, filaments or moving parts because they are made from semiconducting materials, which makes and LED a semi-conducting device that produces light. The underlying principles of an LED light are the opposite function of a photovoltaic system. An LED semiconductor chip form an junction between and n-type and p-type semiconductor materials. N-type materials pass charge using electrons, and p-types pass charge using holes. See the figure below for a description of the circuit.

LEDs do not directly produce white light. Due to this quirk, LEDs were originally used for colored light applications such as traffic lights and exit signs.

Because of their extremely high efficiencies (150 lumens per watt!!, and up to 90 % more efficient than incandescent light bulbs), researchers found ways to convert their outputs to white light. As such, they are one of the highest efficiency lighting options available.
Here are three examples:
- Phosphor conversion, in which a phosphor is used on or near the LED to convert the colored light to white light
- Color-mixed systems, in which light from multiple monochromatic LEDs (e.g., red, green, and blue) is mixed, resulting in white light
- A hybrid method, which uses both phosphor-converted (PC) and monochromatic LEDs.

These innovations have allowed these bulbs to be suitable for general lighting in residential applications. These bulbs last for 5-10 years depending on their usage. Now, you can find them in almost every store, and they look something like this.

Life Cycle Cost Analysis
Performing a life-cycle cost analysis (LCC) gives the total cost of a lighting system—including all expenses incurred over the life of the system. This analysis can be applied not only to lighting but for most of the appliances, automobiles, heating systems, and so on, when two systems are compared to determine the most cost effective options.
There are two reasons to do an LCC analysis:
- To compare different systems, or bulbs in this case.
- To determine the most cost-effective system or a bulb.
For some lighting systems, one of two situations may exist:
- The initial cost may be high, but the energy costs will be low over its lifetime.
- The initial cost to buy a bulb or a system and the energy or the maintenance costs may be low, but the useful life of such a bulb or system may be short. (In this case, we may have to replace the appliance several times to get the same useful life as the other option.)
Therefore, a life-cycle cost (LCC) analysis can be helpful for comparing the total costs incurred over the lifetime of a lighting system. It is, in essence, calculating all the costs incurred to buy, maintain, and run the system over its lifetime.
In the formula above,
- Cost to buy is the purchase price of the bulb or the system.
- Cost to maintain is the cost incurred to maintain it in good operating condition. (For example in the case of a car, an engine oil change every 3,000 miles is part of maintenance costs.)
- Cost of energy is the energy or the fuel it takes to run the appliance or bulb for its lifetime.
- Replacement cost is the cost to replace the bulb. If bulb A has a life of 1000 hrs and bulb B has a life of 10,000 hours, then Bulb A needs to be replaced 10 times to get the same useful life period as that of bulb B. Therefore, 10 A bulbs need to be purchased for each B Bulb.
The table below shows a life cycle cost analysis in comparing an incandescent bulb and a CFL.
| Category | Incandescent | Compact Fluorescent Light (CFL) |
|---|---|---|
| Rating | 60 Watts | 15 Watts |
| Lumen output | 865 Lumens | 900 Lumens |
| Cost to buy the bulb ($) | $0.60 | $5.00 |
| Life of each bulb | 1,000 h | 10,000 h |
| Bulbs needed for same life | 10 bulbs - $6.00 | 1 bulb - $5.00 |
| Energy Consumption | 60 Watts x 10,000 h 600,000 Wh = 600 kWh |
15 Watts x 10,000 h 150,000 Wh = 150 kWh |
| Price of electricity | $0.085 | $0.085 |
| Cost of Electricity needed for 10,000 h | 600 kWh x 0.085/kWh = $51.00 |
150 kWh x 0.085/kWh = $12.75 |
| Total Cost (Life Cycle costs) to own and operate the bulbs for 10,000 h | $51.00+$6.00 $57.00 |
$12.75+$5.00 $17.75 |
Although they save energy, there are some disadvantages with CFLs:
- They are often physically larger than the incandescent bulbs they replace, and simply may not fit the lamp.
- The light is generally cooler—less yellow—than incandescent light bulbs. This may result in less than pleasing contrast with ordinary lamps and ceiling fixtures. Newer models have been addressing this issue.
- Some types (usually iron ballasts) may produce an annoying flicker.
- Ordinary dimmers cannot be used with compact fluorescents.
- Like other fluorescents, operation at cold temperatures (under around 50–60 degrees F) may result in reduced light output.
- There may be an audible buzz from the ballast.
Efficacy of Light Bulbs
Efficacy is the ratio of light output from a lamp to the electric power it consumes, and is measured in lumens per watt (LPW).
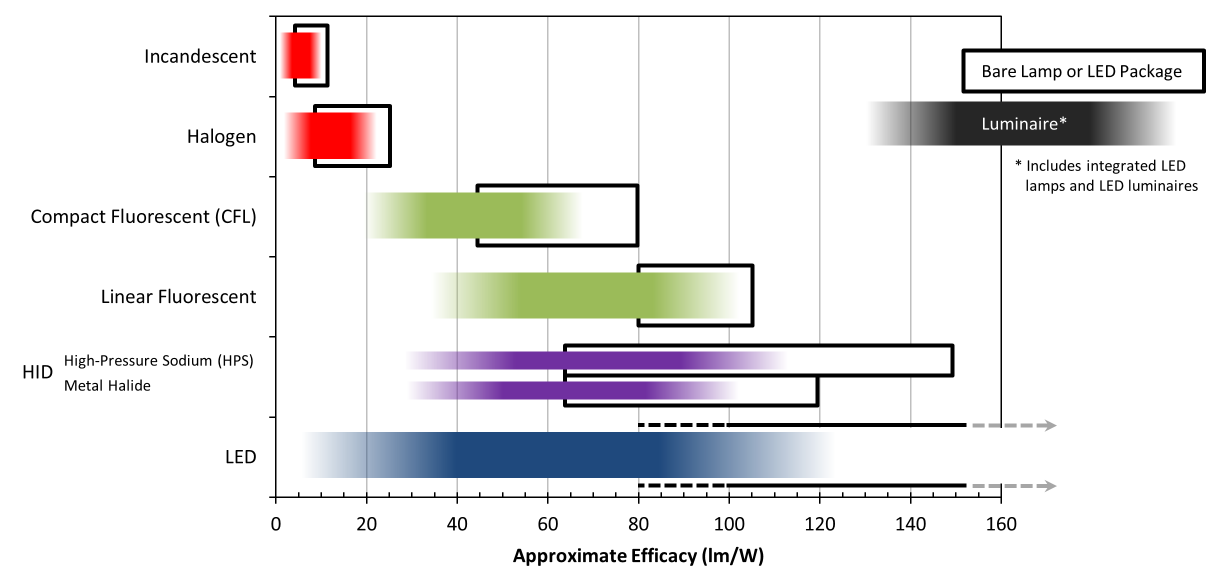
Below is a list of different types of light bulbs and the light output of each (measured in lumens per watt):
- Incandescent: 8 - 22
- Mercury: 22 - 58
- Fluorescent: 30 - 38
- Metal Halide: 74 - 132
- High Pressure Sodium: 74 - 132
- Low Pressure Sodium: 70 - 152
- LED: 10-200
Conventional incandescent lamps in a single four-way traffic light consume roughly 85 kWh of electricity per day and cost about $1,600 per year to operate. LED lights use just 10 percent of the electricity that incandescent lamps use, so the opportunity for savings is enormous.
Improved Lighting Controls
Lighting controls give you the flexibility to design a space for multiple use and easy access. They should be a part of the lighting plan for every room. Both manual and automatic controls can cut energy costs by making it easier to use lights only when and where they are needed.
Controls used with high-wattage incandescent bulbs are especially effective for saving energy, but they should be considered for use with any lights that might be left on when no one is using them.
Always choose controls that are compatible with the bulb and ballast. Try to obtain the best quality, so the controls will perform well over time.
Types of Lighting Controls
Switches
The simple on-off switch, whether mounted on a wall or on the light fixture, should always be obvious and convenient.
- On fixtures with pull-cord switches, attach an object at the end that is easy to see and grasp.
- Install multiple wall switches in areas that have more than one entrance, such as hallways, staircases, and large rooms.
- Ensure that these switches should be easy to find as well by adding devices such as oversized toggles or switch plates that glow in the dark.
- A small indicator light near a switch can signal when lights that are out of sight—in the basement or outdoors, for example—have been left on.
- If a main switch in a room controls several lights, each fixture should have its own switch, so individual lights can be turned off if they are not needed.
- In rooms such as kitchens, where lights are used for different purposes, overhead ambient lights, counter, or island lights should be on separate switches.
- A three-level switch in lamps is a simple way to use one fixture for several lighting needs. When the higher levels are not necessary, switch it to the lowest level to save energy.
Photocells
A photosensor measures the light level in an area and turns on an electric light when that level drops below a set minimum. They are most effective with lights that stay on all night long, such as some outdoor fixtures or night lights. If a light does not need to remain on throughout the night, use a timer or motion detector.
Timers
Timers are an inexpensive way to control the amount of time a light stays on inside the home or outdoors. They can be located at a light switch, at a plug, or in a socket. Some models are turned on manually and set to turn off after a designated number of minutes or hours. Others can be programmed to turn on and off at specified times. Both mechanical and solid-state timers are available, and some offer the option of a manual override. Some screw-base compact fluorescent bulbs cannot be used with timers, so check the manufacturer's recommendations.
Be careful not to set timers so a light might turn off in an area when someone could be left in the dark. Or, install a glow-in-the-dark switch plate or a very low-wattage night-light with a photosensor near the switch, so it is easy to find.
Motion or Occupancy Sensors
Motion detectors, or occupancy sensors, have proven to be an excellent way to save energy, especially in bathrooms and bedrooms where lights are frequently left on. They are also popular outdoors for walkways, driveways, and as security lights.
Sensors can operate automatically to turn lights on when movement is detected, then off after a specified period of no motion, or they can have manual on or off switches. Some models feature dimmers that reduce light to a preset level rather than turn completely off when there is no movement; others come with photo sensors that turn lights on only when the light level is below a preset point and motion is detected.
Follow manufacturer's instructions for installing sensors to ensure the proper coverage area. Also, be sure the lights are compatible with the sensors. Some compact fluorescents should not be used with motion detectors, nor should high intensity discharge lights because of their inability to relight quickly.
Dimmers
Dimming fluorescent lamps is not all that easy to do. If you reduce power to the lamp, the filaments will not be as hot, and will not be able to thermionically emit electrons as easily. If the filaments get too cool by dimming the lamp greatly, usually the lamp will just go out. If you force current to continue flowing while the electrodes are at an improper temperature, then severe, rapid degradation of the thermionic material on the filaments is likely. To effectively, reliably, and safely dim fluorescent lamps below around half brightness or so, you need special equipment that may only work properly with a specific lamp. Such equipment typically gives some power to the filaments to keep them at a workable temperature, while the current flowing through the bulb is greatly reduced.
Manual dimming controls allow occupants of a space to adjust the light output or illumination. This can result in energy savings through reductions in input power, as well as reductions in peak power demand, and enhanced lighting flexibility.
Fluorescent lighting fixtures require special dimming ballasts and compatible control devices. Some dimming systems for high-intensity discharge lamps also require special dimming ballasts.
Comparison of Different Bulbs

Incandescent Bulbs:
- do not require a ballast
- have a warm color appearance with a low color temperature and excellent color rendering (CRI 100)
- are a compact light source
- require simple maintenance due to screw-in Edison base
- are a less efficacious light source
- have a shorter service life than other light sources in most cases
- have a filament that is sensitive to vibrations and jarring
- can get very hot during operation
- must be properly shielded because incandescent lamps can produce direct glare as a point source
- require proper line voltage, as line voltage variations can severely affect light output and service life

Fluorescent Bulbs:
- require a ballast
- have a range of color temperatures and color rendering capabilities
- have low surface brightness compared to point sources
- have a cooler operation
- are more efficacious compared to incandescent
- ambient temperatures and convection currents can affect light output and life
- all fixtures installed indoors must use a Class P ballast that disconnects the ballast in the event it begins to overheat; high ballast operating temperatures can shorten ballast life
- have options for starting methods and lamp current loadings
- require compatibility with ballast
- low temperatures can affect starting unless a "cold weather" ballast is specified

High Intensity Discharge (HID) Bulbs:
- require a ballast
- ambient temperature does not affect light output, although low ambient temperatures can affect starting, requiring a special ballast
- are a compact light source
- are high lumen packages
- are a point light source
- have a range of color temperatures and color rendering abilities depending on the lamp type
- have a long service life
- are highly efficacious in many cases
- have line voltage variations, possible line voltage drops, and circuits sized for high starting current requirements which must be considered
Review and Extra Resources
EGEE 102 Lesson 6 Review
For task lighting a specific task, specific task meaning either reading or writing or cooking or repairing something, that requires generally about 40 to 50 foot candles. Sometimes, if you're working on small objects, you may need even a little more light. Accent lighting is the lighting that is used to highlight certain things at home, for example, a painting or a statue or something you want to highlight.
And you should be able to design lighting for certain areas. That's something that you may want to look at. Let's say you're designing for a general purpose hallway. You have 10 square feet, and each square foot requires about 10 lumens, which means 100 square feet requires 1,000 lumens. So you should be able to figure that out.
Color rendering index - different lighting produces different abilities to look at true colors. And you need to know the color rendering index. It is measured on a scale from zero to 100, and 100 being perfect colors or absolutely no color shift. And that is generally possible in natural light.
And when you have a room, how many lamps are required? That depends on how many lumens. You need total area and lumens, and each bulb gives out a certain number of lumens, and how many bulbs you require is based on that.
For example, if you have a room of 100 square feet, you need, let's say, 20 foot candles, which means 20 lumens per square foot. So every square foot requires 20 lumens. So in this case, 20 times 100 would be 2,000 lumens needed for that room.
And let's say if a 60-watt bulb gives you 1,000 lumens, you need two of these bulbs to get that 2,000 lumens. Of course, there are other factors like reflections off the walls and also the light fixture efficiency and so on and so forth. So you need to know the factors that affect, particularly the number of lamps required.
Types of lighting - you need to know the differences between incandescence, fluorescence, and high-intensity discharge lamps - how you produce the light, the process, and the hardware that is involved. And you should be able to perform life-cycle analysis. In other words, if you have two different types of light, for example an incandescent light and a CFL bulb - you are able to perform a life-cycle analysis using these two bulbs.
Life cycle analysis is cost to own and operate for the entire lifetime of the bulb. And remember, you have to compare for the same life period. These are not different lifetimes. If one bulb lasts 1,000 hours, and the other one last 8,000 hours, you have to use eight of these 1,000-hour bulbs to compare, actually. And cost to own, cost to supply the energy, energy cost, and maintenance costs together will be the lifetime cost.
Review Sheet Lesson 6 – Lighting
- How is lighting measured? Units
- How much light is needed?
- Purpose of lighting (Ambient, Task, Accent lighting)
- Color Rendering Index
- Factors affecting # of lamps required
- Types of lighting – How different forms of light are generated (principles)?
- Incandescence, Fluorescence, and High intensity discharge, Low pressure
sodium
- Incandescence, Fluorescence, and High intensity discharge, Low pressure
- Life cycle cost analysis – Numerical problems
- Efficacy
- Improved lighting controls
- Switches
- Photocells
- Timers
- Motion or Occupancy sensors
- Dimmers
Test Yourself
The questions below are your chance to test and practice your understanding of the content covered in this lesson. In other words, you should be able to answer the following questions if you know the material that was just covered! If you have problems with any of the items, feel free to post your question on the unit message board so your classmates, and/or your instructor, can help you out!
- How is light measured?
- What factors determine the amount of light that is needed in a room?
- What are the three main methods of producing light?
- Explain the difference between incandescence, fluorescence, and high intensity discharge.
- What are the common ways in which we can improve energy efficiency?
- A 60-watt light bulb produces 3 watts of radiant energy and 57 watts of heat energy. What is its efficiency?
- A 100-watt light bulb is left on all day (24 hours). How much did it cost to operate the light bulb if electricity costs 5 cents per kWh?
- A 100 watt incandescent light bulb is operated for 12 hours, and a 15 watt fluorescent light bulb is operated for the same period of time. At 10 cents per kWh, what are the cost savings of the fluorescent bulb?
- Jackie Smith, who is very conscious about the environment, would like to know how much energy she can save by switching to fluorescent bulbs. Estimate the total energy savings for Jackie, who uses a light bulb fixture, by comparing the total costs to own and operate a 23-Watt CFL bulb instead of the 100 Watt incandescent bulb that she has been using. The expected life of incandescent and CFL bulbs is 1000 h and, 8000 hours. The purchase price of an incandescent bulb is \$0.50 and the CFL is \$7.50. If Jackie Smith replaces 24 bulbs at home with CFLs, what would her savings be if the electricity cost is \$0.085 per kWh?
Extra Resources
For more information on topics discussed in Lesson 6, see these selected references:
Lesson 6 Deliverable
Deliverable 1
You must complete a short quiz that covers the reading material in lesson 6. The Lesson 6 Quiz, can be found in the Lesson 6: Lighting module in Canvas. Please refer to the Calendar in Canvas for specific timeframes and due dates.
Lesson 7: Home Heating Basics
The links below provide an outline of the material for this lesson. Be sure to carefully read through the entire lesson before returning to Canvas to submit your assignments.
Introduction
Welcome to Lesson 7!
We are into Lesson Seven now: home heating basics. This is a very interesting and very important chapter. Let me warn you about one thing: this chapter has a lot of calculations, and in the entire course this is the most, I would say, calculation-oriented chapter. So I want you to pay attention to this one.
Basically, if you have a house, you will be losing (or gaining) heat from various places like windows, like the ceiling, the roof, the walls, the doors, through the floor, everywhere. So in this chapter, we will be looking at how much heat transfer occurs and by what means you will be losing or gaining it. Let's say we have this wonderful mansion, and we want to keep the interior at, let's say, 70 degrees all the time. And we have a little furnace that puts out heat and that keeps the interior at 70 degrees even when outside it's, let's say, 10 degrees Fahrenheit. Heat always tends to get out. It can actually go through those solid walls, or if we have windows, it can go through windows or even the roof. And when you open doors and windows, air might leak in and out, so that's another way of losing heat. So there are several ways in which heat is lost to the outside.
How much heat the furnace has to put out to keep the temperature constantly at 70 degrees inside can easily be calculated or known when we know how much heat is escaping. If somehow, ideally, we can seal off this entire place without any heat loss, then once you bring this house to 70 degrees you can turn on the furnace, and it will remain at 70 degrees for the rest of the season. But you and I both know that is not the case. So in this chapter, you're going to learn how much heat is escaping through various surfaces here. And obviously, whatever is escaping, that is the amount of energy that the furnace has to put out. Which means we have to buy energy and put it into the furnace in the form of fuel. So if we are losing a million BTUs like this through all these areas, we have to get a million BTUs made up from this furnace. And we also know that the furnaces are not 100% efficient, either. If we need to get 100,000 BTUs, or 1 million BTUs from the furnace, we cannot expect a furnace to put out if we put in 1 million BTUs. So if we want 1 million BTUs as output, obviously we have to put more in, in the form of fuel. So to know how much fuel we have to put in, we have to know how much heat loss we actually have in the house.
So we will be looking at residential heat loss, how to calculate that, and in what ways we lose heat in this first chapter of Lesson Seven. We will understand the mechanisms of heat transfer and also calculate the heating degree days for a heating season, which is basically the number of degrees that we have to heat our air. If the outside temperature is low, obviously we have to heat our air to a higher temperature or higher number of degrees. That's more degrees of heating. So we will calculate how many degrees we have to heat per day and per season, and so on and so forth. And if we know that, we can calculate the heat loss from a solid wall. That is conduction heat loss. We will talk about conduction, convection, and radiation -- those three mechanisms of heat loss.
And also, once we have a wall, not all walls are the same. Some walls resist more heat loss than the others. So we define a property of a wall, a property of a solid material, that tells us how much the material resists the heat loss. That's called R-value. So we will understand and articulate the concept of R-value here. And we can also increase the R-value of a wall by increasing its thickness or by going to a different material, and so on. And if we were to have a wall with lower R-value, which means lower resistance, we would be losing more heat to the outside. And we would be requiring more heat or more fuel to heat that place. So we'll talk about the cost of various fuels for a given heat loss. Seeing 1 million BTUs that we lose, if we were to heat with natural gas to get that same 1 million BTUs, what would it cost? Or if we use electricity, what would it cost to get 1 million BTUs? Or if we use propane, what would it cost? But the heat loss is always 1 million BTUs. For the same amount of heat loss, which fuel happens to be cheaper fuel or more expensive fuel? That's what we will be determining here.
We will also understand that if we have to install more insulation, we will need to borrow more money. And if we borrow more money and put in more insulation, can we save enough through heat loss to pay back that money that we borrowed? That is payback period. You already know the concept. We will do some calculations to see whether it is wise to borrow money and put more into insulation. All right, that's basically part A here. And we will also look at part B, which is insulation and home heating fuels. And in this part, we will talk about various types of insulation materials and how we can improve a wall's performance by adding more and more layers to that wall. So if we have a wall that has four different materials together, we'll see that, for example, inside we would have drywall that we could paint easily. And behind the drywall we have the framework, like a wooden frame with wooden studs that are used for structural integrity. And between those studs, you always pack some insulation material. And outside the insulation material is not visible because we'll have a plywood or sheathing outside. And even sheathing doesn't look good outside, so on top of that we put a siding, a vinyl siding or brick or whatever it is.
So when we have different materials together, one right behind the other, they will all together resist the heat loss. So we will calculate the heat loss resistivity or R-value of a wall that has different layers of insulation. And if we have that, we can find how much energy we can save or how we can cut the heat loss, et cetera. And also we will talk about the efficiencies, the furnaces, and how we can distribute the heat in the house into various rooms, et cetera, of different heating systems. We'll talk about that later on in the next chapter. So this is basically a calculation-oriented and problem-based kind of chapter or lesson. And if we have any more difficulties in this one, I also added on top of this the practice questions, a bunch of practice problems which explain you how to do numerical problems. For example, I have given here a bunch of problems, actually, using the formulas that we'll be looking at here for practice. There are a bunch of problems -- about 30 problems or so.
Those of you who are comfortable with the material can do these problems yourselves and see if you got them correct by going to this answers page, where the same problems are given with answers. So you can actually look at whether you got the same answer or not. If you got it right, you are happy. If you don't, you may feel lost. If that's the case, what you do is click on this third one here, where for every problem we have a solution, actually, like audio that I'm speaking to you right now. I have made some movies again for each of these problems that will explain to you like a blackboard, or white board rather.
So there are a bunch of problems like this that you can look at. And most of the problems have solutions like this. So I've tried to make your life simpler. Lesson Seven is a two-week lesson, which means you will have a quiz at the end of two weeks after the lesson is assigned. And you take the quiz at the end of the lesson.
Good luck.
Home Heating
Home heating is the single highest energy expense for a household.
- Energy spent for residential space heating accounts for about 10 percent of the total energy consumed in the United States.
- The average household consumes 92 million BTUs, and 46 percent of that is used for home heating.
- According to EnergyStar.gov, average annual energy expenses were $2,060. Home energy use also accounted for 20 percent of the greenhouse gas emissions.
Therefore, reduction of energy consumption in home heating results in substantial monetary savings and reduction in air pollution. With appropriate improvements, average home heating costs can be reduced by 30 percent (i.e., about $500 a year).
| Appliances | Percentage |
|---|---|
| Space Heating | 29% |
| Air Conditioning | 13% |
| Water Heating | 13% |
| Appliances including refrigerator, dish washer and clothes washer | 12% |
| Lighting | 12% |
| Other Electronics | 21% |
Lesson 7 Objectives
Upon completing this lesson, you will be able to:
- understand the mechanisms of heat transfer;
- calculate heating degree days for a heating season and articulate significance of Heating Degree Days (HDD);
- calculate heat loss from a home using conduction equation;
- understand the concept of R-value and its importance in home heating;
- compare the cost of various fuels for a given heat loss;
- understand the significance and be able to calculate the pay-back period.
Questions?
If you have any questions, please post them to the General Course Questions forum in located in the Discussions tab in Canvas. I will check that discussion forum daily to respond. While you are visiting the discussion board, feel free to post your own responses to questions posted by others - this way, you might help a classmate!
Lesson 7a: Residential Heat Loss
Houses are heated to keep the temperature inside at about 65°F when the outside temperature is lower. A house requires heat continuously because of the heat loss. Heat can escape from a house through various places; some are well known and some are not noticeable. Heat can escape from the roof, walls, doors, windows, basement walls, chimney, vents, and even the floor.
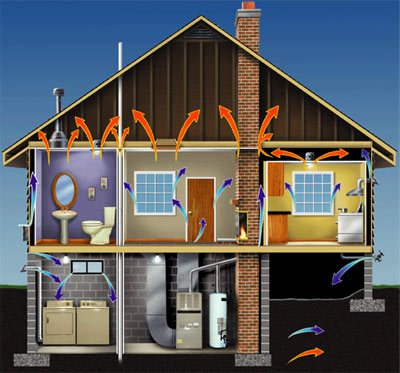
The more heat the house leaks, the more the furnace has to put out to make up for the loss. For the furnace to generate more heat to compensate the heat loss, more fuel needs to be put into the furnace, hence higher fuel or heating costs.

As you will recall from Lesson 3, not all energy conversion devices are efficient. Thus, it is important to note that furnaces are not 100 percent efficient. When a furnace’s efficiency is lower, the fuel consumption for the same amount of heat output will be even higher.
Where Does Heat Loss Occur?
Participate in the following activity to find out where the most heat loss occurs.
- Drag and drop the percentages onto the appropriate area of the home indicating where heat loss occurs.
Where Does Heat Loss Occur?
Below are the most common places for heat loss in a typical home.
- Heat loss through ceilings.
- Heat loss through windows.
- Heat loss through doors.
- Heat loss through frame walls.
- Heat loss through cracks in walls, windows, and doors.
- Heat loss through basement walls.
- Heat loss through basement floor.
Question: Which one has the most heat loss compared to the others?
Answer: # 5 Heat loss through cracks in walls, windows, and doors
Actual percentages of heat loss for each:
- Heat loss through ceilings = 5%
- Heat loss through windows = 16%
- Heat loss through doors = 3%
- Heat loss through frame walls = 17%
- Heat loss through cracks in walls, windows, and doors = 38%
- Heat loss through basement walls = 20%
- Heat loss through basement floor = 1%
Mechanisms of Heat Loss or Transfer
Heat escapes (or transfers) from inside to outside (high temperature to low temperature) by three mechanisms (either individually or in combination) from a home:
- Conduction
- Convection
- Radiation
Click here to open a text description of the examples of heat transfer by conduction, convection, and radiation
- Conduction: heat moving through walls of a home from high temperature inside to low temperature outside.
- Convection: heat circulating within the rooms of a house.
- Radiation: Heat from the sun entering a home.
Conduction
Conduction is a process by which heat is transferred from the hot area of a solid object to the cool area of a solid object by the collisions of particles.
In other words, in solids the atoms or molecules do not have the freedom to move, as liquids or gases do, so the energy is stored in the vibration of atoms. An atom or molecule with more energy transfers energy to an adjacent atom or molecule by physical contact or collision.
In the image below, heat (energy) is conducted from the end of the rod in the candle flame further down to the cooler end of the rod as the vibrations of one molecule are passed to the next; however, there is no movement of energetic atoms or molecules.
Click the play button to start the animation.
Click here to open a text description of the Conduction Candle animation
Example of Conduction
A hand holds a metal rod above a lit candle. The molecules quickly heat up at the point where the flame touches the rod. The heat then spreads across the entire metal rod, and the heat is then able to be felt by the hand.
With regard to residential heating, the heat is transferred by conduction through solids like walls, floors, and the roof.
Click the play button to start the animation.
Click here to open a text description of Conduction in Regard to Residential Heating example
Example of Conduction in Regard to Residential Heating
Picture the cross-section of a wall in a house. Inside the house it is 65°F and outside it is 30°F. Two arrows point from inside the house to the outside to show how heat is transferred from the inside of the house to the outside through the wall via conduction.
Convection
Convection is a process by which heat is transferred from one part of a fluid (liquid or gas) to another by the bulk movement of the fluid itself. Hot regions of a fluid or gas are less dense than cooler regions, so they tend to rise. As the warmer fluids rise, they are replaced by cooler fluid or gases from above.
In the example below, heat (energy) coming from candle flame rises and is replaced by the cool air surrounding it.
Click the play button to start the animation.
Click here to open a text description of the Convection Candle animation
Example of Convection
A hand is held above a lit candle. As the candle heats the air, the heat rises to the hand. Eventually, it gets too hot, and the hand pulls away from the candle.
In residential heating, convection is the mechanism by which heat is lost by warm air leaking to the outside when the doors are opened, or cold air leaking into the house through the cracks or openings in walls, windows, or doors. When cold air comes in contact with the heater in a room, it absorbs the heat and rises. Cold air, being heavy, sinks to the floor and gets heated, and thus slowly heats the whole room air.
Instructions: Press the play button below and observe what happens to the cold air (blue arrows) as it enters the house and encounters the warm air (red arrows) coming from the heating vent:
Click here to open a text description of the Convection in a Room animation
Example of Convection in Regard to Residential Heating
Picture a room with an open door letting in cool air on the left and a radiator creating heat on the right. As the radiator heats the air around it, the air rises and is replaced by cool air. Once the warm air hits the ceiling, it travels left towards the open door, cooling as it moves. The cool air from the open door travels to the right across the floor towards the radiator to be heated. The overall effect is a circular convection current of air within the room.
Radiation
Radiation is the transfer of heat through electromagnetic waves through space. Unlike convection or conduction, where energy from gases, liquids, and solids is transferred by the molecules with or without their physical movement, radiation does not need any medium (molecules or atoms). Energy can be transferred by radiation even in a vacuum.
In the image below, sunlight travels to the earth through space, where there are no gases, solids, or liquids.
Click the play button to start the animation.
Click here to open a text description of the Radiation Example animation
Example of Radiation
Picture the Sun and the Earth, with arrows traveling from the Sun to the Earth through space. The arrows represent the energy that travels to the Earth via radiation, which does not require any medium (atoms or molecules) to do so.
Test Yourself
First, identify the type of home heat loss pictured in images A-J as either: conduction, convection or radiation. Then click and drag each image down to the correct category at the bottom of the screen.
Click here to open a text description of the Test Yourself activity
Test Yourself: Types of Heat Loss
Identify the type of heat loss (conduction, convection, or radiation) for each of the following examples:
- Heat escaping through the roof of a house
- A hot stove burner
- Boiling water
- A torch halogen lamp producing light and heat
- A door hanging wide open, letting in cold air
- A fire creating heat
- Heat escaping through a wall
- A mirror reflecting sunlight
- Heat escaping through a window
- Heat escaping through a chimney
Answers:
A. Conduction
B. Radiation
C. Convection
D. Radiation
E. Convection
F. Radiation
G. Conduction
H. Radiation
I. Conduction
J. Radiation
Reducing Energy Consumption
There are two ways in which we can reduce energy consumption.
- The most cost-effective way is to improve the home’s “envelope”—the walls, windows, doors, roof, and floors that enclose the home—by improving the insulation (conduction losses) and sealing the air leaks with caulking (convection losses).
- The second way to reduce the energy consumption is by improving the efficiency of the furnace that provides the heat.
Click here to open a text description of the Conduction and Convection diagram
Line drawing of a house with arrows pointing out from the walls and roof showing conduction & arrows flowing in a circular motion inside the house showing convection.
Conduction Heat Loss
Main Factors of Heat Loss
What does a house's heat loss depend on? Complete the activity below to find out the three main factors leading to heat loss.
Main Factors of Heat Loss
What are the three main factors a house's heat loss depends on?
Example 1:
House A sits next to house B. Though both houses have the same basic design, house B is significantly larger than house A.
- Which house loses more heat?
- House A
- House B
- Why do you think this house loses more heat?
- More people in it
- More appliances and lights are used
- Larger size/more area
Example 2:
House A and house B are the exact same size and design. House A sits on the beach in a warm, tropical area, while house B sits by a ski resort in the mountains up north, surrounded by snow.
- Which house loses more heat?
- House A
- House B
- Why do you think this house loses more heat?
- People skiing need more heat to keep warm
- Snow on the roof is good insulation
- Outside temperature
Example 3:
House A and house B are the same size and sit next to each other. The design for both houses is the same, except house A has a thick layer of pink insulation installed. The R-value of house B is .63 and the R-value of house A is unknown.
- Which house loses more heat?
- House A
- House B
- Why do you think this house loses more heat?
- Less insulation
- It's only one color
- It's thicker
Answers:
Example 1:
- B: House B
- C: Larger size/more area
Example 2:
- B: House B
- C: Outside temperature
Example 3:
- B: House B
- A: Less insulation
Most heat is lost through a house's walls through conduction. As you learned from the activity on the previous screen, the amount of heat loss depends on three factors:
- Size of the house (area through which the heat can escape)
- Local weather or climatic conditions:
- The inside temperature is often constant at a comfortable temperature of 65°F.
- As the outside temperature falls lower than 65°F, the heat is lost to the outside.
- The higher the temperature difference, the higher the heat loss to outside.
- By calculating the Heating Degree Days (HDD), we can determine how many degrees the mean temperature fell below 65ºF for the day.
- Wall's capacity to resist heat loss.
- Insulation is rated in terms of thermal resistance, called R-value, which indicates the resistance to heat flow.
- The higher the R-value, the greater is the insulating effectiveness.
Heating Degree Days
Local weather or climatic conditions are one of three factors that affects the amount of heat loss through conduction. When examining weather conditions, we look at both the inside and outside temperature of a home.
The inside temperature is usually taken as a standard comfort temperature of 65ºF. The outside temperature varies by the hour. Knowing this information can help us to understand two concepts:
- Average outside temperature = Average of the maximum and minimum temperature during the day
- Heating Degree Day (HDD) = The temperature difference through which air has to be treated, or how many degrees the mean temperature fell below 65ºF for the day. It is also an index of fuel consumption.
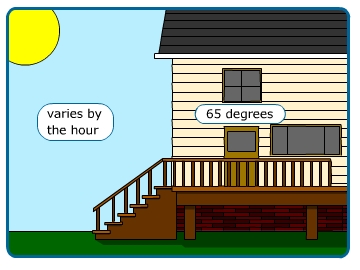
Determining Heating Degree Day (HDD)
The formula for determining the Heating Degree Day (HHD) is:
To calculate HDD:
- Determine the base temperature or inside temperature:
- Find the day's average outside temperature using this formula:
- Use the HDD formula to solve:
Try This!
Click the play button below, and observe the temperature changes. Then calculate the average temperature and the Heating Degree Day.
Click here to open a text description of the Heating Degree Days activity.
Try This: Determining Heating Degree Day (HDD)
Picture a house with a thermometer on the porch. The current outside temperature is 60 degrees. As thick clouds start to move in, the temperature begins to drop in 5 degree increments, first to 55 degrees, then 50 degrees, etc. When the clouds have completely blocked the Sun, the thermometer reads 40 degrees.
Questions:
- What is the average temperature?
Hint: Ta = (max temperature + minimum temperature) divided by 2. - What is the heating degree days?
Hint: HDD = Tbase - Ta
Answers:
- 50 degrees
- 15 degrees
Heating Degree Days Examples
Example 1
Calculate the HDD for one day when the average outside temperature is 13º F.
Calculate the HDD for one day when the average outside temperature is 2º C.
Example 2
Given the following data, calculate the HDD for the week:
| Day | Average Temperature |
|---|---|
| Sunday | 49° F |
| Monday | 47° F |
| Tuesday | 51° F |
| Wednesday | 60° F |
| Thursday | 65° F |
| Friday | 67° F |
| Saturday | 58° F |
Heating Degree Day
For this problem, we need to calculate HDD for one full week. The data that is given is each day, what is the outside temperature -- average outside temperature. For example, Sunday, the average outside temperature is 49 degrees F. Monday 47 degrees Fahrenheit, Tuesday it’s 51 and Wednesday it is 60 degrees F and on Thursday it is 65, Friday, 67 and on Saturday it is 58.
| Day | Temperature (°F) |
|---|---|
| Sunday | 49 |
| Monday | 47 |
| Tuesday | 51 |
| Wednesday | 60 |
| Thursday | 65 |
| Friday | 67 |
| Saturday | 58 |
So we need to calculate heating degree days (HDD) for each day. One day, that is Sunday, the outside temperature is 65 minus 49 the outside temperature will give you the degree days. Similarly, 65 minus 47° Fahrenheit, one day times 65 minus 51 in this case. One day times 65 minus 60 and one day 65 minus 65. This would be zero. One day 65 minus 67. Remember when it exceeds 65, the heating degree days would be zero. In this case, also it is zero. One day on Saturday it is 65 minus 58.
| Day | Temperature (°F) | Calculate HDD |
|---|---|---|
| Sunday | 49 | 1 day (65-49) |
| Monday | 47 | 1 day (65-47) |
| Tuesday | 51 | 1 day (65-51) |
| Wednesday | 60 | 1 day (65-60) |
| Thursday | 65 | 1 day (65-65)=0 |
| Friday | 67 | 1 day (65-67)=0 |
| Saturday | 58 | 1 day (65-58) |
This case it is 7.
| Day | Temperature (°F) | Calculate HDD |
|---|---|---|
| Sunday | 49 | 1 day (65-49)=16 |
| Monday | 47 | 1 day (65-47)=18 |
| Tuesday | 51 | 1 day (65-51)=14 |
| Wednesday | 60 | 1 day (65-60)=5 |
| Thursday | 65 | 1 day (65-65)=0 |
| Friday | 67 | 1 day (65-67)=0 |
| Saturday | 58 | 1 day (65-58)=7 |
These two are zeros, this is 5 and this is 14 and this happens to be 18 and here it is 16. So the total sum is for one full week is 60 degree days.
| Day | Temperature (°F) | Calculate HDD |
|---|---|---|
| Sunday | 49 | 1 day (65-49)=16 |
| Monday | 47 | 1 day (65-47)=18 |
| Tuesday | 51 | 1 day (65-51)=14 |
| Wednesday | 60 | 1 day (65-60)=5 |
| Thursday | 65 | 1 day (65-65)=0 |
| Friday | 67 | 1 day (65-67)=0 |
| Saturday | 58 | 1 day (65-58)=7 |
| Total | 60 Degrees |
This is equal to 60 degree days.
Seasonal Heating Degree Days
In previous examples, we are assuming that the outside temperature remains the same for all 150 heating days in a season. This is not realistic, but it explains the method to calculate the HDD. In a more realistic example, we need to find the temperature difference for each day and add all the temperature differences.
We will now look at Seasonal Heating Degree Days (HDD), which is the sum of temperature differences of ALL days - rather than just 1 day or 1 week - during which heating is required.
The table below provides Seasonal HDDs for selected places in the United States. The higher HDD indicates a higher heat loss and therefore, higher fuel requirements.
HDD is used to estimate the amount of energy required for residential space heating during a cool season, and the data are published in local newspapers or on the National Weather Service website.
| Place | Degree Days |
|---|---|
| Birmingham, AL | 2,823 |
| Anchorage, AK | 10,470 |
| Barrow, AK | 19,893 |
| Tucson, AZ | 1,578 |
| Miami, FL | 155 |
| Pittsburgh, PA | 5,829 |
| State College, PA | 6,345 |
Source: NOAA
Calculating Seasonal Heating Degree Days
To calculate Seasonal Heating Degree Days, use this formula:
Remember, in months where the average temperature is equal to or greater than 65, there will be no heating degree days, so the value for the month will be 0.
Seasonal Heating Degree Days Examples
Example 1
Given the following set of average temperatures, by month, for State College, PA, calculate the HDD for the heating season:
| Jan. | Feb. | Mar. | Apr. | May | Jun. | Jul. | Aug. | Sep. | Oct. | Nov. | Dec. |
|---|---|---|---|---|---|---|---|---|---|---|---|
| 25°F | 28°F | 37°F | 48°F | 59°F | 67°F | 71°F | 70°F | 62°F | 51°F | 41°F | 31°F |
Please watch the following (2:32) presentation about problem #1:
Lesson 7a, Screen 23: Seasonal Heating Degree Days
Example 3
Given the following set of average temperatures, by month, for State College, PA, calculate the HDD for the heating season:
| Jan | Feb | Mar | Apr | May | Jun | July | Aug | Sep | Oct | Nov | Dec |
|---|---|---|---|---|---|---|---|---|---|---|---|
| 25 °F | 28 °F | 37 °F | 48 °F | 59 °F | 67 °F | 71 °F | 70 °F | 62 °F | 51 °F | 41 °F | 31 °F |
Alright, this is an interesting problem. Given the following temperatures by month for State College, we need to calculate the heating degree days for the entire season. For January, the outside temperature is 25° F. This is average temperature for 31 days in January. And February, the outside temperature is 28° F, March, 37° F and April it is 48° F and May, the temperature outside is 59° F. June, the outside temperature is 67° F, July, the outside temperature is 71° F and August it is 70° F. September, it goes on like that. September it is 62° F, and October it is 51° F, November, 41° F and December goes as 31° F.
What we need to do is basically subtract this number (25° F) from 65 so the difference is, 65 minus 25, so this is 40° F for the month of January.
The same case here (February). 65 minus 28 which happens to be 37° F.
And if we do the same for all these months, from March through December, and then we have to multiply each month temperature difference by the number of days in the month.
So, for example, in the case of January, there are 31 days. So when you multiply 40◦ by 31 days you get 1240 degree days.
Similarly, we can do for all these months and add up and it turns out that for the entire year, it is 6138 degree days is for State College.
Example 2
If Ms. S. Belle moves from Birmingham, AL (HDD=2,800) to State College, PA (HDD=6,000) how much can she expect her heating bill to increase?
Please watch the following 1:34 presentation about problem #2:
Lesson 7a, Screen 24: Seasonal Heating Degree Days
Example 4
If Ms. S. Belle moves from Birmingham, AL (HDD = 2,800) to State College, PA (HDD=6,000) how much can she expect her heating bill to increase?
Alright, this is problem 1.6, if Ms. S. Belle moves from Birmingham, AL to State College, how much can she expect her heating bill to increase?
Birmingham, AL has heating degree days of 2800 and State College, PA has 6000. We need to remember this 6000 degree days. Basically what’s happening here is she is going to be heating more her home and it is increasing from 2800 to 6000. So, her increase is 6000 minus 2800 will be 3200 degree days.
And this increase (3200) is how much compared to 2800 what she has been paying for. So the increase is 3200 compared to the baseline of 2800. We need to multiply this by 100 to get the percentage. It would be an increase of 114 %.
She would be spending about 114% more for her heating in State College, PA.
Calculating Hourly Heat Loss
As we have learned, most heat is lost through a house's walls through conduction. One of the three factors that affect heat loss is a wall's capacity to resist heat loss.
We will now look at how to calculate the rate of heat loss of the walls of a house, using the following formula:
From the above equation, it can be seen that once the house is built, these two variables will NOT change:
- The area of the walls
- The R-value of the walls
The only variable that will change is the temperature difference between inside and outside.
Example
Calculate the heat loss for a 10 ft by 8 ft wall, insulated to R-value 22. The inside temperature is maintained at 70° F. The temperature outside is 43° F.
Please watch the following 2:25 presentation about Hourly Heat Loss:
Lesson 7a, Screen 26: Calculating Hourly Heat Loss
Example 5
Calculate the heat loss for a 10 ft by 8 ft wall, insulated to R-value 22. The inside temperature is maintained at 70°F. The temperature outside is 43°F.
For this problem, we are trying to calculate the heat loss. We are given the dimensions; we are given the R-value and the temperature difference. Those are the quantities that we need to calculate the heat loss, basically.
The dimensions are, the wall dimensions are 8ft and this side is 10 ft.
So the area is 8 times 10 will be 80 foot square or 80 square feet. And we are also given the inside temperature is 70°F and outside temperature, average outside temperature, is 43°F. Therefore, the difference or delta T (ΔT) is equal to 27°F.
Now area is given, A is, we already calculated 80ft2 and R-value is also given as 22 which is 22 ft2 °F hour over BTU.
Now, heat loss, BTUs per hour, is equal to area times ΔT divided by R-value.
Now in this case, it is:
So this will be equal to, here you can cancel ft2 and this ft2 and this °F and this °F, and we are left with BTUs per hour. And the heat loss comes out to be 98.2 BTU/h.
Calculating Daily Heat Loss
Now that you know how to calculate hourly heat loss, how would you calculate daily heat loss?
Since there are 24 hours in a day, you would simply multiply the hourly heat loss by 24.
Example
What is the hourly and daily heat loss of a 15-ft by 15-ft room with an 8-ft ceiling, with all surfaces insulated to R13, with inside temperature 65°F and outside temperature 25°F?
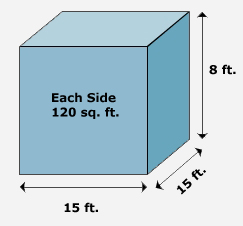
Once we know the heat loss rate per hour, we can determine the heat loss per day by multiplying by 24 (hours in a day).
In a 24-hour period or one day, the heat loss would be:
Area (ft2) is the sum of the area of all four walls. Each wall is 8' x 15', or 120 sq. feet, so take 4 x 120 sq ft to get 480 ft2 in the equation.
Calculating Annual Heat Loss
In the previous calculations, we determined hourly and daily heat loss. How do we calculate annual or seasonal heat loss?
Since the temperature outside the house may not remain the same day after day, the heat loss will vary by the day. Thus, to obtain the heat loss for a whole year, we do the following:
- Calculate heat loss for each day.
- Add the heat loss for all days in a year that needed heating.
- Leave the R-value of the wall and the area of the wall the same – they will not change.
- Determine the difference between inside and outside temperature, since it will change for each day.
Recall that the formula for daily heat loss is:
Thus, theoretically, we would need to perform this calculation for every day of the 365-day calendar year.
For example, if the average outside temperature were to be 35°F, 32°F, 28°F, and so on for each day, the heat loss for the whole year or the season can be calculated as follows:
Since the area (480 ft2), R-value ,and 24 h in a day are common for ALL heating days, we can bring those out and rewrite the equation as:
This equation can be even further simplified. The formula for Annual or Seasonal heat loss can be written in general terms as:
Calculating Annual Heat Loss Examples
Example 1
Please watch the following 3:29 presentation on Example Problem #1. For the 150-day heating season in Roanoke, VA, the average temperature was 47° F. How much heat is lost through a 176 ft2 wall (R=16) during the entire season?
Lesson 7a, Screen 32: Calculating Annual or Seasonal Heat Loss
Example 7 (formerly Example 3-11)
For the 150-day heating season in Roanoke, VA, the average temperature was 47°F.
How much heat is lost through a 176 ft2 wall (R=16) during the entire season?
Ok. In this problem, 3-11, we are trying to calculate the heat loss for a 150-day season in Roanoke, VA. It is a 150-day heating season. The outside temperature is given as 47°F. Inside, is obviously 65°F. Ok?
Outside: 47°F
Inside: 65°F
Degree Days can be calculated like this. Heating Degree Days are equal to the number of days, which is 150 in a season here, times the temperature difference. 65 minus 47°F.
Now we can calculate that. That is equal to 150 days times 18. So that turns out to be 2700 °F days.
Now, what else do we need? We need the area. Area is given. Area is equal to 176 ft2, and we are also given the R-value. R-value is 16.
Therefore, we can calculate the heat loss, heat loss through a season. Heat loss through the season is equal to Area times HDD times 24 over R.
Now, what can we cancel? ft2/ ft2, °F/°F, hour/hour and days/days are canceled. So when we do this calculation here, we get the answer of 712,800 Btus in this 150 day heating season.
Example 2
Please watch the following 3:42 presentation on Example Problem #2. In Fargo, ND, the heating season lasts about 220 days and the average outside temperature is around 27° F. How much heat is lost through an 8 ft by 6 ft window (R=1) during the heating season?
Lesson 7a, Screen 33: Calculating annual or Seasonal Heat Loss
Example 8 (formerly example 3-12)
In Fargo, ND, the heating season lasts about 220 days and the average outside temperature is around 27°F. How much heat is lost through an 8 ft by 6 ft window (R=1) during the heating season?
This problem is very similar to the last one, 3-11. Now this 3-12 involves again heat loss through a season. We need to calculate the HDD’s. The heating days are 220 days. Now the temperature difference is, inside, 65°F as usual and outside, the temperature, the average temperature happens to be 27°F for all 220 days. Therefore, Heating Degree Days (HDD) can be calculated like this: 220 days times (65°F minus 27°F). And this is equal to 220 days times 38°F which is equal to 8,360°F days.
Now, do we know the area? Area is given, actually. The dimensions of the window are 8ft by 6ft. Therefore the area is 8ft times 6ft, which is 48ft2
We know the temperature difference, we know the HDD, and we can calculate the heat loss provided we have the R value. R-value is also given. 1 ft2 °F h over BTU.
Now it is easy to calculate heat loss. Heat loss for the season is equal to area (and I am trying to repeat this), area times HDD times 24 over R. So in this case it is, area is 48 ft2 and we have 8360 degree days times 24 hours divided by a day over R value of 1 ft2 °F h/BTU.
So ft2/ft2, °F/°F will be canceled, hours and hours are canceled, days and days are canceled here.
So, when you do this math, it comes out to be 9,630,720 BTUs. This is in one full season.
Lesson 7b: Insulation and Home Heating Fuels
The following section of Lesson 7 wil discuss insulation and home heating fuels.
R-Value
As you may recall from the first part of this lesson, R-value is a wall's capacity to resist heat loss or its thermal resistance. Insulation materials are rated in terms of their R-value, with a higher R-value indicating better insulating effectiveness.
The R-value of thermal insulation depends on the type of material, its thickness, and its density. Generally, walls are not made up of just one material or one layer.
R-values for most commonly used building materials are given in the table below. From looking at the table below, we can see that natural materials like stone and bricks are not good insulation materials, but most of the synthetic insulation products such as polystyrene or polyurethane are very effective insulation materials.
| Material | R-Value (ft2 o F h / BTU) |
|---|---|
| Plain glass, 1/8 inch | 0.03 |
| Stone per inch | 0.08 |
| Common Brick per inch | 0.20 |
| Asphalt Roof Shingles | 0.44 |
| 1/2 inch Gypsum Board (Drywall or plasterboard) | 0.45 |
| Wood Siding, 1/2 inch | 0.81 |
| Plywood, 3/4 inch | 0.94 |
| Insulating sheathing, 3/4 inch | 2.06 |
| Fiberglass, per inch (battens) | 3.50 |
| Polystyrene per inch | 5.00 |
| Polyurethane Board | 6.25 |
If insulation materials have a low R-value per inch, then they will need to be thicker than those materials with a higher R-value per inch to achieve the same degree of effectiveness in resisting heat loss.
Look at the chart below to compare the thickness required of various insulation materials to achieve the same R-Value of 22 and then answer the questions below.
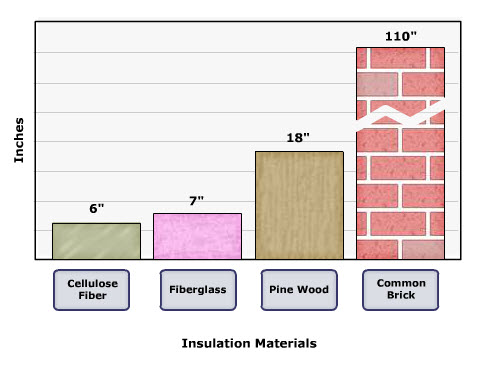
Types of Insulation
Look at the table below to learn about six types of insulation.
| Insulation | What is it made of? | What does it look like? | Additional Information |
|---|---|---|---|
Fiberglass
 |
Molten glass spun into microfibers | Pink or yellow in the form of batts or rolled blankets. | |
Rock Wool
 |
Rock | Gray or brown fibers in batts or blankets or as shredded loose-fill. | Manufactured in a similar way as fiberglass, but with molten rock instead of glass. |
Cellulose
 |
Recycled paper – newsprint or cardboard shredded into small bits of fiber. | Blown in as loose fill. | It is treated with fire- and insect-resistant chemicals. |
Rigid Foam
 |
Different types, but some made from post-consumer recycled content from fast food containers and cups. | Rigid sheets that are applied directly to framing. | Best where space is limited, but a high R-value is needed. Can be installed on the interior of a wall, but if installed inside, must be covered by a fire resistant material like wallboard. One drawback to foam is it deteriorates unless it is protected from prolonged exposure to sunlight and water. It is also more expensive than other insulation. |
Synthetic Insulation
 |
Usually polystyrene or polyurethane foam. | Polystyrene comes as rigid boards, and Polyurethane comes as rigid boards or sprayed in place systems. | Polystyrene is used for insulating basements, cathedral ceilings, or sidewalls. Polyurethane foams are high performance insulating materials. |
Composite Wall R-Values
Generally, walls are made up of several layers of different materials. The R-value of a composite wall is calculated by adding the effective R-values of each of the layers of the wall.
For example, the image below shows a wall made up of four layers—½ inch drywall inside for aesthetic purposes, real insulation in between the studs, ¾ inch plywood sheathing outside, and wood siding as the final exterior finish. Together, the layers of the wall are preventing heat loss.
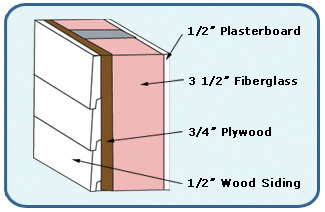
We can calculate this wall’s composite R-value by adding the R-values of each layer.
Plasterboard (1/2 inch)
+ Fiberglass (3.5 inches @ 3.70 per inch)
+ Plywood (3/4 inches)
+ Wood Siding (1/2 inch)
-----------------------------------------
Total R-Value of Composite Wall
We can find the R-values for the walls by using the table from the page about R-Values (the table is repeated below):
| Material | R-Value (ft2 o Fh / BTU) |
|---|---|
| Plain glass, 1/8 inch | 0.03 |
| Stone per inch | 0.08 |
| Common Brick per inch | 0.20 |
| Asphalt Roof Shingles | 0.44 |
| 1/2 inch Gypsum Board (Drywall or plasterboard) | 0.45 |
| Wood Siding, 1/2 inch | 0.81 |
| Plywood, 3/4 inch | 0.94 |
| Insulating sheathing, 3/4 inch | 2.06 |
| Fiberglass, per inch (battens) | 3.50 |
| Polystyrene per inch | 5.00 |
| Polyurethane Board per inch | 6.25 |
| Cinder Block (12 inches) | 1.89 |
Plasterboard (1/2 inch) = 0.4524
+ Fiberglass (3.5 inches @ 3.70 per inch) = 12.95
+ Plywood (3/4 inches) = 0.94
+ Wood Siding (1/2 inch) = 0.81
-----------------------------------------
Total R-Value of Composite Wall = 15.15
Examples
Example 1
A ceiling is insulated with 0.75" plywood, 2" of polystyrene board, and a 3" layer of fiberglass. What is the R-Value for the ceiling?
Solution:
The ceiling consists of three layers, and all three layers together prevent the heat loss. So, we need to add the R-values of all three layers
" of plywood has an R-value of 0.94
2" of polystyrene at 5.0 per inch will have an R-value of 10.00
3" of fiberglass at 3.7 per inch will have an R-value of 11.10
So the R-value of the ceiling is 22.04 ft2 oFh / BTU.
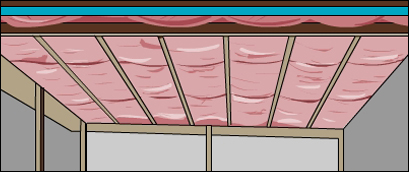
Example 2
Please watch the following 1:31 video presentation about Example #2. A wall consists of 0.5” wood siding (R = 0.81), 0.75” plywood (R = 0.94), 3.5” of fiberglass (R = 13.0), and 0.5” plasterboard (R = 0.45). What is the composite R-value of the wall?
Lesson 7b, Screen 7: Composite Wall R-Values
Example 10
This problem, we need to calculate composite R-value.
The wall consists of four layers. One half inch wood siding, and its R-value is given straight away for half inch as .81. And we have three-quarter inch plywood and this plywood’s R-value is also given as .94, this is for 3/4". Whereas the fiberglass, each inch has an R-value of 3.7. We are using 3 and a half inches. So, 3.5 times 3.7 would give us about 13.00 R-value. And the last layer would be one half inch plaster board which is also drywall and its R-value is given as .45.
1/2" wood siding: 0.81
3/4" plywood: 0.94
3 1/2 Fiberglass (3.7/inch): 13.00
1/2" plaster board: 0.45
Total: 15.2
So when you add these up you get 15.2 which means the composite R-value of this wall is 15.2 degrees F, foot squared, hour over BTUs.
Example 3
Please watch the following 1:18 video presentation about Example #3. What is the R-value of a wall that is made up of wood siding (R = 0.81), 5” of fiberglass (R = 3.70 per inch), and a layer of 0.5” drywall (R = 0.45)?
Lesson 7b, Screen 8: Composite Wall R-Values
Example 11
What is the R-value of a wall that is made up of wood siding (R= 0.81), 5” of fiberglass (R=3.70 per inch), and a layer of .5” drywall (R=0.45)?
Here we have, again a wall made up of three different layers. The first layer is wood siding which is outside, obviously, and its R-value is given as 0.81, whatever the thickness might be of that wood siding. And we have a second layer of fiberglass. And this fiberglass thickness is given as 5” and its R-value is given as 3.7 per inch. So we are using 5 inches so 5 times 3.7 would be 18.50. And we have a third layer of a drywall and this drywall has an R-value of 0.45, half inch drywall.
Wood siding: 0.81
5" fiberglass 3.7/inch: 18.50 (5x3.7)
Drywall: 0.45
Total R-value: 19.76
When you add all these three layers up, you get a total R-value of 19.76.
So the answer is 19.76 degrees F, foot squared, hour over BTUs. This is the composite R-value.
Example 4
Please watch the following 1:44 video presentation about Example #4. A wall is made up of 8” of stone, 3” of polyurethane board, and 0.75” of plywood. Calculate the composite R-value for the wall.
Lesson 7b, Screen 9: Composite Wall R-Values
Example 12
A wall is made up of 8” of stone, 3” of polyurethane board, and 0.75” of plywood. Calculate the composite R-value for the wall.
This is a problem where we have three layers for a wall and those three layers are made up of stone, polyurethane board and plywood. The first one is stone and its thickness is 8” and each inch of stone wall will provide an R-value of 0.08. Therefore, all these 8” together would provide 0.64. And the second layer is made up of 3” of polyurethane and each inch provides an R-value of 6.25, therefore, together, all 3” would provide an R-value of 18.75. The third layer is again three quarters inch plywood, and it provides an R-value of 0.94. So all these three together would have an R-value of 20.33 or the composite R-value is 20.33 degree F, foot squared, hour over BTUs.
8" stone (0.08/inch): 0.64
3" polyurethane (6.25/inch): 18.75
0.75" plywood: 0.94
Total: 20.33
Insulation Needs By Region
The United States map below shows insulation needs by region, as indicated by color and numbers.
Instructions: Click on the “zone” buttons below the map to see the U.S. Department of Energy’s Recommended Total R-Values for new construction of houses. Note that insulation R-values are different for the ceilings, walls, floor, etc.
U.S. Department of Energy recommended total R-Values for new construction houses, by regions and by various parts of the house.
Insulation Needs by Region
The U.S. Department of Energy released recommended total R-values for new construction houses. The info is based on regional zone and covers various parts of the house. The states within each zone are listed below, followed by a data table containing the R-values for each part of the house. The R-values are dependent on the type of heating system being used and may vary for each. Some states may lie in multiple zones.
Zone 1
States:
- Florida
| Zone 1 | Gas Heat Pump Fuel Oil |
Electric Furnace |
|---|---|---|
| Attic | R-49 | R-49 |
| Cathedral Ceiling | R-38 | R-60 |
| Wall | R-18 | R-28 |
| Floor | R-25 | R-25 |
| Crawl Space | R-19 | R-19 |
| Slab Edge | R-8 | R-8 |
| Basement Interior | R-11 | R-19 |
| Basement Exterior | R-10 | R-15 |
Zone 2
States:
- California
- Arizona
- Texas
- Louisiana
- Mississippi
- Alabama
- Florida
- Georgis
| Zone 2 | Gas Heat Pump Fuel Oil |
Electric Furnace |
|---|---|---|
| Attic | R-49 | R-49 |
| Cathedral Ceiling | R-38 | R-38 |
| Wall | R-18 | R-22 |
| Floor | R-25 | R-25 |
| Crawl Space | R-19 | R-19 |
| Slab Edge | R-8 | R-8 |
| Basement Interior | R-11 | R-19 |
| Basement Exterior | R-10 | R-15 |
Zone 3
States:
- North Carolina
- South Carolina
- Georgia
- Alabama
- Mississippi
- Tennessee
- Louisiana
- Arkansas
- Oklahoma
- Texas
- New Mexico
- Arizona
- Utah
- New Mexico
- Nevada
- California
- Alaska
| Zone 3 | Gas Heat Pump Fuel Oil Electric Furnace |
|---|---|
| Attic | R-49 |
| Cathedral Ceiling | R-38 |
| Wall | R-18 |
| Floor | R-25 |
| Crawl Space | R-19 |
| Slab Edge | R-8 |
| Basement Interior | R-11 |
| Basement Exterior | R-10 |
Zone 4
States:
- New York
- New Jersey
- Maryland
- Delaware
- Virginia
- Pennsylvania
- West Virginia
- Ohio
- Indiana
- Illinois
- Kentucky
- Tennessee
- North Carolina
- Georgia
- Arkansas
- Missouri
- Kansas
- Oklahoma
- Colorado
- Texas
- New Mexico
- Arizona
- California
- Oregon
- Washington
| Zone 4 | Gas Heat Pump Fuel Oil |
Electric Furnace |
|---|---|---|
| Attic | R-38 | R-49 |
| Cathedral Ceiling | R-38 | R-38 |
| Wall | R-13 | R-18 |
| Floor | R-13 | R-25 |
| Crawl Space | R-19 | R-19 |
| Slab Edge | R-4 | R-8 |
| Basement Interior | R-11 | R-11 |
| Basement Exterior | R-4 | R-10 |
Zone 5
States:
- Washington
- Oregon
- Idaho
- California
- Nevada
- Utah
- Colorado
- Arizona
- New Mexico
- Wyoming
- South Dakota
- Nebraska
- Kansas
- Iowa
- Missouri
- Illinois
- Michigan
- Indiana
- Ohio
- Pennsylvania
- New York
- West Virginia
- Maryland
- New Jersey
- New Hampshire
- Massachusetts
- Rhode Island
- Connecticut
| Zone 5 | Gas | Heat Pump Fuel Oil |
Electric Furnace |
|---|---|---|---|
| Attic | R-38 | R-38 | R-49 |
| Cathedral Ceiling | R-30 | R-38 | R-38 |
| Wall | R-13 | R-13 | R-18 |
| Floor | R-11 | R-13 | R-25 |
| Crawl Space | R-13 | R-19 | R-19 |
| Slab Edge | R-4 | R-4 | R-8 |
| Basement Interior | R-11 | R-11 | R-11 |
| Basement Exterior | R-4 | R-4 | R-10 |
Zone 6
States:
- California
- Washington
- Idaho
- Wyoming
- Montana
- Utah
- Colorado
- North Dakota
- South Dakota
- Minnesota
- Iowa
- Wisconsin
- Michigan
- New York
- Pennsylvania
- Vermont
- New Hampshire
- Maine
| Zone 6 | Gas | Heat Pump Fuel Oil |
Electric Furnace |
|---|---|---|---|
| Attic | R-22 | R-38 | R-49 |
| Cathedral Ceiling | R-22 | R-30 | R-38 |
| Wall | R-11 | R-13 | R-18 |
| Floor | R-11 | R-11 | R-25 |
| Crawl Space | R-11 | R-13 | R-19 |
| Slab Edge | (c) | R-4 | R-8 |
| Basement Interior | R-11 | R-11 | R-11 |
| Basement Exterior | R-4 | R-4 | R-10 |
Calculating Wall Heat Loss
Heat loss from the surface of a wall can be calculated by using any one of the three formulas we have covered in Part A of this Lesson.
Equations
The heat loss in an hour equation
The heat loss in a day equation
The heat loss in full heating season
The heat loss from walls, windows, roof, and flooring should be calculated separately, because of different R-Values for each of these surfaces. If the R-value of walls and the roof is the same, the sum of the areas of the walls and the roof can be used with a single R-value.
Example
A house in Denver, CO has 580 ft2 of windows (R = 1), 1920 ft2 of walls and 2750 ft2 of roof (R = 22). The walls are made up of wood siding (R = 0.81), 0.75” plywood, 3.5” of fiberglass insulation, 1.0” of polyurethane board, and 0.5” gypsum board. Calculate the heating requirement for the house for the heating season, given that the HDD for Denver is 6,100.
Solution:
Heating requirement of the house = Heat loss from the house in the whole year. To calculate the heat loss from the whole house, we need to calculate the heat loss from the walls, windows, and roof separately, and add all the heat losses.
Heat loss from the walls:
Area of the walls = 1,920 ft2, HDD = 6,100, and the composite R- value of the wall needs to be calculated.
| Material | R-Value |
|---|---|
| Wood Siding | 0.81 |
| 3/4 inch plywood | 0.94 |
| 3.5 inches of fiberglass 3.5 in x 3.7 / in | 12.95 |
| 1.0 inch of polyurethane board = 1.0 in x 5.25 / in | 5.25 |
| 1/2 inch Gypsum board | 0.45 |
| Total R-Value of the walls | 20.40 |
Total heat loss from the house = 13.78 + 84.91 + 18.30 =116.99 MMBTU in a year or heating requirement is 116.99 million BTUs per year.
Calculating Wall Heat Loss Example Problems
Example #1
Please watch the following 4:58 presentation about Example #1. A house in State College, PA has 580 ft2 of windows (R = 1), 1920 ft2 of walls, and 2750 ft2 of roof (R = 22). The walls are made up of wood siding (R = 0.81), 0.75” plywood, 3” of fiberglass insulation, 1.5” of polyurethane board, and 0.5” gypsum board. Calculate the heating requirement for the house for the heating season.
Lesson 7b, Screen 14: Calculation of Wall Heat Loss
Example 15 (formerly Example 3-14)
A house in State College, PA has 580 ft2 of windows (R=1), 1920 ft2 of walls, and 2750 ft2 of roof (R=22). The walls are made up of wood siding (R=0.81), 0.75” plywood, 3” of fiberglass insulation, 1.5” of polyurethane board, and 0.5” gypsum board. Calculate the heating requirement for the house for the heating season.
Here in this problem, we are trying to calculate the heat loss from the entire house. Heat loss through windows, heat loss through roof, heat loss through walls and add them up. We can directly calculate heat loss through windows. Area is given as 580 ft2, R-value is given as 1 and HDD for State College is 6000 degree F days (°F days). So heat loss for the season is equal to 580 ft2 times 6000 °F days times 24 hours in a day divided by 1 R-value (ft2 (°F hour/BTU). So we can cancel these and the heat loss through windows is 83,520,000 BTUs.
Windows
Similarly, we can calculate heat loss through the roof. And area of the roof is given as 2750 ft2 times 6000 °F days times 24 hours over a day divided by 22 ft2 °F hour over BTU. Now, when you do this calculation, we lose about 18 million BTUs through the roof.
Heat Loss Season
Heat Loss Roof
For the wall heat loss, we need to calculate the composite R-value because we are not given the R-value straight away, and we are given the area. So, let’s calculate the composite R-value. The first layer is wood siding, and wood siding is 0.81 in R- value and the next layer is ¾” plywood and whose R-value is 0.94. And we got 3” of fiberglass and each inch provides an R-value of 3.7 therefore 3” would be 11.10, and we have another 1 ½ of polyurethane which has 6.25 per inch R-value therefore 1.5” would provide an R-value of 9.375. At the end or inside, we have ½” drywall whose R-value is 0.45. So together, all these layers would provide an R-value of 22.7.
Wood siding = 0.81
¾ “ plywood = 0.94
3” fiberglass = 11.10
1.5” polyurethane = 9.375
.5” dry wall = 0.45
Total = 22.7
So, heat loss now can be calculated. We know the area that is 1920 ft2 given and same 6000 °F days times 24 hours per day divided by 22.67 and this comes out to be 12,119,164 BTUs.
So when you add all these three heat losses, the total heat loss is equal to 113,753,164 BTUs per heating season.
Example #2
Please watch the following 9:00 presentation about Example #2. A single-story house in Anchorage, AK (HDD = 11,000) is 50 ft by 70 ft with an 8 ft high ceiling. There are six windows (R = 1) of identical size, 4 ft wide by 6 ft high. The roof is insulated to R-30. The walls consist of a layer of wood siding (R = 0.81), 2” of polyurethane board (R = 6.25 per inch), 4” of fiberglass (R = 3.70 per inch), and a layer of drywall (R = 0.45). Calculate the heat loss through the house (not counting the floor) for the season. (A good estimate for the area of the roof is 1.1 times the area of the walls, before you subtract out the area for the windows.)
Wall Heat Loss #3
Problem
[ON SCREEN TEXT]: A single-story house in Anchorage, AK (HDD = 11,000) is 50 ft by 70 ft with an 8 ft high ceiling. There are six windows (R = 1) of identical size, 4 ft wide by 6 ft high. The roof is insulated to R-30. The walls consist of a layer of wood siding (R = 0.81), 2” of polyurethane board (R = 6.25 per inch), 4” of fiberglass (R = 3.70 per inch), and a layer of drywall (R = 0.45). Calculate the heat loss through the house (not counting the floor) for the season. (A good estimate for the area of the roof is 1.1 times the area of the walls, before you subtract out the area for the windows.)
SARMA PISUPATI: OK, for this problem, 3.15. We do, more or less, the same thing as the last house, except this house is in Anchorage, Alaska, where HDD happens to be 11,000 degree days. OK. Now we have to calculate here, heat loss through windows, through walls, and through roof, to calculate the total heat loss from the house, the same way that we have done before.
Heat loss through windows. We need the area of the windows first. So area of windows equal to-- Each window is 4 feet by 6 feet. So this is 24 square feet. So we have six of them, so the total area is 144 square feet. So heat loss equal to 144 feet square times HDDs 11,000 degree days times 24 hours in a day, and divided by r value, r value happens to be 1. So 1 feet square, degrees Fahrenheit, hour over BTU.
So you could cancel out some of these. We'll get BTUs heat loss. This is in a year. OK. So we would get this one to be approximately 38 million. 38,016,000 BTUs. This is per season or per year. OK. Now the second thing that we have to do is walls.
Here we have to calculate the area and also the r value. r value because it is a composite wall consisting of four layers. It has wood siding, which has an r value of 0.81 and 2 inches of polyurethane. And 2 times 6.25, so that is 12.5 r value. And we have a third layer, 4 inches of fiberglass. 4 inches times 3.7, that's equal to 14.8.
And then we also have 1/2 inch drywall. And we know that the drywall r value is straight away 0.45, so now the total r value of this wall happens to be 28.56. OK. Now we have to calculate the area of the walls. Area of the walls we can calculate.
Let me draw a little picture here and show you. If we have-- Let's say this is the area, and we have-- and this side is about 70, this side is 50. And we will have under there, 50 this side, and 70 this side. So total times this height is 8 feet. So the total area would be 2 times 120. 120 is 70 plus 50 times 2, because twice these values, times 8 feet is the height. So we get about 1,920 feet square.
Of course, this also has some windows, about six windows as we originally looked at, but at this point, we will take this as 1920 and subtracting windows from this. Windows is 144 feet square, so 1920 minus 144, would give us 1776 feet square.
OK, so now we have to calculate the area of-- Now, if we calculate the area of 1776 feet square times 11,000 times, this is degrees Fahrenheit days, times 24 hours per day, divided by-- we have 28.56. So the heat loss, in here, comes out to be 16,416,806 BTUs per year.
OK, now we have to calculate roof. Roof happens to be 1.1 times the area of the walls. Area of the walls was 1920 feet square. Again, we have to take this without the windows, actual area of the walls, times 1.1, that happens to be 2112 feet square.
So heat loss 2112 feet square times 11,000 times 24, divided by-- r value of this is 30-- degrees Fahrenheit, feet square, hour, over BTU. So this comes out to be 18,585,600 BTUs per year.
So the total heat loss now, would be the addition of all these three together. So that is, first we have, how much? If we look at, we have 38,016,000, so 38,016,000 plus 16,416,806 plus 18,585,600, so that is equal to 73, 019,000 BTUs. So that is the total heat loss from the house.
Fuel Choices
Various fuels such as natural gas, electricity, fuel oil, and so on, are used to heat a house. Click on the graph below to see the percent of households that use each type of heating fuel.
| Fuel Type | Percentage used |
|---|---|
| Natural Gas | 49% |
| Electricity | 34% |
| Fuel Oil / LPG | 11% |
| Other | 6% |
As you see, about 50 percent of the households in the United States use natural gas as their main heating fuel, and about 35 percent of the households use electricity to heat their homes. Another 11% use fuel oil, and the last 6% use something other than natural gas, electricity, and fuel oil.
Capacity and Consumption
Capacity
The amount of heat a furnace can deliver is called its capacity. Heating units are manufactured and sold by their capacity. The heating capacities of Natural Gas, Propane and Fuel Oil are measured according to BTU/h, and the capacity of Electricity is measured in kilowatts.
Consumption
The amount of energy a furnace actually uses is called consumption. In other words, we pay monthly bills for the consumption of a particular heating fuel. Heating Fuels are sold to consumers in different units of measure. For example, Natural gas is sold by cubic feet (ft3).
Press play to see the difference between capacity and consumption in a gas-heated home. (36 seconds)
The animation shows the capacity of the gas heater in BTUs per hour and a meter showing the consumption of fuel in cubic feet.
Fuel Comparison
| Fuel | Capacity | Consumption | Additional Information |
|---|---|---|---|
| Natural Gas | Measured in British thermal units per hour (BTU/h). Most heating appliances for home use have heating capacities of between 40,000 and 150,000 BTU/h. In the past, gas furnaces were often rated only on heat input; today the heat output is given. | Consumption of natural gas is measured in cubic feet (ft3). This is the amount that the gas meter registers and the amount that the gas utility records when a reading is taken. One cubic foot of natural gas contains about 1,000 BTU of energy. | Utility companies often bill customers for CCF (100 cu. ft) or therms of gas used: one therm equals 100,000 BTUs. Some companies also use a unit of MCF, which is equal to 1,000 cu. ft One MCF equals 1,000,000 BTUs (1 MM BTUs). |
| Propane or Liquefied Petroleum Gas (LPG) | Measured according to BTU/h. | Consumption of propane is usually measured in gallons; propane has an energy content of about 91.300 BTUs per gallon. | Can be used in many of the same types of equipment as natural gas. It is stored as a liquid in a tank at the house, so it can be used anywhere, even in areas where natural gas hookups are not available. |
| Fuel Oil | The heating (bonnet) capacity of oil heating appliances is the steady-state heat output of the furnace, measured in BTU/h. Typical oil-fired central heating appliances sold for home use today have heating capacities of between 56,000 and 150,000 BTU/h. | Oil use is generally billed by the gallon. One gallon of #2 fuel oil contains about 140,000 BTU of potential heat energy. | Several grades of fuel oil are produced by the petroleum industry, but only #2 fuel oil is commonly used for home heating. |
| Electricity | The heating capacity of electric systems is usually expressed in kilowatts (kW); 1 kW equals 1,000 W. A kilowatt-hour (kWh) is the amount of electrical energy supplied by 1 kW of power over a 1-hour period. Electric systems come in a wide range of capacities, generally from 10 kW to 50 kW. | Electricity is sold in kWh (kilowatts per hour). | The watt (W) is the basic unit of measurement of electric power. |
Heating Values of various fuels
Each unit of fuel when burned gives different amounts of energy. The energy that is released when a unit amount of fuel is burned is called the heating value. The heating value of a fuel is determined under a standard set of conditions. A comparison of approximate heating values of various fuels is shown in the table below.
| Fuel | Unit | Heating Value (BTU's) |
|---|---|---|
| Natural Gas | CCF (100 Cu. ft) or Therm | 100,000 |
| Natural Gas | MCF (1,000 Cu.ft) | 1,000,000 |
| Fuel Oil | Gallon | 140,000 |
| Electricity | kWh | 3,412 |
| Propane | Gallon | 91,300 |
| Bituminous Coal | Ton | 23,000,000 |
| Anthracite Coal | Ton | 26,000,000 |
| Hardwood | Cord | 24,000,000 |
Heating Efficiency
An assumption is made here that all the energy from the fuel is released, and all the heat is available to heat the place. However, generally, when a fuel is burned in a furnace, not all the energy (heat) is available for the final end user.
The energy efficiency of a furnace is not 100 percent. Not all the energy from the fuel is released, and not all the heat is available to heat the place. For example, if a furnace’s efficiency is, say, 50 percent, then twice as much fuel would be needed to heat a home.
Looking again at the table on the previous screen, we saw that the heating value of fuel oil is given as 140,000 BTUs. However, if the furnace’s efficiency is 50 percent, then the actual heating value of fuel oil is 140,000 BTUs x 0.5 (efficiency) = 70,000 BTUs. In other words, when a gallon of oil is burned, 70,000 BTUs of heat is actually available to the user.
| Fuel | Unit | Heating Value (BTU's) | If Efficiency = 50 % |
|---|---|---|---|
| Natural Gas | CCF (100 Cu. ft) or Therm | 100,000 | 50,000 |
| Natural Gas | MCF (1,000 Cu.ft) | 1,000,000 | 500,000 |
| Fuel Oil | Gallon | 140,000 | 70,000 |
| Electricity | kWh | 3,412 | 1706 |
| Propane | Gallon | 91,300 | 45,650 |
| Bituminous Coal | Ton | 23,000,000 | 11,500,000 |
| Anthracite Coal | Ton | 26,000,000 | 13,000,000 |
| Hardwood | Cord | 24,000,000 | 12,000,000 |
Efficiency of a Furnace
The table below contains the data from a line plot showing the efficiency of a furnace. The percent efficiency is dependent on the heating value of fuel oil (measured in BTU) and shows a strong positive correlation.
| Efficiency of a Furnace | Heating Value of Fuel Oil (BTUs) |
|---|---|
| 50% | 70000 |
| 55% | 77000 |
| 60% | 84000 |
| 65% | 90000 |
| 70% | 100000 |
| 75% | 105000 |
| 80% | 111000 |
| 85% | 122000 |
| 90% | 125000 |
| 95% | 131000 |
| 100% | 140000 |
It can be clearly seen that as the efficiency of the furnace increases, the amount of heat available increases proportionally.
The higher the efficiency, the less oil needs to be put into the furnace to get the same amount of heat output.
Most of the heating furnaces burn fuel and release hot combustion gases. The hot combustion gases heat the incoming cold air and go out through the chimney. In older furnaces, all the heat in the fuel is not released or not transferred to the cold air (or water, in the case of heat registers and water heaters), and therefore is lost through the chimney. The air or water that is heated distributes the heat throughout the house. Newer models of furnaces have gotten better at getting more of the heat into the cold air and, therefore, into your house.
Click the play button and observe how a wood burning furnace operates at 75% efficiency.
Click here to open a text description of How a Wood Furnace Operates
How a Wood Burning Furnace Operates
Cold combustion air from outside is pulled into the furnace combustion chamber by an electric blower. The wood fire in the chamber heats the air to 1 million BTUs. The hot combustion gasses heat the cold, outside air to 750,000 BTUs, which will circulate through the house. The combustion gasses (250,000 BTUs) travel out through the chimney.
Furnaces are usually not as efficient when they are first firing up as they are running at steady-state. It is sort of like a car getting better mileage in steady highway driving than in stop-and-go city traffic.
What matters over the course of the year is the total useful heat the furnace delivers to your house versus the heat value of the fuel it consumes. This is kind of like measuring the gas mileage your car gets by asking how many miles you drove this year and dividing it by how many gallons of gas you bought.
For furnaces, they call this measure the AFUE (Annual Fuel Utilization Efficiency). The federal minimum-efficiency standards for furnaces and boilers took effect in 1992, requiring that new furnace units have an AFUE of at least 78 percent and new boiler units have an AFUE of at least 80 percent. In comparison, many old furnaces and boilers have AFUE ratings of only 55 to 65 percent.
To find out how efficient your furnace is, look for an energy guide label like this:
The table below gives the efficiencies of most efficient furnaces that were available in 2002–2003.
| Fuel | Furnace Type | Efficiencies (%) |
|---|---|---|
| Natural Gas | Hot air | 93.0 - 96.6 |
| Natural Gas | Hot Water | 83.0 - 95.0 |
| Natural Gas | Steam | 81.0 - 82.7 |
| Fuel Oil | Furnace | 83.8 - 86.3 |
| Fuel Oil | Hot Water | 86.0 - 87.6 |
| Fuel Oil | Steam | 82.5 - 86.0 |
When buying a new furnace, make sure its heating capacity (output) is appropriate for your home. If the insulation and/or windows in your home have been upgraded since the old heating equipment was installed, you can probably use a much less powerful furnace or boiler. Oversized furnaces operate less efficiently because they cycle on and off more frequently; in addition, larger furnaces are more expensive to buy.
Energy Costs
It is clear now that when a unit of fuel is burned not all of it is available to the end user, and that as the furnace efficiency increases, higher amounts of heat will be available. An important question that needs to be addressed is how much it costs to buy the energy or heat to heat a place.
Fuel is usually sold in gallons or CCF or kWh. Comparing the actual cost of energy to produce a certain amount of heat for the end user would be easy if the comparison is made on an energy basis rather than on a unit basis. That is, \$/BTUs rather than \$/gal or CCF or kWh.
We can use the following formula to calculate Actual Energy Cost:
Example
Let’s say we need one million BTUs to keep a place warm at a certain temperature. What would it cost to get those million BTUs from oil or gas or electricity? Let’s assume that:
| Material | Cost per unit | Efficiency | Heating Value |
|---|---|---|---|
| Natural Gas | $6.60/MCF | 90% | 1,000,000 BTUs or 1.0 MM BTU/MCF |
| Oil | $1.25/Gallon | 85% | 140,000 BTUs or 0.14 MM BTUs/Gallon |
| Electricity | $0.082/kWh | 97% | 3,412 BTUs or .003412 MM BTUs/kWh |
Using the formula below, we can calculate the Actual Energy Cost.
Energy Cost Examples
Example 1
Please watch the following 1:26 presentation about Example #1. Your old oil furnace runs at about 68% efficiency. If you buy your oil for $1.02/gal, calculate your actual cost on an MM BTU basis.
Click here to open a transcript of the Energy Cost Example #1
Energy Cost Example #1
Your old oil furnace runs at about 68% efficiency. If you buy your oil for $1.02/gal, calculate your actual cost on an MM BTU basis.
Ok, the old furnace runs at about 68% efficiency in this problem. This is 5.6 and the old furnace runs at an efficiency of E=0.68, and we have the actual cost per unit price or unit fuel which is $1.02 per gallon. And we also know the calorific value or heating value in millions of BTUs. When you burn one gallon of oil, we get .13 million BTUs so we apply the same formula to get the actual cost. Which is cost per unit fuel which is $1.02/gallon divided by the heating value which is 0.13 MMBTUs per gallon. We have to have the same units here. And times the efficiency here. Efficiency is 0.68. Gallons and Gallons are canceled, and we get this one as $11.50 / Million BTUs.
Example 2
Please watch the following 2:44 presentation about Example #2. Natural gas costs 9.74 dollars/MCF. Heating oil costs 0.99 cents/gal. The natural gas furnace runs at 90% efficiency and the oil furnace runs at 80% efficiency. Which fuel is cheaper?
Click here to open a transcript of the Energy Cost Example #2
Energy Cost Example #2
Natural gas costs $9.74/MCF. Heating oil costs $0.99/gal. The natural gas furnace runs at 90% efficiency and the oil furnace runs at 80% efficiency. Which fuel is cheaper?
Ok. This 5.7 is an interesting problem here. We are trying to compare the prices of two fuels – Natural Gas which sells for $9.74/MCF, and we also have oil that sells at $0.99/gallon. We are trying to compare the prices of these two and choose which one is the best fuel or cheapest fuel. So we need to calculate the price per million BTUs so that we can compare these two fuels. And we also know the furnace efficiencies of each of these. Natural gas furnace efficiency is 0.9, and we know the oil furnace efficiency is 0.8; it is given. So we need to calculate the actual cost and compare the cost.
Natural gas actual cost will be cost per unit fuel, which is $9.74/MCF divided by the heating value per unit fuel. Heating value for this one happens to be 1.0 Million BTUs per MCF, and we have to multiply by the efficiency here in the denominator which is 0.9, so the Natural Gas price turns out to be $10.83 or $10.83 per Million BTUs (MMBTUs).
When you do similar calculation for oil here, the actual price is, per unit is $0.99 per gallon here and how many million BTUs do we get per gallon? 0.13 Million BTUs (0.13 MMBTUs). We have done this before. We have to have the same units here. Gallons and gallons and MCF and MCF here in this case (natural gas) and times the efficiency is 0.8. So the price works out to be $9.50 per Million BTUs. Same million BTUs would cost $10.82 for Natural Gas and oil would be $9.50, so oil is cheaper.
Annual Heating Costs
In the example on the page 12, we see that the heat loss from the house (walls, windows, and the roof) was 116.53 MM BTUs. We also know that it costs $24.77 for 1MM BTUs if electrical resistance heating is used (see Example 17 on page 26). The total cost for the heating can be calculated as follows:
The price of fuel oil is $10.50 per MMBtu. The annual heating cost would be:
Example
A house in International Falls, MN (HDD = 10,500) consists of 1248 ft2 of walls with an R-value of 13 and 1150 ft2 of roof with an R value of 29. The home is heated with natural gas. The AFUE is 0.90 and the price of natural gas is $0.88/CCF. What is the annual heating cost?
Energy cost per million BTUs from natural gas can be calculated using the following equation.
Heat required can be calculated from the heat loss. Heat loss from the house is from two sources: walls and the roof. Heat loss from each of these sources for a year (season) can be calculated by using the following equation.
Total heat loss = sum of heat loss from the walls and the roof
Annual heating cost = Annual heat loss (MMBTUs) x Actual energy cost ($/MMBTU)
Annual Heating Cost Examples
Example 1
Please watch the following 6:01 presentation about Example Problem #1. A house in Bismark, ND (HDD = 9,000) has 860 ft2 of windows (R = 1), 2,920 ft2 of walls (R = 19), and 3,850 ft2 of roof (R = 22). Calculate how much heating oil is required to heat this house for the heating season. The furnace efficiency is 80%.
Click here to open a text description of the Annual Heating Cost Example 1.
Annual Heating Cost Example 1
A house in Bismark, ND (HDD = 9000) has 860 ft2 of windows (R = 1), 2920 ft2 of walls (R = 19), and 3850 ft2 of roof (R = 22). Calculate how much heating oil is required to heat this house for the heating season. The furnace efficiency is 80%.
Ok, this problem is very similar to what we have done before. Which is calculating the heat loss from various surfaces and adding all of those to get the total heat loss from the house. And to calculate the oil requirement based on the furnace efficiency. The house is located in Bismark, ND and HDD there is given as 9,000, so HDD is given. This HDD remains the same for all different surfaces. And we also know the surfaces of each of these components, like windows. Let’s do the calculation first for windows.
Windows area is given as 860 square ft, and we also know the R-value of this. R-value is given as 1 – this is ft °F h/BTUs. So we can calculate heat loss through windows. Where all we need is the area, 860 square ft times HDD which is 9,000 in this case times 24 hours in a day divided by, we get the R-value here. That is 1 ft°F h/BTU. So ft/ ft cancel, °F/°F, 24 hours/24 hours, days and days, so the total heat loss through windows is the number that we get here. It happens to be 185,760,000 BTUs.
Similarly, we can calculate the heat loss - this is through windows. We can calculate heat loss through the walls. Wall area is 2,920 ft2 times 9,000 °F days times 24 hours per day divided by R-value of 19 for walls. And we can cancel out the units and make sure that everything makes sense and this turns out to be 33,195,789 BTUs.
Now heat loss through the roof. You can calculate it again separately and the area of the roof happens to be 3850 ft2, and 9,000 degree days times 24 hours over a day divided by, the roof generally has higher R-value, 22 ft2 °F h/BTUs, ok? Now let’s cancel out these units and the heat loss is to be 37,800,000 BTUs. So the total heat loss is the sum of all these three and when you add these up you get 256,755,789 BTUs.
Now, the furnace efficiency is given, and we are using, in this case, heating oil. Heating oil is 130,000 BTUs so how much is required? How much heating oil is required? We need 256,755,789 BTUs. When we buy heating oil, we get 130,000 BTUs per every gallon, and although we get 130,000, this is theoretical, the efficiency is given as 0.8 so only 80% will get really available as heat. So, that makes it, actually, the requirement a little bit higher, so that is equal to now, if we do this calculation, it will be 2,468.8 gallons or roughly 2,469 gallons of oil is required to heat this place.
Pay Back Period
Earlier sections illustrated that adding more insulation and improving the R-value of a wall would help in cutting heat loss. Less heat loss reduces the amount of fuel that needs to be burned, thereby reducing the heating costs and protecting the environment. However, adding insulation often involves additional investment.
The money invested into insulation can be recovered or paid back using the money saved because of the reduction of fuel usage. The time it takes to recover the additional cost through savings is called the pay-back period. A simple pay back is the initial investment divided by annual savings after taxes.
A simple calculation illustrates this term. If the R-value of the wall used in an earlier example is improved to R-23 by adding additional insulation, which costs $254, the heat loss can be reduced. The new heat loss after improvement can be calculated using the equation below.
Heat loss from the roof remains the same and is equal to 9.99 MM BTUs. Therefore, new annual total heat loss is only 13.7 + 9.99 =23.69 MM BTUs. The annual cost of heating after this improvement would be:
The savings is $334.96 - $232.16 = $102.80 every year. Remember that to get this savings, an investment of $254 was made. So if this investment was paid off by the savings, it would take
The pay-back period is 2.47 years. Shorter pay-back periods indicate that the additional investment can be paid off quickly and the homeowner can start saving money after that.
The formula below will help you to estimate the cost effectiveness of adding insulation in terms of the "years to payback" for savings in heating costs.
Where:
Ci = Cost of insulation in $/square feet. Collect insulation cost information; include labor, equipment, and vapor barrier if needed.
Ce = Cost of energy, expressed in $/BTUs. To calculate this, divide the actual price you pay per gallon of oil, kilowatt-hour (kWh) of electricity, gallon of propane, or therm (or per one hundred cubic feet [CCF]) of natural gas by the BTU content per unit of fuel.
E = Efficiency of the heating system. For gas, propane, and fuel oil systems, this is the Annual Fuel Utilization Efficiency, or AFUE.
R1 = Initial R-value of section
R2 = Final R-value of section
R2 – R1 = R-value of additional insulation being considered
HDD = Heating degree days/year. This information can usually be obtained from your local weather station, utility, or oil dealer.
24 = Multiplier used to convert HDD to heating hours (24 hours/day).
The formula above works only for uniform sections of the home. For example, you can estimate years to pay back for a wall or several walls that have the same R-values, if you add the same amount of insulation everywhere. Ceilings, walls, or sections of walls with different R-values must be figured separately.
Example
Mr. Energy Conscious (who lives in East Lansing, MI with an HDD of 7,164) wants to know how many years it will take to recover the cost of installing additional insulation in his attic. He renovated his attic and increased the level of insulation from R-19 to R-30 by adding additional insulation. He has a gas furnace with an AFUE of 0.88 and pays $0.95/CCF for natural gas. The attic insulation costs $340 to cover 1,100 sq. ft.
The pay-back period is given by the equation 5.5:
R1 = 19; R2 = 30; and R2 - R1 = 30 - 19 = 11
HDD = 7,164 and E = 0.88
The most important part of this problem is to determine the cost of insulation per one sq. ft (Ci) and cost of energy per one BTU (Ce).
Note: The cost for one BTU is a very small number.
Substituting the values in the equation,
After 8.65 years, Mr. Energy Conscious can start saving money for himself for the rest of the period that he lives in that home. During the entire period the energy that he is not using can help the environment.
Pay Back Period Examples
Example 1
Please watch the following 3:04 presentation about Example Problem #1. For a house in Hackensack, NJ (HDD = 4,600), the installed cost to upgrade from R-13 to R-22 is $0.60/ft2. The AFUE for the oil furnace is 0.78 and heating oil costs $1.13/gal. How long will it take to recover the initial investment?
Click here to open a transcript of the Payback Period Example Problem #1.
Payback Period Example 1
For a house in Hackensack, NJ (HDD = 4,600), the installed cost to upgrade from R-13 to R-22 is $0.60/ft2. The AFUE for the oil furnace is 0.78 and heating oil costs $1.13/gal. How long will it take to recover the initial investment?
Ok, this is 5.10. Heating Degree Days are given. In this problem, basically we are trying to calculate the pay back period again using the formula that we have. That we derived basically and payback period for adding insulation is cost of insulation times R1 times R2 times efficiency divided by cost of energy times the difference in R-value times HDD times 24. That is the formula that we need to use.
We have all the data. HDD is given as 4,600 and cost of insulation Ci is given as $0.60 per ft2 and the efficiency of the furnace is given as 78% or 0.78. We know the initial R-value, R1 = 13, and we know the final R-value; the improved R-value which is 22, the difference is 9. And we know the price of energy or cost of energy. We are paying $1.13 to buy a gallon of oil and when we buy a gallon of oil by paying $1.13 we get 130,000 BTUs.
So, for every BTU we pay $0.0000869. So we can use the formula now. It consists of Ci, Ci is cost of insulation, which is 0.06 per ft2, dollars per ft2 times R1 which is 13, again units, you have to make sure ft2, °F, hr/BTU. And here R2 is 22 and times the efficiency which is .78 divided by the cost of energy which is dollars per BTUs. $0.0000869/1 single BTU times the difference between these two R values here and that is 22 minus 13 (9) times days, (HDD) 4,600 times 24 and when you do this calculation it turns out to be 15.5 years is the payback period.
Example 2
Please watch the following 4:10 presentation about Example Problem #2. Lt. Dave Rajakovich has 1200 ft2 of roof in his home in Pittsburgh, PA (HDD = 6,000). He is considering upgrading the insulation from R-16 to R-22. The estimate from the contractor was $775. His home is heated with natural gas. Last year, the average price he paid for natural gas was $9.86/MCF. Assuming an AFUE of 86%, how long will it take Dave to recover his investment?
Click here to open a text description of the Payback Period Example Problem #2.
Payback Period Example #2
Lt. Dave Rajakovich has 1200 ft2 of roof in his home in Pittsburgh, PA (HDD = 6,000). He is considering upgrading the insulation from R-16 to R-22. The estimate from the contractor was $775. His home is heated with natural gas. Last year, the average price he paid for natural gas was $9.86/MCF. Assuming an AFUE of 86%, how long will it take Dave to recover his investment?
Ok, this is 5.11. Here Dave has a house, and he is trying to improve the insulation and the contractor comes up with an estimate of $775. He is using natural gas to heat the home, and we are trying to calculate how long will it take Dave to recover his investment? And this is a typical problem that uses an equation for payback period. Equal to Ci, cost of insulation, times R1 times R2 times efficiency divided by cost of energy times again R2 minus R1, this is the final R-value minus the initial R-value times HDD times 24.
Do we have all the pieces of information for this formula?
Cost of insulation: Cost of insulation should be in dollars per square foot. So Dave has got an estimate of $775 to cover an area of 1200 square foot. Roof area happens to be 1200 ft2. To cover this area with insulation it costs $775, so we can calculate the cost per ft. This happens to be $0.65 per ft2. That’s what we want, per ft2.
Do we know R1? Yes we know, R1 is equal to 16, R2 is equal to 22 and the furnace efficiency, E, is equal to 0.86. And we also know HDD. HDD is 6,000, and we know 24 hours.
Only thing here is we need to calculate the cost, Ce, cost of energy. And we are paying here, or Dave is paying $9.86 per MCF. Remember, MCF is basically one million BTUs. So the price would be $9.86 per million BTUs. So this will be equal to 0.00000986.
And if we plug this into this number here, into this formula here, 0.65 times 16 times 22 times 0.86 and divided by this is 0.00000986 and R2 – R1 happens to be 6 and 6,000 is the degree days and 24. This should come out to be, I guess 23 years roughly. This is kind of a long time period to recover the investment.
Review and Extra Resources
Review Sheet Lesson 7 – Home Heating Basics
- Residential Heat Loss
- Home heating is the single highest energy expense for a household.
- Mechanisms of heat loss. You should be able to identify the mechanisms given some examples.
- Conduction
- Convection
- Radiation
- Heating Degree Days. Definition and Calculation of HDD
- Seasonal heating degree day. Calculation of Seasonal HDDs
- Heat loss
- Hourly heating loss
- From temperature difference
- Annual or Seasonal heating loss
- From HDD
- Hourly heating loss
- Insulation and Home heating fuels
- R-Value
- Types of Insulation
- Composite R-value calculation (Make sure if the component R-value is given for the whole thickness or per inch.)
- Calculation of wall heat loss
- Fuel Choices for home heating
- Heating value of fuels
- Heating Efficiency
- AFUE (Annual Fuel Utilization Efficiency)
- Energy Cost
- Annual heating
- Payback Period
- Make sure you use the correct units for each quantity used in the formula.
Test Yourself!
The questions below are your chance to test and practice your understanding of the content covered in this lesson. In other words, you should be able to answer the following questions if you know the material that was just covered! If you have problems with any of the items, feel free to post your question on the unit message board so your classmates, and/or your instructor, can help you out!
- Compare and contrast the three conventional heating methods (forced air duct, Hydronic floor, and baseboard heating systems).
- Describe any five methods (total) to reduce home heating/cooling costs, and explain how each step reduces the energy consumption.
- Explain the operation principle of a ground source heat pump. Explain the difference between an open-loop and a closed-loop GHP.
- What is the difference between active and passive heating systems?
- With a neat sketch, describe how an active solar heating system works.
- Describe any three passive heating methods.
- Explain how a geothermal heat pump works and why it is so efficient.
- Explain clearly how an air-to-air heat pump works. List the main components used in the heat pump.
Extra Resources
For more information on topics discussed in Lesson 7, see these selected references:
- ACEEE Heating
- Office of Energy Efficiency and Renewable Energy
- Elements of an energy efficient house, Factsheet,DOE/GO-102-1070 PS-207 July 2000, pp 1-8.
- Insulation, Fact sheet, US Department of Energy DOE/CE-0180, 2008.
- Fiber Glass Loose Fill Insulation
- Q&A About Home Insulation
- EERE on insulation
Lesson 7 Deliverables
Deliverable 1
You must complete a short quiz that covers the reading material in lesson 7. The Lesson 7 Quiz, can be found in the Lesson 7: Home Heating Basics module in Canvas. Please refer to the Calendar in Canvas for specific timeframes and due dates.
Lesson 8: Home Heating Systems
The links below provide an outline of the material for this lesson. Be sure to carefully read through the entire lesson before returning to Canvas to submit your assignments.
Introduction
Welcome to Lesson 8!
More than 90 million single-family, multi-family, and mobile-home households encompass the residential sector. Households use energy to cool and heat their homes, to heat water, and to operate many appliances such as refrigerators, stoves, televisions, and hot tubs.
Nearly half of the energy used at home is for space heating. Conventional space heating systems in the U.S. emit a billion tons of carbon dioxide (CO2) and about 12 % of the sulfur dioxide and nitrogen oxides. Reducing the use of conventional energy sources for heating is the single most effective way you can reduce global environmental problems.
Look at the graph below to see how energy is used in U.S. households.
| How Energy is Used | Amount of Energy Used |
|---|---|
| Other Appliances and Lighting | 23% |
| Refrigerators | 5% |
| Water Heating | 17% |
| Electric Air Conditioning | 8% |
| Space Heating | 47% |
The energy sources utilized by the residential sector include electricity, natural gas, fuel oil, kerosene, liquefied petroleum gas (propane), coal, wood, and other renewable sources such as solar energy.
Look at the graph below to see the primary fuel used by U.S. households.
| Primary Fuel Used by U.S. Households | Amount of Fuel Used |
|---|---|
| Natural Gas | 55% |
| Electricity | 29% |
| LPG | 5% |
| Other | 0% |
| Fuel Oil | 8% |
| Kerosene | 1% |
| Wood | 2% |
Lesson 8 Objectives
Upon Completion of this lesson, students will be able to:
- explain the operating principles of various types of heating systems;
- list the main advantages and disadvantages of various heating systems;
- explain the energy efficiencies of each of these heating systems; and
- describe ways to improve the energy efficiency of the heating systems.
Checklist for Lesson 8
Here is your "to do" list for this week.
| Step | Activity | Access / Directions |
|---|---|---|
| 1 | Read the online lesson | Lesson 8a - Comparison of Home Heating Systems Lesson 8b - Cooling and Heating |
| 2 | Review | Lesson 8 - Review and Extra Resources (supplemental materials that are optional...but informative!). |
| 3 | Take |
Lesson 8 - Quiz (graded). The quiz is available in Canvas. |
See the Calendar tab in Canvas for due dates/times.
Questions?
If you have any questions, please post them to the General Course Questions forum in located in the Discussions tab in Canvas. I will check that discussion forum daily to respond. While you are visiting the discussion board, feel free to post your own responses to questions posted by others - this way, you might help a classmate!
Lesson 8a: Comparison of Home Heating Systems
The following pages in Section A of Lesson 8 will cover comparisons of home heating systems.
Central Heating Systems
Home heating systems are classified based on the fuel and/or the method by which the heat is transferred and distributed into the house:
- Furnaces, boilers, or electric resistance heat powered by conventional fuels supply most of the heating in homes and commercial buildings today.
- Heat pumps are used to a lesser (but increasing) extent to provide space heating.
Most newer homes are heated using central heating systems. Those without central heating systems utilize electric baseboard heaters or, in some cases, in-the-wall or in-floor gas heaters or radiant heat.
Instructions: Move your cursor over the numbers below and click to see the characteristics of a central heating system:
Central Ducted Air Systems
Ducted air systems are the most common type of central heating and cooling used. If a home has a central air conditioner, heat pump, or furnace, it is a ducted air system. There are two main types: Forced-air Heating Systems and Gravity Heating Systems.
Forced Air Heating Systems
Almost 35 million homes in America are heated by natural gas-fired, forced-air heating systems- by far the most popular form of central heating.
With a forced-air system, a furnace warms air, an air conditioner cools air, or a heat pump either warms or cools air, then a blower forces the air through the system. Therefore, the same duct system can be used for both heating and cooling.
Below are images of the main components of a forced air heating system. Can you identify each? Drag and drop the image onto its name.
In a forced-air heating system, room air (cooler) is drawn by a fan or a blower through return air registers and ductwork, and passes through a filter (to remove any dust particles) into a furnace, where the air is heated. The warmed air is then blown back to rooms through a system of supply ducts and registers.
Click on the “play” button below to see how a forced-air heating system works.
How a Forced-Air Heating System Works
The process begins when cold air is pulled into the return register. The air passes through a filter into the furnace to be heated. The now hot air travels up through the main duct and into the supply branches. Each supply branch has a supply register that allows the hot air to enter the room.
Gravity Heating System
With a gravity furnace, convection currents (caused by the natural tendency of heated air to rise) carry heated air through the system from a furnace that is located on or below the main floor level. Gravity systems, somewhat older, do not have blowers, and tend to have very large air ducts; they can only deliver warmed air.
Press the "play" button below to see how a gravity heating system works.
How a Gravity Heating System Works
In a gravity heating system, a furnace located in the basement heats air that rises and travels to each room, creating a convection current that circulates the warm and cool air.
In gravity heating systems, the ducts are larger than forced-air heating systems, and only warm air travels through them.
Conventional Furnaces
Most furnaces are gas-fired, but other fuels include oil, coal, wood, and electricity.
With a conventional furnace, natural gas is piped to a burner located inside a combustion chamber. There, the gas is mixed with air, then ignited by a pilot light, a spark, or a similar device controlled by a thermostat. The flame heats up a metal box—the heat exchanger—where room air is heated as it flows through. Exhaust gases given off by burners vent outside through a flue that goes up through the roof or, with newer high-efficiency models, out through a wall.
Instructions: Press the play button to see how a gas furnace works, and then answer the question that follows.
How a Gas Furnace Works
In a gas furnace, cold air is pulled into the return register and is heated by the heat exchanger; a series of gas burners within a combustion chamber. The hot air is pushed out and distributed through the house. Exhaust from the gas burners exits the building through an exhaust vent.
An electric furnace uses heating elements rather than burners to heat in the heat exchanger.
Instructions: Press the "play" button to see how an electrical furnace works, and then answer the question that follows.
Click here to open a text description of How an Electrical Furnace Works
How an Electric Furnace Works
A motor-driven fan pulls air into the return register. The air passes through a filter and moves past electric heating elements. The now warm air is pushed out the system and distributed throughout the house.
Heat Distribution
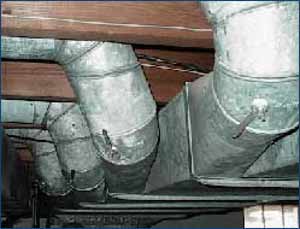
As you may recall from the “drag ‘n drop” activity on the Central Ducted Air Systems page, the main components of a forced-air heating system include the furnace, main duct, branches, and registers.
In a hot-air system, warm air is distributed via a main duct and a series of branches that lead to individual rooms or zones. Where the branches meet the main duct, heat is controlled by dampers (act as valves for air flow), which open or close to release or block heat from entry. These dampers, usually motorized, are run by thermostatic controls at each zone. Individual registers may also be closed to block heat, but this is a less efficient use of the energy and heat produced than when there are thermostatic or automatic controls.
An upward-flow furnace draws cold air in through the bottom and sends heated air out the top. Upward-flow furnaces are often used in houses that have basements or that deliver heat through overhead ductwork.
A downward-flow or counter-flow furnace draws cool return air through the top and delivers heated air out the bottom. This type is favored where there is no basement, or where air ducts are located in the floor.
A forced-air heating system can be combined with air conditioning (for cooling), a humidifier (for maintaining proper moisture balance), and an air filter (for purifying the air). Ductwork is generally metal, wrapped with insulation to help keep heat in. In some cases, flexible insulation-style ductwork is preferred. This system has several advantages and disadvantages, as described below.
Advantages
- Air ducts and registers distribute heat from a central furnace, providing rapid heat delivery.
- The system can also be used to filter and humidify the household air, to provide central air conditioning.
- The system circulates air for ventilation.
Disadvantages
- Air coming from the heating registers sometimes feels cool (especially with certain heat pumps), even when it is warmer than the room temperature.
- There can also be short bursts of very hot air, especially with oversized units.
- Ductwork may transmit furnace noise, and can circulate dust and odors throughout the house.
- Ducts are also notoriously leaky, typically raising a home's heating costs by 20% to 30%.
Radiant Heating Systems - Baseboards
Baseboard Radiators
In the baseboard hydronic heating systems (shown below), water is heated in a gas-fired or oil-fired furnace located in the basement. The heated water is distributed through pipes into baseboards in various rooms. The heat is then delivered through radiation and convection. Although these are called radiant heating systems, most of the heat delivered is by convection. Heat delivery into rooms or zones can be controlled by flaps or louvers.
A picture of a baseboard heater is shown below. Closely spaced metallic sheets called “fins” increase the surface area for efficient heat transfer into the room.
Advantages and Disadvantages of Radiant Baseboard Heating
| Advantages | Disadvantages |
|---|---|
| In general, it operates quietly. | Cannot be used for cooling. |
| It delivers constant heat and doesn't stir up allergens or dust. | High installation costs. |
| Because it warms people and objects rather than just air, it feels warm even if a door is opened or a room is somewhat drafty or slightly cooler than normal. | Interference with furniture placement. |
| There is less heat loss (waste) compared to a forced air system because there is no leakage. | Air entrapment can reduce efficiency. |
Radiant Heating Systems - Floors
Types of Radiant Floor Heat
There are three types of radiant floor heat:
- Radiant air floors (air is the heat-carrying medium)
- Electric radiant floors
- Hot water (hydronic) radiant floors.
Instructions: Compare conventional baseboard heating to radiant floor heat, by clicking on the button below. (14 seconds and 11 seconds)
Finish: Comparison of Home Heating Systems
Types of Installation
All three types of radiant floor heat (air, electric, hot water) can be further subdivided by the type of installation:
- Those that make use of the large thermal mass of a concrete slab floor or lightweight concrete over a wooden subfloor (these are called “wet installations”)
- Those in which the installer “sandwiches” the radiant floor tubing between two layers of plywood or attaches the tubing under the finished floor or subfloor (“dry installations”)

Cost Effectiveness
Radiant Air Floors
Because air cannot hold large amounts of heat, radiant air floors are not cost-effective in residential applications and are seldom installed.
Electric radiant floors
Electric radiant floors are usually only cost-effective if your electric utility company offers time-of-use rates. Time-of-use rates allow you to “charge” the concrete floor with heat during off-peak hours (approximately 9 p.m. to 6 a.m.). If the floor's thermal mass is large enough, the heat stored in it will keep the house comfortable for eight to ten hours without any further electrical input. This practice saves a considerable number of energy dollars compared to heating at peak electric rates during the day.
Instructions: Press the play button to observe how a concrete floor is charged during time-of-use rates. (1 minute 16 seconds)
Hydronic systems
Hydronic (liquid) systems, popular and cost-effective systems for heating-dominated climates, have been in extensive use in Europe for decades.
Hydronic radiant floor systems pump heated water from a boiler through tubing laid in a pattern underneath the floor. The temperature in each room is controlled by regulating the flow of hot water through each tubing loop via a system of zoning valves or pumps and thermostats.
Instructions: Press the play button to see how a hydronic radiant floor system works. (9 seconds)
Installation
Wet installations are the oldest form of modern radiant floor systems. In a wet installation, the tubing is embedded in the concrete foundation slab, or in a lightweight concrete slab on top of a subfloor, or over a previously poured slab.
A new generation of in-floor hydronic heating that employs corrosion-proof, hot-water tubing has enjoyed widespread popularity in recent years. With this type of system, heat is evenly distributed and floors are warm under foot. A variety of heating equipment may heat water: natural gas or propane water heater or boiler, electric boiler, wood boiler, heat pump, solar collector, or even geothermal energy.
Tubing for a hydronic system may be installed in a conventional concrete slab or in a lightweight, gypsum-cement slab. It can also be stapled to the undersides of subflooring as shown in the image below:
A new generation of hydronic heating: This photograph depicts corrosion-proof, hot-water tubing stapled to the underside of subflooring.
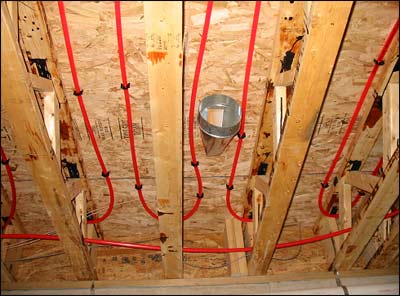
Radiant Floor Coverings
Although ceramic tile is the most common floor covering for radiant floor heating, almost any floor covering can be used. However, some perform better than others. Common floor coverings like vinyl and linoleum sheet goods, carpeting, wood, or bare concrete are often specified.
- Carpeting
It is wise to always remember that anything that can insulate the floor also reduces or slows the heat entering the space from the floor system, which in turn increases fuel consumption. If carpeting is required, a thin carpet with dense padding is preferred. If some rooms, but not all, will have a floor covering, then those rooms should have a separate tubing loop to make the system heat these spaces more efficiently, because the water flowing under the covered floor will need to be hotter to compensate for the floor covering. - Wood Flooring
Most radiant floor references also recommend using laminated wood flooring instead of solid wood, thus reducing the possibility of the wood shrinking and cracking from the drying effects of the heat. While solid wood flooring can be used, the installer is strongly advised to be very familiar with radiant floor systems before attempting to install natural wood flooring over a radiant floor system. Most manufacturers and manuals relating to radiant floors offer guidelines to help you resolve these issues.
Instructions: Dr. P. is doing some remodeling and needs to purchase new flooring. Assuming his home uses radiant heat, help him select the most appropriate flooring option.

Radiant Floor Tubing
There are various types of tubing used in Radiant floor heating systems.
- Copper or Steel Tubing - Older radiant floor systems used either copper or steel tubing embedded in the concrete floors. Unless the builder coated the tubing with a protective compound, a chemical reaction between the metal and the concrete often led to corrosion of the tubing, and to eventual leaks.
- PEX or Rubber Tubing - Major manufacturers of hydronic radiant floor systems now use cross-linked polyethylene (PEX) or rubber tubing with an oxygen diffusion barrier. These materials have proven themselves to be more reliable than the older choices in tubing. Fluid additives also help protect the system from corrosion.
- Defective Tubing - There have been recent reports of problems with rubber tubing produced by one chemical manufacturer. Leaks develop at the metal connections or fittings, and, in some cases, the tubing becomes rigid and brittle. It is still not clear what causes this problem, but, theoretically, excessively high water temperatures may be to blame. Tightening the connections and clamps only temporarily fixes the leaks. Remember, this problem only concerns a specific brand of rubber tubing; it does not have anything to do with the PEX tubing, which has performed very reliably for many decades. Since the price of copper tubing is considerably lower now than several years ago, it is again gaining some popularity because of its superior heat transfer abilities over plastic-based tubing.
How Radiant Heat Systems are Controlled
Instructions: Click on the hot spots in the image below to find out how radiant heat systems are controlled.
Advantages and Disadvantages of Radiant Floor Heating Systems
| Advantages | Disadvantages |
|---|---|
| Radiant floor systems allow even heating throughout the whole floor, not just in localized spots as with wood stoves, hot air systems, and other types of radiators. | Does not respond quickly to temperature settings. |
| The room heats from the bottom up, warming the feet and body first. | Relatively expensive to install but can save money in the long run. |
| Radiant floor heating also eliminates the draft, dust, and allergen problems associated with forced-air heating systems. | Requires professional installers. |
| With radiant floor heating, you may be able to set the thermostat several degrees lower, relative to other types of central heating systems. | |
| There are no heat registers or radiators to obstruct furniture arrangements and interior design plans. |
Direct or In-Situ Heating Systems
Instead of generating heated air or water at a central location and then distributing it throughout the home, some systems generate heat where it is needed locally. The most common method is electric baseboard heat. Other ways include kerosene heat; wood-burning stoves; and fireplaces burning wood, coal, or natural gas. These systems can heat the whole house, part of the house, or a single room.
Electric Resistance Heat
Electric resistance heating converts nearly 100 percent of the energy in the electricity to heat. However, most electricity is produced from oil, gas, or coal generators that convert only about 30 percent of the fuel's energy into electricity. Because of electricity's generation and transmission losses, electric heat is often more expensive than heat produced in the home with combustion appliances such as natural gas, propane, and oil furnaces.
Electric resistance heat can be supplied by centralized forced-air furnaces or by zonal heaters in each room, both of which can be composed of a variety of heater types.
- Zonal heaters distribute electric resistance heat more efficiently than electric furnaces because you set room temperatures according to occupancy.
- Zonal heaters have no ducts (unlike electric furnaces) that can lose heat before it reaches the room.
- Electric furnaces can accommodate central cooling more easily than zonal electric heating because the air conditioner can share the furnace's ducts.
- Electric resistance heat can be provided by electric baseboard heaters, electric wall heaters, electric radiant heat, electric space heaters, electric furnaces, or electric thermal storage systems.
| Type of Heater | Description | Method of Heating | Installation | Advantages / Disadvantages |
|---|---|---|---|---|
| Baseboard Heaters | Zonal heaters controlled by thermostats located in each room. Contain electric heating elements encased in metal pipes, which are surrounded by aluminum fins to aid heat transfer and run the length of the baseboard heater's housing, or cabinet. | Convection and radiation. As air within the heater is warmed, it rises into the room, and cooler air is drawn into the bottom of the heater. Some heat is also radiated from the pipe, fins, and housing. |
Usually installed underneath windows where the heater's rising warm air counteracts falling cool air from the cold window glass. Seldom located on interior walls because the standard heating practice is to supply heat at the home's perimeter where the greatest heat loss occurs. Should sit at least three-quarters of an inch (1.9 centimeters) above the floor or carpet, to allow the cooler air on the floor to flow under and through the radiator fins so it can be heated. Should also fit tightly to the wall to prevent the warm air from convecting behind it and streaking the wall with dust particles. |
The quality of baseboard heaters varies considerably. Cheaper models can be noisy and often give poor temperature control. Look for labels from Underwriter's Laboratories (UL) and the National Electrical Manufacturer's Association (NEMA). Compare warranties of the different models you are considering. |
| Wall Heaters | Consist of an electric element with a reflector behind it to reflect heat into the room, and usually a fan to move air through the heater. | Convection and radiation. | Usually installed on interior walls because installing them in an exterior wall makes that wall difficult to insulate. | ---------- |
| Radiant Heaters | Several types, including electrical heating cables (most common), gypsum ceiling panels and metal radiant panels (provide radiant heat faster than other types because they contain less material to warm up. | Radiation - radiate heat to the room's objects, including its people. For example, you can feel a ceiling-mounted radiant heating panel warming your head and shoulders if you stand underneath it. | Electric heating cables are imbedded in floors or ceilings; gypsum ceiling panels are already equipped with factory-imbedded heating cables; and metal radiant panels are ceiling-mounted. | Offers draft-free heating that is easily zoned. It occupies no interior space, allowing you complete freedom to place furniture without worrying about impeding air flow from registers or baseboard heaters. Manufacturers claim that radiant heat can provide comfort similar to other systems at lower indoor air temperatures, saving around 5 percent of space heating costs. Critics say that it can be difficult to control air temperature with a thermostat. The large heat-storage capacity of the concrete or plaster surrounding the heating cables may result in greater-than-normal fluctuations in the room air temperature, since it takes quite a while to heat up the storage mass. Also, some occupants complain about their heads being too warm in rooms that utilize ceiling radiant heat. Supplying heat at the ceiling or floor, which are locations that typically border the outdoors or unheated spaces, can result in greater heat losses. For example, if there are any flaws in a heated concrete slab or gaps in the ceiling insulation above heating elements, a large percent of the electric heat may escape to the outdoors without ever heating the home. |
| Space Heaters | Electric space heaters come in a wide variety of models, either built-in or portable. Portable space heaters, as well as many built-in space heaters for small rooms, have built-in thermostats. Larger rooms heated with built-in electric space heaters should have low-voltage thermostats installed in an area that maintains the room's average temperature. |
These heaters may have fans to circulate heated air, and may also be designed to transfer some of their heat by radiation. | All of these heaters must be given adequate clearance to allow air to circulate safely. | --------------- |
Fireplaces
Fireplaces are very commonly used in family rooms and other living areas to give a warm and cozy feeling. These fireplaces can be wood or natural-gas fired.
Generally, fireplaces transfer the heat by radiation, and hot combustion gases (carrying a lot of thermal energy) go out through the stack. Hot gases are lighter and rise up the chimney; a natural suction created by this flow draws the heated warm air from the room.
Most of the time, the warm air heated in the room by the main heating fuel is also drawn into the fireplace and goes up the chimney, resulting in a net loss of energy. It is estimated that about 75 percent of the heated air is lost through the chimney. However, many people still use fireplaces inefficiently.
Fireplaces
In rooms heated by a fireplace, warm air from the room is drawn into the fire for combustion. The hot combustion gasses travel up and out the chimney, and heat is radiated from the fireplace throughout the room.
Advantages and disadvantages of direct heating systems
| Advantages | Disadvantages |
|---|---|
| Generates heat at the point of use; no transmission losses. | Heats only certain parts of the home. |
| Inexpensive to purchase and install. | Cannot be used for cooling. |
| Easy local control in each room. | Takes up living room. |
| In well-insulated houses, it may be cheaper than other systems. | Generally less efficient than other central heating systems. |
Lesson 8b: Cooling and Heating
The following pages in Section B of Lesson 8 will cover cooling and heating.
Heat Movers
So far, we have discussed systems in which a fuel is burned and heat is produced and delivered into the home. In these systems, we buy all the energy, and (depending on the system) we reject or lose some heat to the surroundings, reducing the efficiency.
One of the ways in which we can improve the heating efficiency is to make use of the heat that is available outside, even on a cold winter day. On a cold winter day with outside temperature at 30ºF, the air still has more energy compared to air at 10 ºF or 5ºF. Air at any temperature above absolute zero (0ºK or -273 ºC) will have energy.
The higher the temperature of air, the higher its energy content. This energy can be transferred to the interior.
Heat Pumps
Under natural circumstances, heat only flows from high temperatures to low temperatures. In order to move heat from a low temperature environment to a high temperature environment, work needs to be done (or rather energy needs to be spent).
A device that moves the heat from a low temperature environment to a high temperature environment is called a heat mover.
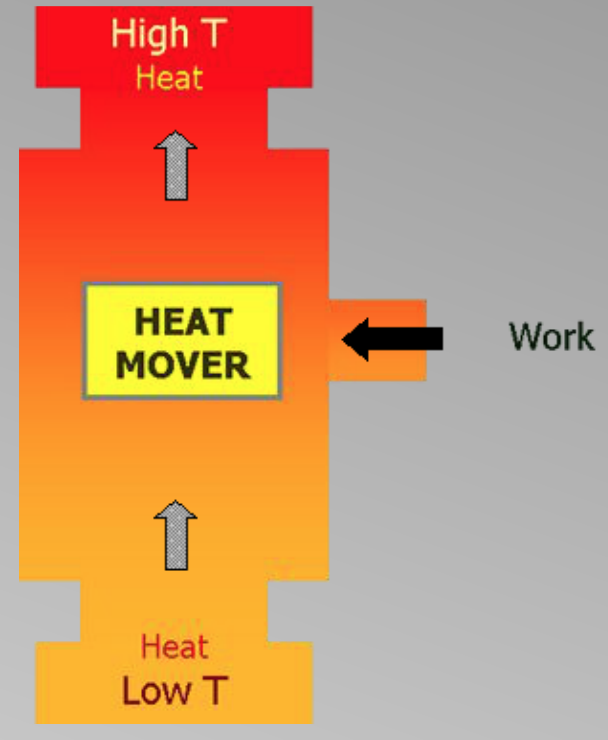
An example of a heat mover is a heat pump. A heat pump is a heating/cooling system and also a forced-air system. Cooled (and sometimes humidified or electronically cleaned) air is usually delivered through the same ductwork and registers used by heated air.
A heat pump uses air-conditioning principles to extract heat from one place and deliver it to another, and vice versa. In addition to expelling heat from indoors, the system can be reversed to heat the home in the winter. Thus, a heat pump is a device that moves heat from a low-temperature to a high-temperature environment with the help of work that is put in.
Heat pumps are classified based on the low-temperature heat source:
- Air-source heat pump or Air-to-air heat pump. Heat is transferred from the low-temperature air outside to the high-temperature interior.
- Ground-source heat pump or Ground-to-air heat pump. The earth is used as a heat sink in the summer and a heat source in the winter; the pump relies on the relative warmth of the earth for its heating and cooling production.
- Water-source heat pump or Water-to-air heat pump. Heat is transferred from low-temperature water outside (from a pond or a lake) to a high-temperature interior.
An air conditioner is a cooling system and also a forced-air system. It runs on electricity and removes heat from the air with basic refrigeration principles.
Air-Source Heat Pump or Air-to-Air Heat Pump
An air-source or air-to-air heat pump can provide both heating and cooling.
- In the winter, a heat pump extracts heat from outside air and delivers it indoors.
- On hot summer days, it works in reverse, extracting heat from room air and pumping it outdoors to cool the house.
Nearly all air-source and air-to-air heat pumps are powered by electricity. They have an outdoor compressor/ condenser unit that is connected with refrigerant-filled tubing to an indoor air handler. As the refrigerant moves through the tubing of the system, it completes a basic refrigeration cycle, warming or cooling the coils inside the air handler. The blower pulls in room air, circulates it across the coils, and pushes the air through ductwork back into rooms.
When extra heat is needed on particularly cold days, supplemental electric-resistance elements kick on inside the air handler to add warmth to the air that is passing through.
Instructions: Click on the hot spots below to find out how the heating cycle of an air-source heat pump works:
In the winter, a heat pump extracts heat from outside air and delivers it indoors. In the summer, the heat pump extracts heat from room air and pumps it outdoors to cool the house.
Instructions: Observe the heating and cooling cycles of a heat pump.
Heating Cycle
Cooling Cycle
The Balance Point
As we have learned, air-source and air-to-air heat pumps work by extracting heat from the outside air. These heat pumps require a backup system to supplement their heating ability when the outdoor temperature gets below a certain temperature.
As the outdoor temperature drops, the heating requirement of the house increases and the output of the heat pump decreases. At some point, the temperature of the home’s heating requirement and the heat pump output match. This temperature is called the balance point and usually falls between 30-45 degrees Fahrenheit. For any temperatures below the balance point, supplemental heat will be required.
To locate the balance point, the heating requirement (BTUs/h) of the house and the heat pump output (BTUs/h) are plotted against the changes in outside temperature. The place where the home heating requirement and heat pump output lines cross is the balance point.
Take a look at the graph of the Balance Point.
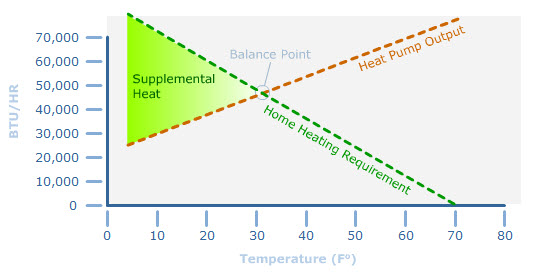
Efficiency of a Heat Pump
Efficiency of a heat pump is measured using a term Coefficient of Performance (COP), and it is the ratio of the useful heat that is pumped to a higher temperature, to a unit amount of work that is put in. We will look at COP in terms of air-source heat pumps.
A general expression for the efficiency of a heat engine can be written as:
Using the same logic that was used for heat engines, this expression becomes:
Where, Q Hot = Heat input at high temperature and Q cold= Heat rejected at low temperature. The expression can be rewritten as:
Note: Thot and Tcold must be expressed in the Kelvin Scale.
Air-Source Heat Pump or Air-to-Air Heat Pump Examples
Example 1
Calculate the ideal coefficient of performance (COP) for an air-to-air heat pump used to maintain the temperature of a house at 70 °F when the outside temperature is 30 °F.Solution:
First, convert the Fahrenheit temperatures to Celsius temperatures using this formula:
Next, convert the Celsius temperatures to Kelvin temperatures by adding 273.
Finally, use the formula from the previous screen to solve for the COP.
The example above shows that for every watt of power we use (and pay for) to drive this ideal heat pump, 13.3 W is delivered to the interior of the house and 12.3 from the outside (we don’t pay for this). This seems to be a deal that one cannot refuse. However, the theoretical maximum is never achieved in the real world. In practice, a COP in the range of 2 to 6 is typical. Even with this range, it is an excellent choice, because for every watt of power that we use, we transfer 1 to 5 additional watts from outside.
Example 2
Compare the ideal coefficients of performance of the same heat pump installed in State College, PA and Ann Arbor, MI when the inside temperature of a house is maintained at 70°F at both locations and the outside temperatures on a given day were 40°F and 15°F at State College and Ann Arbor, respectively.
| State College, PA | Ann Arbor, MI |
|---|---|
| Thot= 70 ºF = 21 ºC = 294 K | Thot= 70 ºF = 21ºC = 294 K |
| Tcold = 40 ºF = 4 ºC = 277 K | Tcold = 15 ºF = -9.4 ºC = 264 K |
| =17.3 | = 9.8 |
During a heating season, the heat pump's efficiency increases on mild days and decreases on cold days.
Ground Source (Geothermal) Heat Pumps
Ground-source or geothermal heat pumps (GHPs) are similar to the air-source heat pumps, except that the source of heat is the ground instead of outdoor air.
Instructions: Where does the heat in the ground come from? Press the “play” button and then answer the questions that follow.
Geothermal Heat Pumps
Where does the heat in the ground come from? Picture a house in the middle of a yard with the Sun in the background. As the Sun's rays hit the yard, heat is absorbed into the ground. The heat is stored several feet below the frost line and a fairly constant temperature (40 to 80 degrees Fahrenheit depending on location) is maintained throughout the year, due to the natural insulation of the ground.
Questions:
1. Where does the heat in the ground come from?
- Coal
- Natural Gas
- The Sun
- Uranium
2. Does the heat in the ground remain constant throughout the year?
- Yes
- No
Answers:
1. C: The Sun
2. A: Yes
As you observed in the animation, the earth absorbs and stores energy from the sun as heat, resulting in underground temperatures that range between 40–80ºF, depending on the location. These temperatures, which are located below the frost line (which is generally 4–5 feet in Pennsylvania), remain constant throughout the year.
The geothermal heat pumps (GHPs) use the earth as a heat sink in the summer and as a heat source in the winter, and therefore rely on the relative warmth of the earth for their heating and cooling production.
Through a system of underground pipes, they transfer heat from the warmer earth to the building in the winter, and take the heat from the building in the summer and discharge it into the cooler ground. Therefore, GHPs do not create heat; they move it from one area to another.
Operating Principle
The GHP system operates much like an air-source or air-to-air heat pump, except that:
- The outside tubing is buried to extract or discharge the heat in the ground;
- The compressor/condenser unit is inside rather than outside the house.
The GHP system also has additional valves to allow heat-exchange fluid (refrigerant) to follow two different paths: one for heating and one for cooling. The GHP takes heat from a warm area and exchanges the heat to a cooler area, and vice versa.
Instructions: Press the play button to see how a geothermal heat pump operates.
How a Geothermal Heat Pump Works
Water in the ground loop is circulated and warmed by the earth. That heat energy is transferred to a series of coils circulating the heat exchange fluid. The fluid is warmed further by another heating unit and the use of a compressor and expansion valve. The second heating unit circulates and heats the air within the house through a series of ducts.
Classification of GHPs
Closed-Looped Systems
Horizontal
The horizontal type of installation is generally most cost-effective for residential installations, particularly for new construction where sufficient land is available. It requires trenches at least four feet deep.
Horizontal systems come in two types of layouts, the two pipes method and the slinky method.
Two Pipes
The most common horizontal layouts include:
Two Pipes Layout (Option 1) - One pipe buried at six feet, and another pipe buried at four feet.

Two Pipes Layout (Option 2) - Both pipes placed side-by-side at five feet in the ground in a two-foot wide trench.

The Slinky™ Method
The pipe is looped to allow more pipes in a shorter trench, which cuts down on installation costs and makes horizontal installation possible in areas not possible with conventional horizontal applications. Large commercial buildings and schools often use vertical systems because the land area required for horizontal loops would be prohibitive

Vertical
This type of system may be used when the soil is too shallow for trenching or when one does not want to disturb the existing landscaping.
For a vertical system, holes (approximately four inches in diameter) are drilled about 20 feet apart and 100 to 400 feet deep. Into these holes go two pipes that are connected at the bottom with a U-bend to form a loop. The vertical loops are connected with horizontal pipe (i.e., manifold), placed in trenches, and connected to the heat pump in the building

Pond
If a home has source surface water, such as a pond or lake, this type of loop design may be the most economical, since there is no need to dig a trench or a well for the pipes in the ground. In this type of system, the fluid circulates through polyethylene piping in a body of water, just as it does in the ground loops. The pipe may be coiled in a slinky shape to fit more of it into a given amount of space. This loop is recommended only if the water level never drops below six to eight feet at its lowest level, to assure sufficient heat-transfer capability. Pond loops used in a closed system result in no adverse impacts on the aquatic system.

Open-Loop Systems
This type of system uses well(s) or surface body water as the heat exchange fluid that circulates directly through the GHP system. Once it has circulated through the system, the water returns to the ground through the well, a recharge well, or a surface discharge. This option is obviously practical only where there is an adequate supply of relatively clean water, and all local codes and regulations regarding groundwater discharge are met.

Factors Affecting the Type of GHP Loop
Geothermal heat pumps (GHPs) can be used effectively almost anywhere in the country. However, the specific geological, hydrological, and spatial characteristics of a site determine the best type of ground loop for a specific location.
Instructions: Click on the hot spots in the image below to view the factors affecting the type of GHP Loop.
Benefits of a GHP System
Click on the benefit listed below to find out more information.
Typically, when heating systems or appliances are compared, all the costs that are incurred—purchase, installation, operation, and maintenance costs—can be combined into a life-cycle cost, the cost of ownership over a period of years. The table below compares the various types of central heating systems:
| Compare | Safety | Installation Cost | Operating Cost | Maintenance Cost | Life-Cycle Cost |
|---|---|---|---|---|---|
| Combustion-Based | A Concern | Moderate | Moderate | High | Moderate |
| Heat Pump | Excellent | Moderate | Moderate | Moderate | Moderate |
| Geothermal or Ground-Source Heat Pump | Excellent | High | Low | Low | Low |
Installation and Operating Costs of GHP Systems

On average, a geothermal heat pump (GHP) system costs about \$2,500 to \$3,500 per ton of capacity, or roughly \$7,500 to 10,000 for a 3-ton unit (typical residential size). In comparison, other systems would cost about \$4,000 with air conditioning.
When included in the mortgage, the homeowner has a positive cash flow from the beginning. For example, say that the extra \$3,500 will add \$30 per month to each mortgage payment. A 3,000 square-foot house in Oklahoma City (see below) has a verified average electric bill of \$60 per month, using a geothermal heat pump. This represents significant savings.
A system using horizontal ground loops will generally cost less than a system with vertical loops.
Geothermal heat pump installations in both new and existing homes can reduce energy consumption 25 to 75 percent compared to older or conventional replacement systems. Annual operating costs were also lowest with geothermal heat pumps. Add in the benefits of the desuperheater for hot water savings, and it's easy to see how a GHP system is the most efficient available.
Solar Energy for Home Heating
Energy that is received on the roof of a house is more than enough to supply the heating needs of the home. The energy reaching the earth from the sun ranges from 600 to 2000 BTUs per square foot per day (averaged over a year). It is a function of the latitude of the place. The amount of solar radiation reaching the earth is called the insolation. This is a short for incident solar radiation per day.
The earth revolves around the sun with its axis tilted toward the plane of rotation.
- In June, the North Pole is tilted toward the sun and the solar rays are incident perpendicularly. Therefore, the sun appears to be at a higher angle.
- In December, the North Pole is tilted away from the sun and therefore days are shorter and the solar rays are incident more obliquely, with lower energy flux (winter).

The sun also changes in position and angle from the earth during various times of the year.
Instructions: Press play to observe the movement of the sun as a function of the seasons.
Movement of the Sun with the Seasons
From June through December, the Sun's highest point in a given day moves lower and lower towards the horizon.
Active Solar Heating Systems
Solar heating systems are classified as “active” or “passive” solar heating systems, or a combination of both. We will first look at active systems.
Active solar heating systems are comprised of collectors, a distribution system, and a storage device.
Instructions: Click on the hot spots in the image below to find out more about the main components of an active solar heating system.
Active solar heating systems operate as follows:
- Flat plate collectors are usually placed on the roof or ground in the sunlight. The top or sunny side has a glass or plastic cover to let the solar energy in. The inside space is a black (absorbing) material to maximize the absorption of the solar energy.
- Cold water is drawn from the storage tank by pump #1 and is pumped through the flat plate collector mounted on the roof of the house.
- The water absorbs the solar energy and is returned back to the tank.
- Warm water from the tank is pumped by pump #2 though the heating coil.
- The fan blows air (from the room) over the heated coil, and the heated air then passes into the room and heats the room.
- Cold air sinks to the bottom and is recirculated over the heating coil.
Note: The standby electric coil is automatically turned on and provides the heat when the water temperature to the heating coil drops because of consecutive cloudy days.
Instruction : Click the “play” button to observe the operation of an Active Solar Heating System:
Operation of an Active Solar Heating System
Water from the storage tank is pumped up to the roof-mounted solar panels. The sun heats the water as it travels back to the water tank. The warm water from the tank is moved by a separate pump through a series of coils inside an air furnace. The furnace moves cool air past the coils to be heated and then distributed throughout the building.
Collector’s Efficiency is the ratio of solar radiation that is captured and transferred to the collector or heat transfer fluid.
The efficiency of a collector can be expressed as:
Typical collector efficiencies range from 50–70 percent.

Passive Solar Heating Systems
Passive systems do not use mechanical devices such as fans, blowers, or pumps to distribute solar heat from a collector. Instead, they take advantage of natural heat flow to distribute warmth. An example of a passive system for space heating is a sunspace or solar greenhouse.
Passive systems also make use of materials with large heat capacities (stone, water, or concrete) to store and deliver heat. These are called thermal masses.
Instructions: Click on the hot spots in the image below to see the essential elements of a passive solar system.
Passive systems can be categorized into three types:
- Direct Gain - Allows the solar energy to come in through the south-facing window panes.
- Indirect Gain - Allows the solar radiation to heat a wall and then the energy is slowly delivered into the interior of the house. Openings in the wall (called a Trombe Wall), as shown in the figure below, promote convective currents:
- Cold room air enters the space between the glass panel and the wall through the bottom opening.
- As this cold air gets heated, it rises to the top and comes in through the top opening.
- Greenhouse Addition - An attached sunspace and/or solar greenhouse heated by the solar energy - where some of the energy is used to grow the plants and some of it is used to heat the interior of the house.
These systems are shown below.

Costs and Benefits
It is usually most economical to design an active system to provide 40 to 80 percent of the home’s heating needs. Systems providing less than 40 percent of the heat needed for a home are rarely cost-effective, except when using solar air heater collectors that heat one or two rooms and require no heat storage.
A well-designed and insulated home that incorporates passive solar heating techniques will require a smaller and less costly heating system of any type, and may need very little supplemental heat other than solar.
The cost of an active solar heating system will vary. A simple window air heater collector can be made for a few hundred dollars. Commercial systems range from 30 to 80 dollars per square foot of collector area, installed. Usually, the larger the system, the less it costs per unit of collector area. Commercially available collectors come with warranties of 10 years or more, and should easily last decades longer.
Heating your home with an active solar energy system can significantly reduce your fuel bills in the winter. A solar heating system will also reduce the amount of air pollution and greenhouse gases.
Environmental Protection
Ways to Improve Energy Efficiency of Heating Systems
Instructions: Click on the hot spots in the image below to find out how you can improve the energy efficiency of a heating system.
Review and Extra Resources
Review Sheet Lesson 8 – Home Heating
- Home Heating Systems
- Most commonly used heating fuel
- Types of heating systems
- Operating principle of the various types of heating systems
- Advantages and Disadvantages of the various types of heating systems
- Heat pumps
- Operating principle
- Efficiency
- COP calculation when inside and outside temperatures are given. Remember to convert temperatures to K in these calculations.
- What happens when one temperature changes (either inside or outside) the COP?
- Geothermal heat pumps
- Operating principle
- Classification – Difference between open loop and closed loop, vertical and horizontal loops
- Benefits
- Passive and Active Solar Heating methods
- Ways to improve the energy efficiency of the heating systems
Test Yourself
The questions below are your chance to test and practice your understanding of the content covered in this lesson. In other words, you should be able to answer the following questions if you know the material that was just covered! If you have problems with any of the items, feel free to post your question on the unit message board so your classmates, and/or your instructor, can help you out!
- Compare and contrast the three conventional heating methods (forced air duct, hydronic floor, and baseboard heating systems).
- Describe any five methods (total) to reduce home heating/cooling costs, and explain how each step reduces the energy consumption.
- Explain the operation principle of a ground source heat pump. Explain the difference between an open-loop and a closed-loop GHP.
- What is the difference between active and passive heating systems?
- With a neat sketch, describe how an active solar heating system works.
- Describe any three passive heating methods.
- Explain how a geothermal heat pump works and why it is so efficient.
- Explain clearly how an air-to-air heat pump works. List the main components used in the heat pump.
Extra Resources
For more information on topics discussed in Lesson 8, see these selected references:
- Aubrecht, G.L. Energy. Englewood Cliffs, NJ: Prentice Hall, 1995.
- Christensen, J.W. Global Science: Energy Resources Environment. 4th ed. Dubuque, IA: Kendall/Hunt, 1996.
- Fay, J.A, and Golomb, D.S. Energy and the Environment. New York: Oxford University Press, 2002.
- Hinrichs, R.A. Energy. Philadelphia: Saunders College Publishers, 1992.
- Space Heating by Climate Zone
- Forced Air Furnace
- Bob Villa Home Improvement
- HomeTips
- Office of Energy Efficiency and Renewable energy
- Orange and Rockland
Lesson 8 Deliverables
Deliverable 1
You must complete a short quiz that covers the reading material in lesson 8. The Lesson 8 Quiz, can be found in the Lesson 8: Home Heating Systems module in Canvas. Please refer to the Calendar in Canvas for specific time frames and due dates.
Lesson 9: Home Cooling
The links below provide an outline of the material for this lesson. Be sure to carefully read through the entire lesson before returning to Canvas to submit your assignments.
Introduction
Welcome to Lesson 9!
Lesson 9 Objectives
Upon completing this lesson, you should be able to:
- explain the relationship between humidity and temperature;
- describe how an air conditioner works;
- describe different types of air conditioning systems;
- calculate the monetary savings when the efficiency of an air conditioner is improved.
Questions?
If you have any questions, please post them to the General Course Questions forum in located in the Discussions tab in Canvas. I will check that discussion forum daily to respond. While you are visiting the discussion board, feel free to post your own responses to questions posted by others - this way, you might help a classmate!
Humidity
Air is a mixture of several gases, including nitrogen, oxygen, and water vapor.
- The total air pressure exerted by a volume of air in a given container on that container is the sum of the individual (partial) pressures of these gases.
- The vapor pressure is the individual or partial pressure of the water vapor.
The warmer the air is, the more moisture it can hold. So its moisture holding capacity changes with temperature.
A Psychometric chart (pictured below) represents the moisture content of air at various temperatures. This chart shows that as the air temperature increases, the amount of moisture that can be held in dry air also increases.
- Dry bulb temperature: Temperature with no moisture in the air; known as “absolute air.”
- Dew point Temperature: Complete saturation – the maximum amount of water vapor that air can hold. Note that water vapor can carry more heat than air.

As we know, varying amounts of moisture (in the gaseous or vapor form) exist in the air. Absolute Humidity is the actual amount of moisture that is contained in air. It is represented in the formula below:
Relative humidity, in contrast, is the ratio of the amount of moisture in the air to the maximum amount of moisture the air can hold at a given temperature. It is represented in the formula below:

Example 1
Calculate the relative humidity of air when the air contains 0.002 lb of moisture per pound of dry air, while the maximum moisture air can hold at that temperature is 0.005 lb per lb of dry air.
Air is said to be saturated when the amount of water vapor in the air is the maximum possible at an existing temperature and pressure.
- Air is said to be saturated at 100 percent relative humidity when it contains the maximum amount of moisture possible at that specific temperature.
- Air holding half the maximum amount of moisture at a given temperature has a relative humidity of 50 percent.
When relative humidity reaches 100 percent or is saturated, moisture will condense, meaning the water vapor changes to liquid vapor.
Thus, the saturation level of air is related to the air's temperature. As air temperature increases (or becomes warmer), more water remains in a gas phase. As temperature decreases (or becomes colder), the water molecules slow down, and it is more likely that they will condense onto nearby surfaces.
Dew Point is the temperature at which air reaches 100 percent relative humidity. If the air is cooled below dew point, moisture in the air condenses.
Moisture will condense on a surface whose temperature is below the dew point temperature of the air next to it. For air at a given absolute humidity, the colder the surface, the higher the relative humidity next to that surface. So the coldest surface in a room is the place where condensation will probably occur first (called the first condensing surface).
Saturation is the maximum amount of water vapor in the air at an existing temperature and pressure. Air is said to be saturated at 100 percent relative humidity when it contains the maximum amount of moisture possible at that specific temperature.
Dew point is the temperature when air reaches 100% relative humidity.
Humidity and Condensation
A basement with a window leading outside at ground level contains normal, cool air. When the window is opened on a summer day, warm, moisture-rich air enters the basement and mixes with the cool air. This causes a buildup of moisture on the walls and floor, as well as the rest of the basement surfaces.
Questions:
1) Which air has the most amount of moisture?
- Warm outside air
- Cool inside air
- Combined inside and outside air
2) After the warm outside air mixes with the cool inside air, what happens?
- Saturation
- Condensation
- Convection
3) In the animation, which of the following is the first condensing surface?
- Walls and floor
- Ground
- Window
4) The temperature of the first condensing surface is:
- At the dew point
- Below the dew point
- Above the dew point
Answers:
- Warm outside air
- Condensation
- Walls and floor
- Below the dew point
Air Conditioning
Now we will look at how air conditioning systems work. With air conditioning, the adjustment of humidity is important because we always try to cool warm air inside the room.
When the temperature of the air decreases, the maximum amount of water the air can hold also decreases. So the relative humidity always increases. This is more conspicuous when the room air is humid or already saturated. When the saturated air is cooled in an air conditioner, it precipitates or condenses. Water can be seen dripping outside from an AC.
Humidity is generally maintained at about 50 percent. Too low or high humidity is very uncomfortable.
Air conditioning (A/C) involves cooling/heating and cleaning of air, plus controlling its moisture level or humidity to provide maximum indoor comfort.
- An air conditioner transfers heat energy from the inside of a room, or multiple rooms in a building, to the outside.
- The air conditioner does NOT transfer air from the inside of a room, or multiple rooms in a building, to the outside.
More specifically, refrigerant in the system absorbs the excess heat from the inside and is pumped through a closed system of piping to an outside coil. A fan blows outside air over the hot coil, transferring heat from the refrigerant to the outdoor air. Because the heat is removed from the indoor air, the indoor area is cooled.

How Air Conditioners Work
Contrary to what is generally assumed, outside air is not cooled inside the air conditioner and then supplied inside. Only heat energy is moved or pumped by the air conditioner from a low temperature environment (inside the building) to a high temperature environment (outside the building).
Instructions: Place your cursor over the image below to learn how an air conditioner works.
How an Air Conditioner Works
- The compressor in your outdoor unit compresses the refrigerant (or "Freon") by transferring the part of the electrical energy it consumes into a high-temperature, high-pressure gas.
- As that gas flows through the outdoor coil, it loses heat to the surroundings (because the refrigerant is at a higher temperature than the outside temperature).
- The cooled gas condenses from a liquid into a high temperature, high pressure liquid.
- This liquid refrigerant travels through copper tubing into the evaporator coil.
- In the evaporator coil, the refrigerant expands. Its sudden expansion turns the refrigerant into a low temperature, low pressure gas.
- This cool gas then absorbs heat from the air in the room, which is blown over the evaporator coil.
- The cooled air is distributed back through your room or multiple rooms.
- Meanwhile, the heat absorbed by the refrigerant is carried back outside through copper tubing and released into the outside air. So only the heat is transferred to the outside, not the air.
Instructions: Press the play button to observe an animated version of how an air conditioner works.
How an Air Conditioner Works
As described in the text above, the animation shows you the process.
The compressor in your outdoor unit compresses the refrigerant (or "Freon") by transferring the part of the electrical energy it consumes into a high-temperature, high-pressure gas. As that gas flows through the outdoor coil, it loses heat to the surroundings (because the refrigerant is at a higher temperature than the outside temperature).
The cooled gas condenses from a liquid into a high temperature, high pressure liquid. This liquid refrigerant travels through copper tubing into the evaporator coil. In the evaporator coil, the refrigerant expands. Its sudden expansion turns the refrigerant into a low temperature, low pressure gas.
This cool gas then absorbs heat from the air in the room, which is blown over the evaporator coil. The cooled air is distributed back through your room or multiple rooms. Meanwhile, the heat absorbed by the refrigerant is carried back outside through copper tubing and released into the outside air. So only the heat is transferred to the outside, not the air.
Types of Air Conditioners
Operating Principle
The basic types of air conditioners are room air conditioners, split-system central air conditioners, and packaged central air conditioners.
Room Air Conditioners
Room air conditioners cool rooms rather than the entire home. If they provide cooling only where they're needed, room air conditioners are less expensive to operate than central units, even though their efficiency is generally lower than that of central air conditioners.
Smaller room air conditioners (i.e., those drawing less than 7.5 amps of electricity) can be plugged into any 15- or 20-amp, 115-volt household circuit that is not shared with any other major appliances. Larger room air conditioners (i.e., those drawing more than 7.5 amps) need their own dedicated 115-volt circuit. The largest models require a dedicated 230-volt circuit.

Central Air Conditioners
Central air conditioners circulate cool air through a system of supply and return ducts. Supply ducts and registers (i.e., openings in the walls, floors, or ceilings covered by grills) carry cooled air from the air conditioner to the home. This cooled air becomes warmer as it circulates through the home; then it flows back to the central air conditioner through return ducts and registers.
A central air conditioner is either a split-system unit or a packaged unit.
Split System
In a split-system central air conditioner the main components include:
- an outdoor metal cabinet that contains the condenser and compressor;
- an indoor cabinet that contains the evaporator;
- in many split-system air conditioners, the indoor cabinet also contains a furnace or the indoor part of a heat pump. The air conditioner's evaporator coil is installed in the cabinet or main supply duct of this furnace or heat pump.
If your home already has a furnace but no air conditioner, a split-system is the most economical central air conditioner to install.

Packaged Units
The packaged central air conditioner is usually located outdoors and consists of one cabinet that contains the evaporator, condenser, and compressor. The cabinet is usually placed on a roof or on a concrete slab next to the house's foundation. The packaged air conditioner is connected to the indoor air supply and return ducts through the home's exterior wall or roof.
Since these air conditioners often include electric heating coils or a natural gas furnace, this combination of air conditioner and central heater eliminates the need for a separate furnace indoors. This type of air conditioner is used to cool and heat homes as well as small commercial buildings.

Air Conditioner Efficiency
Air conditioners are rated by the number of British Thermal Units (BTU) of heat they can remove per hour. Another common rating term for air conditioning size is the "ton," which is 12,000 BTU per hour.
Each air conditioner has an energy-efficiency rating that lists how many BTUs per hour are removed or “pulled out” for each watt of power it draws.
- The efficiency rating for room conditioners is the Energy Efficiency Ratio, or EER.
- The efficiency rating for central air conditioners, is the Seasonal Energy Efficiency Ratio, or SEER.
These ratings are posted on an Energy Guide Label, which must be conspicuously attached to all new air conditioners. Energy Star-labeled appliances mean that they have high EER and SEER ratings.

Room Air Conditioners—EER
Energy Efficient Ratio (EER) measures how efficiently a room air conditioner will operate at a specific outdoor temperature. The higher the EER, the more efficient the system.
The EER can be calculated using this equation:
Remember that the EER energy-efficiency rating lists how many BTUs per hour are removed or “pulled out” for each watt of power it draws. Room air conditioners generally range from 5,500 BTU per hour to 14,000 BTU per hour.
National appliance standards require room air conditioners built after January 1, 1990, to have an EER of 8.0 or greater. A room air conditioner with an EER of at least 9.0 is recommended for milder climates, whereas in hotter climates an EER over 10 is preferred.
The Association of Home Appliance Manufacturers reports that the average EER of room air conditioners rose 47 percent from 1972 to 1991. If a 1970s-vintage room air conditioner with an EER of 5 is replaced with a new one with an EER of 10, air conditioning energy costs will be cut by 50 percent.
Central Air Conditioners—SEER
Seasonal Energy Efficiency Ratio (SEER) measures how efficiently a central air conditioner will operate at a specific outdoor temperature. The higher the SEER, the more efficient the system.
The SEER can be calculated using this equation:
Again, the SEER energy-efficiency rating lists how many BTUs per hour are removed or “pulled out” for each watt of power it draws.
National minimum standards for central air conditioners require a SEER of 9.7 and 10.0, for single-package and split-systems, respectively. But you do not need to settle for the minimum standard—there is a wide selection of units with SEERs reaching nearly 17.
Before 1979, the SEERs of central air conditioners ranged from 4.5 to 8.0. Replacing a 1970s-era central air conditioner with a SEER of 6 with a new unit having a SEER of 12 will cut your air conditioning costs in half. Today's best air conditioners use 30% to 50% less energy to produce the same amount of cooling as air conditioners made in the mid 1970s. Even if your air conditioner is only 10 years old, you may save 20 to 40 percent of your cooling energy costs by replacing it with a newer, more efficient model.
In general, new air conditioners with higher EERs or SEERs have higher price tags. However, the higher initial cost of an energy-efficient model will be recovered several times during its lifespan. Some utility companies encourage the purchase of a more efficient air conditioner by offering incentives. Buy the most efficient air conditioner you can afford, especially if you use (or think you will use) an air conditioner frequently and/or if your electricity rates are high.
Example 1
Calculate the power consumption of 5000 BTUs/h room air conditioner with an Energy Efficiency Ratio (EER) of 8.
Solution: We know that
Given that the AC pulls out 5,000 BTUs per hour and its EER = 8, we have
Therefore, its wattage =
Example 2
Air Conditioner Efficiency
An old room air conditioner with an EER 6 was replaced by a new air conditioner with an EER of 10.0. The power consumption with the old air conditioner was 1000 W. Calculate the power consumption of the new air conditioner.
We have an old air conditioner with an EER of 6. EER is basically Energy Efficiency Ratio which is given by number of Btus the air conditioner is pulling out per hour divided by watts of power consumed.
And in this problem we are given the EER as 6 and we need to calculate the number of Btus it is capable of pulling out. We also know that it is consuming a thousand watts of power. So we need to calculate these Btus per hour that it is pulling out. So we can calculate the x, unknown, by multiplying thousand by 6 and we get six thousand Btus per hour.
The room size is not changing but we are just replacing the old air conditioner with the new one. The new EER is 10, the new air conditioner EER is 10 and it is still pulling 6000 Btus per hour out and the new one, how many watts of power does it consume?
To calculate the power, we have 6000 Btu/hour load and we know the EER, which is 10, so dividing by this we get the power which is 600 watts.
What we are doing here is, by replacing the old air conditioner which used to consume 1000 watts with this new air conditioner which has an EER of 10, we are reducing the power consumption to 600 watts.
Example 3
An old room air conditioner with an EER 6 was replaced by a new air conditioner with an EER of 10.0. The room requires 0.75 tons of air conditioning. Calculate the difference in power consumption between the old and new air conditioner.
Ok. An air conditioner, an old one, has an EER of 6. And this was replaced by an EER of 10 air conditioner. The room basically is required to pull out 0.75 or three quarters of a ton. You should remember that each ton, one ton of refrigeration or air conditioning is equal to, basically pulling out 12,000 Btus every hour. So it is pulling out ¾ of a ton, which happens to be 0.75 times 12,000 Btus per hour. That is 9000 Btus per hour.
So to pull out 9,000 Btus per hour with an air conditioner of EER equal to 6. So we are pulling out 9,000 Btus/hr and what is the wattage? Or watts? And wattage is equal to now, 9,000 divided by 6. That happens to be 1500 watts.
Ok. Now if we were to replace this with an EER of 10 (air conditioner with 10). Now it still has to pull out 9000 Btus/hr and what would be the wattage? So watts equal to 9000 Btus/hr divided by 10, that would be 900 watts.
So by replacing this air conditioner, which used to consume 1500 watts, by an energy efficient air conditioner with an EER of 10, we are able to bring down the power consumption to 900 watts. So that is a savings of 40% right there.
Example 4
What is the annual cost for operating a 3 ton central air conditioner with an SEER of 10? Assume that the AC operates 2,000 hours in a year and the cost of electricity is 9.2 cents per kWh.
Solution:
Recall that 1 ton =12,000 BTUs/h. Therefore, the cooling load is 3 x 12,000 BTUs/h = 36,000 BTUs/h
Recall also that 1,000 W = 1 kW. Therefore, power consumption = 3.6 kW.
Energy = Power x Time of Usage
= 3.6 kW x 2,000 h/year = 7,200 kWh/year.
Annual Cost = Units of energy x price per unit
Example 5
Suppose you are comparing two air conditioners, both of which last for 10 years. The least efficient air conditioner draws 775 W of power. The most efficient one uses 700 Watts. Assuming that the air conditioner operates 2,400 hours annually and that the local energy costs 0.08 per kWh, how much money and energy can you save with the energy-efficient model? How much money are you willing to pay extra for the energy-efficient model?
Ok. Here we are trying to compare two air conditioners, both of which are going to last ten years. One consumes less power and the other one high power. They both operate for 2,400 hours annually, so we have the power, and we have the time of usage data. So we need to calculate how much energy each of these will consume.
So life of one, our first air conditioner is 10 years and the second one is 10 years. Power is 775, the least efficient one, watts, and the other one is 700 watts. We have the time of usage. Time of usage is given as 2,400 hours and this one is also 2,400 hours.
| Category | Air conditioner 1 | Air conditioner 2 |
|---|---|---|
| Life | 10 years | 10 years |
| Power | 775 watt | 700 watt |
| Time | 2,400 hours | 2,400 hours |
So the energy consumed is given by power multiplied by time of usage. So in this case it would be 775 watts multiplied by 2,400 hours and that will be 1,860,000 watt hours.
And for this air conditioner it would be 700 watts times 2,400 hours. That will be 1,680,000 watt hours.
So we need to convert this into kilowatt hours because we buy by kilowatt hours. So dividing this by a thousand and dividing here by a thousand, we get kilowatt hours. So this air conditioner will consume 1860 kilowatt hours per year. This air conditioner will consume 1680 kilowatt hours per year.
| Air conditioner 1 | Air conditioner 2 |
|---|---|
So in 10 years, the energy consumption is 18,600 kWh. This is simply multiplying yearly consumption by 10 years. And for the efficient one it would be 1680 kwh times 10 years which would be 16,800 kwh.
| Time | Air conditioner 1 | Air conditioner 2 |
|---|---|---|
| In 10 years... |
We know the price of each of these. You know, each of the kilowatt hours. That is, it is sold at the rate of 0.08 dollars per kilowatt hour. So when you multiply that by 0.08 both sides, the cost to operate this one would be \$1,488 dollars and this one would be \$1,344 dollars. So the difference is, \$144 which means the least efficient one basically cost \$144 more and the best one would be, even if the best one is priced \$144 more, it would work out to be the same amount in the long run over 10 years. But we would be helping the environment by not burning the difference between these two kilowatt hours. You know, a couple of thousand kilowatt hours over 10 years. That would be a help for the environment.
Example 6
If the owner bought an air conditioner with an SEER of 15, which costs $500 more, instead of the model in the previous Illustration (7-3), what is the pay back period?
The power consumption of this new model is
Air Conditioner Sizing
Important Factors in Sizing Air Conditioners
An air conditioner's efficiency, performance, durability, and initial cost depends on matching its size to the following factors:
- How large is your home and how many windows does it have?
- How much shade is on your home's windows, walls, and roof?
- How much insulation is in your home's ceiling and walls?
- How much air leaks into your home from the outside?
- How much heat do the occupants and appliances in your home generate?
A system that is too large will cool the room or home quickly but will not provide the comfort that is needed, because the cool air reaches the thermostat quickly and the thermostat sends a signal to shut the system before the relative humidity is reduced to a comfortable level. As the cold air is distributed in the room, the thermostat realizes that the temperature is not at the set point and then turns on the air conditioner. This quick cycling of the unit (start and stop) reduces the lifespan of the equipment and increases the energy consumption. A larger air conditioner also consumes more energy.
A system that is small will have to work all the time and is not energy efficient. So the right size is very important for energy efficiency.
To determine the size air conditioner needed, follow three steps:
Step 1: Determine the square footage of the area to be cooled, by multiplying a rectangular or square room’s length by its width.
Step 2: Determine the correct cooling capacity - measured in British thermal units (BTUs) per hour - using the square footage and the chart below:
| Area To Be Cooled (square feet) | Capacity Needed (BTUs per hour) |
|---|---|
| 100 to 150 | 5,000 |
| 150 to 250 | 6,000 |
| 250 to 300 | 7,000 |
| 300 to 350 | 8,000 |
| 350 to 400 | 9,000 |
| 400 to 450 | 10,000 |
| 450 to 550 | 12,000 |
| 550 to 700 | 14,000 |
| 700 to 1,000 | 18,000 |
| 1,000 to 1,200 | 21,000 |
| 1,200 to 1,400 | 23,000 |
| 1,400 to 1,500 | 24,000 |
| 1,500 to 2,000 | 30,000 |
| 2,000 to 2,500 | 34,000 |
Step 3: Make any adjustments for the following circumstances:
- If the room is heavily shaded, reduce capacity by 10 percent.
- If the room is very sunny, increase capacity by 10 percent.
- If more than two people regularly occupy the room, add 600 BTUs for each additional person.
- If the unit is used in a kitchen, increase capacity by 4,000 BTUs.
- Consider where you install the unit. If you are mounting an air conditioner near the corner of a room, look for a unit that can send the airflow in the right direction.
Natural Cooling
Energy Savings by Naturally Cooling Your Home
Keeping cool indoors when it is hot outdoors is a problem. The sun beating down on the homes causes indoor temperatures to rise to uncomfortable levels. Air conditioning provides some relief. But the initial costs of installing an air conditioner and the electricity costs to run it can be high. In addition, conventional air conditioners use refrigerants made of chlorine compounds, suspected contributors to the depletion of the ozone layer and global warming. But there are alternatives to air conditioning.
An alternative way to maintain a cool house or reduce air-conditioning use is natural (or passive) cooling. Passive cooling uses non-mechanical methods to maintain a comfortable indoor temperature.
Specific methods to prevent heat gain include:
- reflecting heat (i.e., sunlight) away from your house;
- blocking the heat;
- removing built-up heat
- reducing or eliminating heat-generating sources in your home.
Reflecting Heat Away
Dull, dark-colored home exteriors absorb 70 to 90 percent of the radiant energy from the sun that strikes the home's surfaces. Some of this absorbed energy is then transferred into a home by way of conduction, resulting in heat gain. In contrast, light-colored surfaces effectively reflect most of the heat away from a home.
Instructions: Place your cursor over the numbers of the image below to learn more about reflecting heat away.
Reflecting Heat Away
The following are passive methods for reflecting unwanted heat energy away from your home.
- The roof, made out of traditional roofing materials, allows about 1/3 of unwanted heat that builds up in the home. Unlike most light-colored surfaces, even white asphalt and fiberglass absorb 70 percent of the solar radiation. One solution is to apply a reflective coating to your existing roof. Two standard roofing coatings are marketed primarily for mobile homes and recreational vehicles. Both are waterproof and have reflective properties.
- Wall color is not as important as roof color, but it does affect heat gain somewhat. White exterior walls absorb less heat than dark walls. And light, bright walls increase the longevity of siding, particularly on the east, west, and south sides of the house.
- Windows permit about 40 percent of the unwanted heat that builds up in the home. Reflective window coatings are plastic sheets treated with dyes or thin layers of metal. Besides keeping your house cooler, these reflective coatings cut glare and reduce fading of furniture, draperies, and carpeting. Two main types of coatings include sun-control films and combination films.
- Sun control films are best for windows in warmer climates because they can reflect as much as 80 percent of the incoming sunlight. Many of these films are tinted, however, and tend to reduce light transmission as much as they reduce heat, thereby darkening the room.
- Combination films are best for climates that have both hot and cold seasons. They allow some light into a room but they also let some heat in and prevent interior heat from escaping.
Blocking the Heat
Two excellent methods to block heat are insulation and shading.
Insulation helps keep your home comfortable and saves money on mechanical cooling systems such as air conditioners and electric fans.
- Shading devices block the sun's rays, absorb or reflect the solar heat, and reduce indoor temperatures by as much as 20° F. Shading can be provided by trees and other vegetation or exterior or interior shades.
- Exterior shades are generally more effective than interior shades at controlling heat gain because they block sunlight before it enters windows. Exterior shading devices include awnings, louvers, shutters, rolling shutters and shades, and solar screens.
- When deciding which devices to use and where to use them, consider whether you are willing to open and close them daily or just put them up for the hottest season. You also want to know how they will affect ventilation.
Instructions: Place your cursor over the numbers of the image below to learn more about using insulation and shading to block heat.
Blocking the Heat
The following are passive methods for blocking unwanted heat energy from your home.
- Low ground cover such as grass, small plants, and bushes can also be very effective in cooling. A grass-covered lawn is usually 10 degrees F (6 degrees C) cooler than bare ground in the summer. If you are in an arid or semiarid climate, consider native ground covers that require little water.
- Deciduous trees that lose their leaves in the fall help cut cooling energy costs the most. When selectively placed around a house, they provide excellent protection from the summer sun and permit winter sunlight to reach and warm your house. The height, growth rate, branch spread, and shape are all factors to consider in choosing a tree. Vines are a quick way to provide shading and cooling. Grown on trellises, vines can shade windows or the whole side of a house.
- Solar screens resemble standard window screens except they keep direct sunlight from entering the window, cut glare, and block light without blocking the view or eliminating air flow. They also provide privacy by restricting the view of the interior from outside your house. Solar screens come in a variety of colors and screening materials to compliment any home. Although do-it-yourself kits are available, these screens will not last as long as professionally built screens.
- The attic is a good place to start insulating because it is a major source of heat gain. Adequately insulating the attic protects the upper floors of a house. Recommended attic insulation levels depend on where you live and the type of heating system you use. For most climates, you want a minimum of R-30. In climates with extremely cold winters, you may want as much as R-49.
- Weatherization measures such as insulating, weather-stripping, and caulking help seal and protect your house against the summer heat, in addition to keeping out the winter cold. Although unintentional infiltration of outside air is not a major contributor to inside temperature, it is still a good idea to keep it out. Outside air can infiltrate your home around poorly sealed doors, windows, electrical outlets, and trough openings in foundations and exterior walls.
- Draperies and curtains made of tightly woven, light-colored, opaque fabrics reflect more of the sun's rays then they let through. The tighter the curtain is against the wall around the window, the better it will prevent heat gain. Two layers of draperies improve the effectiveness of the draperies' insulation when it is either hot or cold outside.
- Landscaping is a natural and beautiful way to shade your home and block the sun. A well-placed tree, bush or vine can deliver effective shade and add to the aesthetic value of your property. When designing the landscaping, use of plants that are native to the local area survive with minimal care.
- Shutters are movable wooden or metal coverings that, when closed, keep sunlight out. Shutters are either solid or slatted with fixed or adjustable slats. Besides reducing heat gain, they can provide privacy and security. Some shutters help insulate windows when it is cold outside.
- Awnings are very effective because they block direct sunlight. They are usually made of fabric or metal and are attached above the window and extend down and out. A properly installed awning can reduce heat gain up to 65 percent on southern windows and 77 percent on eastern windows. A light-colored awning does double duty by also reflecting sunlight.
- Wall insulation is not as important for cooling as attic insulation because outdoor temperatures are not as hot as attic temperatures. Also, floor insulation has little or no effect on cooling.
- Venetian blinds, although not as effective as draperies, can be adjusted to let in some light and air while reflecting the sun's heat. Some newer blinds are coated with reflective finishes. To be effective, the reflective surfaces must face the outdoors.
- Besides providing shade, trees and vines create a cool microclimate that dramatically reduces the temperature (by as much as 9 degrees F [5 degrees C]) in the surrounding area. During photosynthesis, large amounts of water vapor escape through the leaves, cooling the passing air. And the generally dark and coarse leaves absorb solar radiation.
Removing Built-Up Heat
Nothing feels better on a hot day than a cool breeze. Encouraging cool air to enter your house forces warm air out, keeping your house comfortably cool. However, this strategy only works when the inside temperature is higher than the outside temperature.
Natural ventilation maintains indoor temperatures close to outdoor temperatures and helps remove heat from your home. But only ventilate during the coolest parts of the day or night, and seal off your house from the hot sun and air during the hottest parts of the day.
The climate you live in determines the best ventilation strategy.
| Climate | Strategy |
|---|---|
| Cool nights and very hot days | Let night air cool the house. A well-insulated house will gain only 1° F (0.6° C) per hour if the outside temperature is 85° to 90° F (29° to 32° C). By the time the interior heats up, the outside air should be cooler and can be allowed indoors. |
| Daytime breezes | Open windows on the side from where the breeze is coming and on the opposite side of the house. Keep interior doors open to encourage whole-house ventilation. If your location lacks consistent breezes, create them by opening windows at the lowest and highest points in your house. This natural "thermosiphoning," or "chimney," effect can be taken a step further by adding a clerestory or a vented skylight. |
| Hot and humid where temperature swings between day and night are small | Ventilate when humidity is not excessive. Ventilating your attic greatly reduces the amount of accumulated heat, which eventually works its way into the main part of your house. Ventilated attics are about 30° F (16° C) cooler than unventilated attics. Properly sized and placed louvers and roof vents help prevent moisture buildup and overheating in your attic. |
Reducing Heat-Generating Sources
Often-overlooked sources of interior heat gain are lights and household appliances, such as ovens, dishwashers, and dryers.
| Heat generating light or appliance | Reducing Heat |
|---|---|
| Incandescent Lamps | Use only when necessary and take advantage of daylight to illuminate house. Also consider switching to fluorescent lamps, which use 75% less energy than incandescent lamps and emit 90% less heat for the same amount of light. |
| Kitchen Appliances | Use in the morning or late evening when extra heat can be tolerated. Consider cooking on an outside grill or using the microwave oven, which does not generate as much heat and uses less energy than a gas or electric range. |
| Laundry Appliances | Seal off laundry room and water heater from rest of room. Purchase new energy-efficient appliances that generate less heat and use less energy. Look for the Energy Guide label indicating the annual estimated cost for operating the appliance or a standardized efficiency ratio, and use this information to select the most efficient model for your needs. |
See Resources document for more information on energy-efficient lighting and appliances.
Saving Energy
Using any or all of the strategies just discussed will help keep you cool. Even if you use air conditioning, many of these strategies, particularly reflecting heat and shading, will help reduce the energy costs of running an air conditioner.
However, adopting all of these strategies may not be enough. Sometimes you need to supplement natural cooling with mechanical devices. Fans and evaporative coolers can supplement your cooling strategies and cost less to install and run than air conditioners.
Ceiling fans make you feel cooler. Their effect is equivalent to lowering the air temperature by about 4° F (2° C). Evaporative coolers use about one-fourth the energy of conventional air conditioners, but are effective only in dry climates.
Environmental Protection
If your home has Central Air Conditioning:
- Set your thermostat at 78ºF or higher. Each degree setting below 78 ºF will increase your energy consumption by approximately 8 percent.
- Use bath and kitchen fans sparingly when the air conditioner is operating.
- Inspect and clean both the indoor and outdoor coils. The indoor coil in your air conditioner acts as a magnet for dust because it is constantly wetted during the cooling season. Dirt build-up on the indoor coil is the single most common cause of poor efficiency. The outdoor coil must also be checked periodically for dirt build-up, and cleaned if necessary.
- Check the refrigerant charge. The circulating fluid in your air conditioner is a special refrigerant gas that is put in when the system is installed. If the system is overcharged or undercharged with refrigerant, it will not work properly. You may need a service contractor to check the fluid and adjust it appropriately.
- Reduce the cooling load by using cost-effective conservation measures. For example, effectively shade east and west windows. When possible, delay heat-generating activities, such as dishwashing, until the evening on hot days.
- Keep the house closed tight during the day over most of the cooling season. Don't let in unwanted heat and humidity. If practical, ventilate at night either naturally or with fans.
- Don’t use a dehumidifier: Try not to use a dehumidifier at the same time your air conditioner is operating. The dehumidifier will increase the cooling load and force the air conditioner to work harder.
If your home has Room Air Conditioning:
- Keep the unit leveled when installing, so that the inside drainage system and other mechanisms operate efficiently. If possible, install the unit in a shaded spot on your home's north or east side. Direct sunshine on the unit's outdoor heat exchanger decreases efficiency by as much as 10 percent. You can plant trees and shrubs to shade the air conditioner, but do not block the airflow.
- Don't place lamps or televisions near your air-conditioner's thermostat. The thermostat senses heat from these appliances, which can cause the air conditioner to run longer than necessary.
- Set your air conditioner's thermostat as high as is comfortably possible in the summer. The less difference between the indoor and outdoor temperatures, the lower your overall cooling bill will be. And don't set your thermostat at a colder setting than normal when you turn on your air conditioner. It will not cool your home any faster and could result in excessive cooling and, therefore, unnecessary expense.
- Set the fan speed on high, except on very humid days. When humidity is high, set the fan speed on low for more comfort. The low speed on humid days will cool your home better and will remove more moisture from the air because of slower air movement through the cooling equipment. Consider using an interior fan in conjunction with your window air conditioner to spread the cooled air more effectively through your home without greatly increasing electricity use.
- Ensure proper maintenance of your air conditioner to save energy. Be sure to do the following:
- At the start of each cooling season, inspect the seal between the air conditioner and the window frame to ensure it makes contact with the unit's metal case. Moisture can damage this seal, allowing cool air to escape from your house.
- Check your unit's air filter once a month, and clean or replace filters as necessary. Keeping the filter clean can lower your air conditioner's energy consumption by 5 percent to 15 percent.
- Occasionally check the unit's drain channels. Clogged drain channels prevent a unit from reducing humidity, and the resulting excess moisture may discolor walls or carpet.
Review and Extra Resources
Review Sheet Lesson 9 – Home Cooling
- Humidity
- Relative Humidity- simple calculation of RH
- What happens to relative humidity when the temperature of air changes
- Air Conditioner
- Operating principle of Air Conditioner
- Components of air conditioners – What happens at each component?
- Types of air conditioners, which ones are more efficient?
- Terms used to measure efficiency (EER and SEER) and their meaning
- Factors affecting the size of a room air conditioner
- Energy Savings
- Natural Cooling
- Payback period calculation using EER
- Tips for efficient AC operation and saving money
Test Yourself
The questions below are your chance to test and practice your understanding of the content covered in this lesson. In other words, you should be able to answer the following questions if you know the material that was just covered! If you have problems with any of the items, feel free to post your question on the unit message board so your classmates, and/or your instructor, can help you out!
Short Answer Questions
- Define Relative Humidity.
- Explain with a sketch, the four main components of an air conditioner and their function.
- List the two main types of central air conditioner systems, and explain the difference between the two types.
- What are the main factors to be considered in sizing a room air conditioner?
- What are natural (passive) ways in which you can reduce your cooling costs?
- Define EER and SEER.
Problems for Practice
- A contractor says the home requires a 5 ton air conditioning system. How many BTUS does this system pull out each hour?
- John Jankomsky has an air conditioner that is rated at 10,000 BTUs/h with an EER of 10. What is the power consumption of the air conditioner?
- Your old high school pal, Mike Errington, wants to upgrade an old 1976 vintage room air conditioner that is believed to operate at an EER of 5.5. He is considering a room air conditioner with an EER of 11. He wants to know by what percentage his electricity consumption would reduce. Can you help him with the data given, or not?
- Suppose you are comparing two air conditioners, both of which last for 10 years. The least efficient air conditioner draws 775 W of power. The most efficient one uses 700 Watts. Assuming that the air conditioner operates 2,000 hours annually and that the local energy cost is 0.09 per kWh, can you save any money and energy with the energy efficient model? If so, how much? If the energy efficient model costs $50 more than the least energy efficient model, would you buy the more energy efficient model? Justify your answer quantitatively.
Extra Resources
For more information on topics discussed in Lesson 9, see these selected references:
- How Stuff Works
- Comfort, Air Quality, and Efficiency by Design, Manual RS, Air Conditioning Contractors of America (ACCA), 1999. 80 pp.
- Cooling and Heating Load Calculation Principles, American Society of Heating, Refrigerating, and Air-Conditioning Engineers, Inc. (ASHRAE), 1998. 248 pp.
- Bob Villa
- Cooling Your Home Naturally, US Department of Energy report, CH10093-2221-FS 186, 1994, 8 pp.
- Energy Efficient Air Conditioning, US Department of Energy report, CH10099-379-FS 206, 1999, 8 pp.
- Cooling Your Home with Fans and Ventilation, US Department of Energy report, DOE/GO-10200101278-379-PS 228, 2001, 8 pp.
- Energy Star
Lesson 9 Deliverable
Deliverable 1
You must complete a short quiz that covers the reading material in lesson 9. The Lesson 9 Quiz, can be found in the Lesson 9: Home Cooling module in Canvas. Please refer to the Calendar in Canvas for specific timeframes and due dates.
Lesson 10: Windows
The links below provide an outline of the material for this lesson. Be sure to carefully read through the entire lesson before returning to Canvas to submit your assignments.
Introduction & Checklist
Welcome to Lesson 10!
Lesson 10 Objectives
Upon completing this lesson, you should be able to:
- explain how windows work;
- explain the mechanisms of heat loss through windows;
- list important factors in selecting windows;
- calculate pay-back period when replacing with energy-efficient windows.
Checklist for Lesson 10
Here is your "to do" list for this week.
| Step | Activity | Access / Directions |
|---|---|---|
| 1 | Read the online lesson | Lesson 10 - Windows |
| 2 | Review | Lesson 10 - Review and Extra Resources (supplemental materials that are optional...but informative!). |
| 3 | Take | Lesson 10 - Quiz (graded). The quiz is available in Canvas. |
See the Calendar tab in Canvas for due dates/times.
Questions?
If you have any questions, please post them to the General Course Questions forum in located in the Discussions tab in Canvas. I will check that discussion forum daily to respond. While you are visiting the discussion board, feel free to post your own responses to questions posted by others - this way, you might help a classmate!
Windows and Heat Loss
Windows typically occupy about 15 to 20 percent of the surface area of the walls. Windows not only add aesthetic looks and often a very important aspect of a home, but also a very significant component of home heating and cooling costs. Windows lose more heat per square foot of area in winter and gain more heat in summer than any other surface in the home.
We already discussed in Lesson 5 that simple glass (1/8th inch) has a very low R-value (0.03). So even if the walls are well insulated to an R-value of about 13 to 19 and the windows have poor R-value, most of the heat escapes through the windows and the purpose of having a well insulated wall is lost.
It is estimated that in 1990 alone, the energy used to offset unwanted heat losses and gains through windows in residential and commercial buildings cost the United States \$20 billion (one-fourth of all the energy used for space heating and cooling). However, when properly selected and installed, windows can help minimize a home's heating, cooling, and lighting costs.
Heat Loss Through Windows
Instructions: Click the play button to see how heat loss occurs through a window. (21 seconds)
Warm inside air gives up energy through the window and becomes cold, sinking to the bottom of the room. Cold outside air hits the window pane, picks up energy, and then warm air rises. This is how heat loss occurs through a window.
Although energy is spent heating the air in the room, windows can make the temperatures uncomfortable. However, by making the windows efficient, a significant amount of the energy and money can be saved.
Here is a graph that compares heating costs for different types of windows. The figures are based on a typical home in Boston, MA, a relatively heating intensive place.
| Window Type | Heating Cost ($) |
|---|---|
| Single Pane, Clear Glass, Aluminum Frame | 875 |
| Single Pane, Tinted, Aluminum Frame | 650 |
| Double Pane, Clear Glass, Wood/Vinyl Frame | 600 |
| Double Pane, Clear Glass, Low SHGC, Low -e Coating, Wood/Vinyl Frame | 575 |
Similarly, poor windows allow the solar energy to penetrate through the windows and heat the space. The incoming solar radiation consists of infrared (IR), ultraviolet (UV), and visible waves.
The IR radiation, which is also called heat radiation, heats the space excessively and adds to the air conditioning in the summer time. Therefore, energy efficient windows are critical in summer time or even in places where the cooling requirement is high.
Instructions: Click the “play” button to observe the effects of solar energy on windows. (13 seconds)
A cross-sectional view of a room has a window on the left wall and an air conditioner on the right wall. The sunlight coming through the window heats the room until the temperature around the air conditioner rises. When it does, the air conditioner turns on and cools the room by moving the heat back outside. The process repeats itself as long as the sun heats the room through the window.
Here is a graph that compares cooling costs for different types of windows. The figures are based on a typical home in Phoenix, AZ.
| Window Type | Cooling Cost |
|---|---|
| Single Pane, Clear Glass, Aluminum Frame | $800 |
| Single Pane, Tinted, Aluminum Frame | $750 |
| Double Pane, Clear Glass, Wood/Vinyl Frame | $675 |
| Double Pane, Clear Glass, Low SHGC, Low -e Coating, Wood/Vinyl Frame | $550 |
Factors in Window Selection, page 1
The National Fenestration Rating Council (NFRC) developed an energy performance label that helps to determine how well a window performs the functions of helping to cool a building in the summer, warm a building in the winter, keep out wind, and resist condensation.
By using the information contained on the label, builders and consumers can reliably compare one product with another, and make informed decisions about the windows, doors, and skylights they buy. NFRC adopted a new energy performance label in 1998. It lists the manufacturer, describes the product, provides a source for additional information, and includes ratings for one or more energy performance characteristics.
NFRC rates all products in two standard sizes so that consumers and others can be sure they are comparing products of the same size. There are three factors that will be listed on the label with some additional information. These factors are U factor, Visible Transmittance (VT) and Solar Heat Gain Coefficient (SHGC).

U-Factor or Value
U-factor measures how well a product prevents heat from escaping. The rate of heat loss is indicated in terms of the U-factor (U-value) of a window assembly.
- U-Factor ratings generally fall between 0.20 and 1.20.
- The ratings are based on an outdoor temperature of 0oF (-18oC) and an indoor temperature of 70oF (21oC)
- Most window manufacturers label their windows with a U-value (conductance of heat, Btu/h °F ft 2).
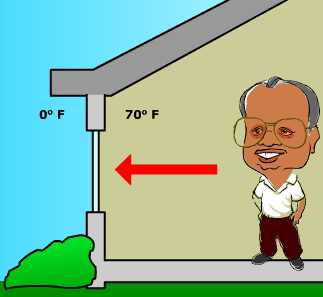
U-values are the reciprocals of R-values (h °F ft 2/Btu).
- The lower the U-value, the less heat is lost through the window.
- The lower the U-value, the greater a window's resistance to heat flow and the better its insulating value, which is indicated by the R-value.
Thus, the U-value is the inverse of the R-value or:
Some manufacturers rate thermal performance using R-Value. For example, an R-factor of 4.0
is the same as a U-Factor of 0.25.
The overall, "total," or "whole window" U-Factor of any window depends on the type of glazing, frame materials and size, glazing coatings, and type of gas (air, or inert argon or krypton) between the panes. Some typical U-, and R- Factor ranges for different window assemblies are shown in the table below:
| Window Assembly | U-Factor | R-Value |
|---|---|---|
| Single Glazed | 0.91–1.11 | 1.1–0.9 |
| Double Glazed | 0.43–0.57 | 2.3–1.7 |
| Triple Glazed | 0.15–0.33 | 6.7–3.3 |
Factors in Window Selection, page 2
Solar Heat Gain Coefficient
Solar Heat Gain Coefficient (SHGC) measures how well a window blocks heat from the sunlight.
- The SHGC is the fraction of incident solar radiation admitted through a window, both directly transmitted, and absorbed and subsequently released inward.
- SHGC is expressed as a number between 0 and 1.
- The lower a window's solar heat gain coefficient, the less solar heat it transmits.
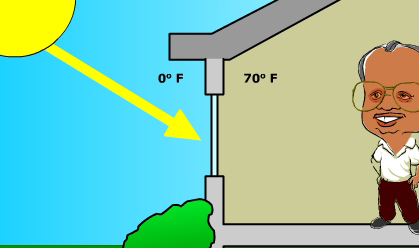
Visible Transmittance
Visible Transmittance (VT) measures how much visible light comes through a window.
- The visible transmittance is an optical property that indicates the amount of visible light transmitted.
- VT is expressed as a number between 0 and 1.
- The higher the VT, the more light is transmitted.
Visible Transmittance
The scenario illustrating Visible Transmittance is of Dr. Pisupati lying in bed on a sunny day with his dog Buddy on the floor next to him. The blinds on the nearby window are shut, making the room too dark to see. He doesn't know where Buddy is because the room is so dark, so he opens the blinds to let light into the room. When the sunlight enters the room, he is able to see that Buddy is on the floor next to him.
The light-to-solar gain ratio(LSGR) provides a gauge of the relative efficiency of different glass types in transmitting daylight while blocking heat gains. It is determined by the ratio between VT and SHGC.
The higher the ratio number, the brighter the room is without adding excessive amounts of heat.
The table below lists typical SHGC, VT, and LSGR values for different types of glass according to:
- Total Window
- Center of Glass (in parentheses)
| Window and Glazing Types | SHGC (0-1 scale) |
VT (0-1 scale) |
LSGR ( SHGC:VT) |
|---|---|---|---|
| Single-glazed, clear | 0.79 (0.86) | 0.69 (0.90) | 0.87 (1.04) |
| Double-glazed, clear | 0.58 (0.76) | 0.57 (0.81) | 0.98 (1.07) |
| Double-glazed, bronze | 0.48 (0.62) | 0.43 (0.61) | 0.89 (0.98) |
| Double-glazed, spectrally selective | 0.31 (0.41) | 0.51 (0.72) | 1.65 (1.75) |
| Double-glazed, spectrally selective | 0.26 (0.32) | 0.31 (0.44) | 1.19 (1.38) |
| Triple-glazed, new low-e | 0.37 (0.49) | 0.48 (0.68) | 1.29 (1.39) |
The following two parameters are not required to be reported on NFRC label, but are optional.
Air Leakage
Air Leakage (AL) is indicated by an air leakage rating expressed as the equivalent cubic feet of air passing through a square foot of window area (cfm/sq ft). Heat loss and gain occur by infiltration through cracks in the window assembly, by convection. The lower the AL, the less air will pass through cracks in the window assembly.
Condensation Resistance
Condensation Resistance (CR) measures the ability of a product to resist the formation of condensation on the interior surface of that product. The higher the CR rating, the better that product is at resisting condensation formation. While this rating cannot predict condensation, it can provide a credible method of comparing the potential of various products for condensation formation. CR is expressed as a number between 0 and 100.
Instructions: For each of the following, calculate the R-value and LSG. (Round your answers up to two decimal places.) After you enter your answers in the boxes below, check your work by clicking on the “check” buttons below.
Click here to open a text description of the Calculating R-Value and LSGR activity
Calculating R-Value and LSG
Based on the following energy performance ratings, calculate the R-Value and LSGR for each.
- Window #1
- U-Factor: 0.30
- Solar Heat Gain Coefficient: 0.36
- Visible Transmittance: 0.59
- Air Leakage: 0.2
- Window #2
- U-Factor: 0.35
- Solar Heat Gain Coefficient: 0.30
- Visible Transmittance: 0.46
- Air Leakage: 0.2
- Window #3
- U-Factor: 0.32
- Solar Heat Gain Coefficient: 0.45
- Visible Transmittance: 0.58
- Air Leakage: 0.3
Answers:
- Window #1
- R-Value = 3.33
- LSGR = 1.64
- Window #2
- R-Value = 2.86
- LSGR = 1.53
- Window #3
- R-Value = 3.13
- LSGR = 1.29
Shading Devices
Before innovations in glass, films, and coatings in the past decade, a typical residential window with one or two layers of glazing allowed roughly 75 to 85 percent of the solar energy to enter a building, which has a negative impact on summertime comfort and cooling bills, especially in hot climates.
Instructions: Click on the hot spots in the image below to see the properties of a normal window.
External Window Shading
External window shading devices such as awnings, roof overhangs, shutters, and solar screens, and internal shading devices such as curtains and blinds, can control the entry of solar heat. Although external window shading devices are about 50 percent more effective than internal devices at blocking solar heat, they do have some disadvantages.
Instructions: Click on the hot spots in the image below to see the disadvantages of external window shading.
Internal Shading Devices
The table below shows the percentages of the radiant energy that different types of internal shading devices transmit, reflect, or absorb.
| Shade Type | Transmitted energy (percent) | Reflected energy (percent) | Absorbed energy (percent |
|---|---|---|---|
| Roller Shades | 25 percent | 15 - 80 percent | 20 - 65 percent |
| Vertical Blinds | 0 percent | 23 percent | 77 percent |
| Venetian Blinds | 5 percent | 40 - 60 percent | 35 - 55 percent |
Advances in Window Technologies, page 1
Research in the recent past led to the development of low-emissivity or "low-e," glass and films that control heat gain and loss, reduce glare, minimize fabric fading, provide privacy, and occasionally provide added security in wind, seismic, and other high-hazard zones. New construction and window replacement applications commonly use glazing with these coatings.
Some low-e coatings and solar control films reduce solar heat gain without impairing visible light transmission excessively. These include tinted glass and spectrally selective coatings, which transmit visible light while reflecting the infrared portion of sunlight.
Many spectrally selective coatings or glazings also have some low-e properties as well.
Types of Glazing
Modern window glazing falls into three categories:
- Chemically or physically altered glass
- Coated glass or films
- Multiple-layered assemblies with or without either of the first two items.
Chemically or Physically Altered Glass
Tinting – One of the oldest of all the modern window technologies. Under favorable conditions, tinting can reduce solar heat gain during the cooling season by 25 percent to 55 percent. Tinted glass is made by alteration of the chemical properties of the glass. Both glass and plastic laminate may be tinted.
The tints absorb a portion of the sunlight and solar heat before it can pass all the way through the window to the room. Tinted glazings reduce the latter by 25 to 55 percent. "Heat absorbing" tinted glass maximizes its absorption across some, or all, of the solar spectrum. Unfortunately, the absorbed energy often transfers by radiation and convection to the inside.
Coated glass or films
Spectrally Selective Coatings
Spectrally selective coatings or tints reduce infrared light (heat) transmission while allowing relatively more visible light to pass through (compared to bronze- or gray-tinted glass).
For buildings that use daylight for lighting, a spectrally selective window is a good choice. Spectrally selective glass also absorbs much of the ultraviolet (UV) portion of the solar spectrum.
In a multi-paned window, they function best as the outermost sheet of glazing. Thermal performance is increased when combined with a low-e coating. Spectrally selective coatings often have a light blue or green tint.
Low–e Coatings
Low-e and reflective coatings usually consist of a layer of metal a few molecules thick. The thickness and reflectivity of the metal layer (Low-E coating) and the location of the glass it is attached to directly affects the amount of solar heat gain in the room.
Most window manufacturers now use one or more layers of low-e coatings in their product lines. Any low-e coating is roughly equivalent to adding an additional pane of glass to a window.
Instructions: Click on the hot spots in the image below to see the properties of Low-E coating windows:
Low-e coatings reduce IR heat transfer by 5 to 10 times. The lower the emissivity value (a measure of the amount of heat transmission through the glazing or coating), the better the material reduces the heat transfer from the inside to the outside.
Most low-e coatings also slightly reduce the amount of visible light transmitted through the glazing relative to clear glass. The table below gives the emissivity values for different types of glass.
| Type of Coating | Emissivity |
|---|---|
| Clear glass. Uncoated | 0.84 |
| Glass with single hard coat low-e | 0.15 |
| Glass with single soft coat low-e | 0.10 |
There are three types of low-e coating available: Soft, hard coatings, and Heat Mirror.
- Soft coat is applied to the surface of a glass at lower temperatures. It's not durable enough to be exposed to the elements, so it's only used on the inner surfaces of windows which are not exposed to the elements.
- Hard coat is produced by fusing metallic oxide to the hot surface of glass during manufacture and is found primarily on storm windows and removable energy panels. Hard coat is applied on the glass surface at a high temperature. One layer is about 1/10,000 the diameter of a human hair. Hard coat is not quite as energy efficient as soft coat, but is tough enough to be used on surfaces exposed to the elements. Both types of low-e coatings (within insulated glazing assemblies) typically last for 10 to 50 years.
- Heat Mirror is a proprietary product that's applied to a thin polyester sheet suspended between the two panes of dual pane window. The coating reflects radiant heat while the sheet decreases heat loss by splitting the air space in two.
The only spectrally selective coatings now available are modified soft coat low-e coatings. The selective properties of the coatings are determined by modifying the coating's thickness and number of layers. A spectrally selective tinted glazing with a pyrolytic hard coat serves a similar purpose. These spectrally selective hard coats are currently under development.
Aftermarket Films - "Aftermarket" films are available for application on existing windows. They are relatively easy to apply on glazing up to 36 square inches. They are often applied to the glass with a water-soluble adhesive. To reduce the possibility of bubbles and wrinkles on large windows, have the film installed professionally. Most films should be applied to the inside surface of the glass since they can be damaged easily by weather.
If you plan to install the film yourself, be careful to select the appropriate film for your needs, and understand all directions before beginning. Plastic films generally last about 8 to 10 years before they start looking worn.
Advances in Window Technologies, page 2
Types of Glazing Continued: Multiple Layered Assemblies
The third type of modern window glazing is multiple-layered assemblies with or without either of the first two items.
Gas Fills
Filling the space with a less conductive, more viscous, or slow-moving gas minimizes the convection currents within the space, conduction through the gas is reduced, and the overall transfer of heat between the inside and outside is reduced.
Argon and Krypton gases with measurable improvement in thermal performance have been used. A mixture of krypton and argon gases is also used as a compromise between thermal performance and cost. The table below compares the two gasses.
| - | Argon | Krypton |
|---|---|---|
| Cost | Inexpensive | More expensive |
| Miscellaneous | Nontoxic, nonreactive, clear and odorless | - |
Xenon gas may also be used and provides R-20 per inch.
Layers of Glass and Air Spaces
Layers of Glass and Air Spaces may be either single-pane, double-pane, triple-pane or multi-pane.
- Standard single-pane glass has very little insulating value (approximately R-1). It provides only a thin barrier to the outside and can account for considerable heat loss and gain. Traditionally, the approach to improve a window's energy efficiency has been to increase the number of glass panes in the unit, because multiple layers of glass increase the window's ability to resist heat flow.
- Double-pane or triple-pane windows have insulating air-filled or gas-filled spaces between each pane. Each layer of glass and the air spaces resist heat flow. The width of the air spaces between the panes is important, because air spaces that are too wide (more than 5/8 inch) or too narrow (less than 1/2 inch) have lower R-values (i.e., they allow too much heat transfer).
- Advanced, multi-pane windows are now manufactured with inert gases (argon or krypton) in the spaces between the panes because these gases transfer less heat than does air. Multi-pane windows are considerably more expensive than single-pane windows and limit framing options because of their increased weight.
During the late 1980s, manufacturers combined the technology of multiple glazing, low-E coatings, and gas-filling to create "super windows." These windows are highly insulated, with R-values that can go as high as R-9.
Advances in Window Technologies, page 3
Frame and Spacer Materials
Window frames are available in a variety of materials including aluminum, wood, vinyl, and fiberglass. Frames may be primarily composed of one material, or they may be a combination of different materials such as wood clad with vinyl or aluminum-clad wood. Each frame material has its advantages and disadvantages, as shown in the table below.
| - | Advantages | Disadvantages | How to Improve |
|---|---|---|---|
| Aluminum | Ideal for strength and customized window design | Conduct heat and therefore lose heat faster and are prone to moisture condensation. | Anodizing or coating will prevent corrosion and electro-galvanic deterioration of aluminum frames; thermal resistance can be improved by placing continuous insulating plastic strips between the interior and exterior frame. |
| Wood | Have higher R-values, are not affected by temperature extremes, and do not generally promote moisture condensation. | Require considerable maintenance in the form of periodic painting or staining. If not properly protected, wood frames can swell, which leads to rot, warping, and sticking. | |
| Vinyl (typically polyvinyl chloride (PVC) | Available in a wide range of styles and shapes, have moderate to high R-values, are easily customized, are competitively priced, and require very low maintenance. | Do not possess the inherent strength of metal or wood. | Larger-sized windows are often strengthened with aluminum or steel reinforcing bars. |
| Fiberglass | Some of the highest R-values; excellent for insulating; will not warp, shrink, swell, rot, or corrode. | Relatively new and are not yet widely available. Unprotected fiberglass does not hold up to the weather and therefore is always painted. |
Spacers are used to separate multiple panes of glass within the windows. Although metal (usually aluminum) spacers are commonly installed to separate glass in multi-pane windows, they conduct heat.
During cold weather, the thermal resistance around the edge of a window is lower than that in the center; thus, heat can escape, and condensation can occur along the edges.
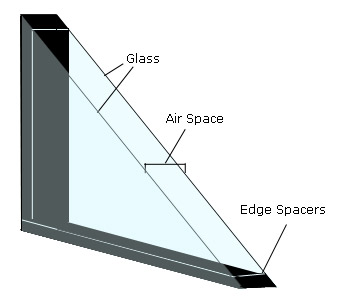
Problems with Spacers
The following have been done to alleviate the problems associated with spacers:
- One manufacturer has developed a multi-pane window using a 1/8-inch-wide (0.32 centimeters-wide) PVC foam separator placed along the edges of the frame. Like other multi-pane windows, these use metal spacers for support, but because the foam separator is secured on top of the spacer between the panes, heat loss and condensation are reduced.
- Several window manufacturers now sandwich foam separators, nylon spacers, and insulation materials such as polystyrene and rockwool between the glasses inside their windows.
- A new type of spacer product called warm-edge technology has evolved in the industry to overcome the thermal inefficiency of conventional aluminum spacers. Warm-edge refers to the type of spacer material used to separate the panes of glass (or glazing) in an insulated window unit. If the material conducts less heat or cold than a conventional aluminum spacer at the edge of the glass, it is said to be "warm-edge." Most of these newer spacers are less conductive and outperform pure aluminum. But still they all contain some kind of metal. And metal is highly conductive.
- Available in the market is a NO-metal Super Spacer, which uses no metal and is made up of 100 percent polymer structural foam. Therefore, it is believed to improve the R-Value of the whole window and reduce moisture condensation problems.
Selecting Main Parameters of Windows
General guidelines for selecting the main parameters of windows based on the climate are provided in the table below.
| - | Colder climate | Moderate Climate | Warm Climate |
|---|---|---|---|
| U-Factor | Less than 0.33 | 0.33 | 0.33 |
| Visual Transmittance | 50 percent | >50 percent | >60 percent |
| SHGC | 0.4-0.55 | >0.55 | <0.4 |
| UV-Protection | >75 percent | 75 percent | 75 percent |
| Edge Spacers | Super Spacers | Warm edge spacers | Warm edge spacers |
| Frame | Non-conductive | Non-conductive | Non-conductive |
| Air leakage | <0.3 cfm/sq.ft | <0.3 cfm/sq.ft | <0.3 cfm/sq.ft |
Improvement in Window Performance
The image below shows the improvement in window performance (R-value) with advanced window glazing. It can be seen from the figure that the super windows are losing less heat and are even making progress to gain heat instead of losing heat because of solar heat gains.
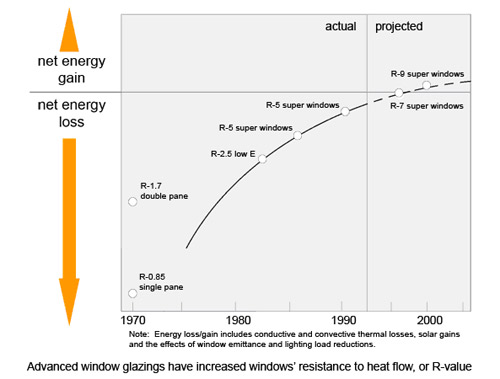
Smart Windows
Smart Windows operate very similarly to photochromatic sunglasses, which have lenses that darken automatically in response to bright light. Since windows let in heat as well as light, it would not be energy efficient to block out sunlight (heat) on a cold winter day. Therefore, smart windows have control switches that permit them to be manually turned on or off—so, instead of adjusting a shade or blind, one simply flicks the switch of the Smart Window.
Instructions: Click and drag the button in the image to see the amount of incoming light when the Smart Window is on and off.
Smart Windows use a new technology called Suspended Particle Devices (SPDs). They are small, light-absorbing microscopic particles or light valves. In Smart windows, millions of the SPDs are placed between two panes of glass that are coated with conductive material.
- When the Smart Windows are turned "on," electricity from the control switch travels through the conductive coating and causes the SPDs to line up and allow the passage of light.
- When the Smart Windows are turned "off," no electricity travels through the conductive coating, so the particles float freely between the glass, causing it to appear darkened or tinted.
A similar technology using electrochromics is also being developed to improve windows.
Instructions: Click the play button below to watch the Suspended Particle Devices animation and observe how the SPDs react. (16 seconds)
- Note: The animation has no sound and the text above describes how the suspended particles react in the animation when the electricity is "on" and "off."
Calculating Heat Loss of Windows
As you may recall from Chapter 7, heat loss is calculated using this formula:
Using this same formula, you can calculate the heat loss for windows.
Example 1
A house in State College, PA has 380 ft 2 of windows (R = 1.1), 2750 ft 2 of walls and 1920 ft 2 of roof (R = 30). The composite R-Value of the walls is 19. Calculate the heating requirement for the house for the heating season (HDD=6000). What is the percentage of heat that is lost through the windows?
Solution:
Heat loss in a heating season is given by
Heat Loss through windows =
Heat loss through walls =
Heat loss through roof =
Total heat loss = 79,803,560 BTUS
Percentage of heat loss through the windows =
Example 2
Windows in the house described in Example 1 are upgraded at a cost of \$1,550. The upgraded windows have an R-value of 4.0.
- What is the percent savings in the energy and the heating bill if the energy cost is 11.15/MMBTUs.
- What is the pay back period for this modification?
Solution:
a) New heat loss for the same window size with the new R-value is
Annual energy savings = 49.745 MMBTUs -13.680 MMBTUs = 36.06 MMBTUs
The percent savings is
The old heating bill would be
The new heating bill would be
The monetary savings = \$402.06 per year.
The Pay Back Period =
The table shows the cost effectiveness of replacing old windows with new and improved windows. The costs are calculated using a computer program called RESFEN developed by US Department of Energy.
| Performance | Base Model | Recommended Level | Best Available |
|---|---|---|---|
| Window Description | Double-paned, clear glass, aluminum frame | Double-paned, low-e coating, wood or vinyl frame | Triple-paned, tinted, two spectrally selective low-e coatings, krypton-filled, wood or vinyl frame |
| SHGCa | 0.61 | 0.55 | 0.20 |
| U-factor b | 0.87 | 0.40 | 0.15 |
| Annual Heating Energy Use | 547 therms | 429 therms | 426 therms |
| Annual Cooling Energy Use | 1,134 kWh | 1,103 kWh | 588 kWh |
| Annual Energy Cost | \$290 | \$240 | \$210 |
| Lifetime Energy Cost c |
\$4,700 | \$3,900 | \$3,400 |
| Lifetime Energy Cost Savings | - | \$800 | \$1,300 |
a SHGC, or Solar Heat Gain Coefficient, is a measure of the solar radiation admitted through a window. SHGC ranges between 0 and 1; the lower the number, the lower the transmission of solar heat. SHGC has replaced shading coefficient (SC) as the standard indicator of a window's shading ability. SHGC is approximately equal to the SC multiplied by 0.87.
b U-factor is a measure of the rate of heat flow through a window. The U-factor is the inverse of the R-value, or resistance, the common measure of insulation.
c Lifetime energy cost savings is the sum of the discounted value of annual energy cost savings, based on average usage and an assumed window life of 25 years. Future energy price trends and a discount rate of 3.4 percent are based on Federal guidelines (effective from April 2000 to March 2001). Assumed electricity price: \$0.06/kWh, the Federal average electricity price in the U.S. Assumed gas price: \$0.40/therm, the Federal average gas price in the U.S.
Cost-Effectiveness Assumptions: The model shown above is the result of a simulation using a residential windows modeling program called RESFEN. Calculations are based on a prototype house: 1,540 sq. ft., two stories, a standard efficiency gas furnace and central air conditioner, and window area covering 15 percent of the exterior wall surface area.
Review and Extra Resources
Review Sheet Lesson 10 – Windows
- Windows and Heat Loss
- Solar radiation has infrared (IR), ultraviolet (UV), and visible waves
- Factors in window selection
- U factor
- Visible Transmittance (VT)
- Solar Heat Gain Coefficient (SHGC)
- Air Leakage (AL)
- Condensation Resistance (CR)
- R = 1 / U
- LSG = VT / SHGC
- Shading Devices
- Roller Shades
- Vertical Blinds
- Venetian Blinds
- Window Technologies
- Types of Glazing
- Chemically or Physically Altered Glass (tinting)
- Coated glass or films
- Spectrally Selective Coatings
- Low-e Coatings
- Soft Coat
- Hard Coat
- Heat Mirror
- After market Films
- Multiple-layered assemblies
- Gas Fills (argon, krypton)
- Layers of Glass and Air Spaces
- Single Pane
- Double Pane
- Multiple Pane
- Frame and Spacer Materials
- Types of Glazing
- Smart Windows
- Suspended Particle Devices (SPDs)
- Heat Loss = Area x HDD x 24 / R-value
Test Yourself
The questions below are your chance to test and practice your understanding of the content covered in this lesson. In other words, you should be able to answer the following questions if you know the material that was just covered! If you have problems with any of the items, feel free to post your question on the unit message board so your classmates, and/or your instructor, can help you out!
- What are the main factors that are important in selecting a window?
- Explain briefly what technological advances account for increase in performance of windows.
- What are gas filled windows, and how do they perform better than regular windows?
- Is it true that a person in Alaska requires high SHGC of windows?
- If thickness of the window is doubled, what will be the new percentage heat loss?
- What will be the heat loss from a window if it is vacuum between two window panes?
- A glazing material cost about $1/ ft2 which improves the insulation by 10%. What is the payback period of adding the glazing if originally window glass cost is $10/ft2 and heat loss from window is 1000 BTU/hr. Assume the cost of heating is $10/MMBTU.
- A house in State College, PA consists of the following: 12 single pane windows (each 6 ft by 3 ft with an R value of 1). Calculate the total number of BTUs lost for one season through these 12 windows. HDD for State College are 6,000.
- Heat loss through a window (R-2) is 10 MMBTU/year. Calculate the payback period if following filling material is used. Assume heating price to be $10/MMBTU
Calculate Heat Loss Example Gas fill Additional Cost Effective R Payback period (year) Argon \$20 7 Krypton \$45 12 Xenon \$75 20
Extra Resources
For more information on topics discussed in Lesson 10, see these selected references:
Lesson 10 Deliverables
Deliverable 1
You must complete a short quiz that covers the reading material in lesson 10. The Lesson 10 Quiz, can be found in the Lesson 10: Windows module in Canvas. Please refer to the Calendar in Canvas for specific time frames and due dates.