Lesson 4b: Global and Regional Effects of Secondary Pollutants
Introduction to Global and Regional Effects of Secondary Pollutants
The Earth is continuously receiving energy from the sun. Energy also leaves the Earth at night (of course in the form of invisible infrared energy!). Otherwise, the Earth would be continuously warming up. This delicate balance between the energy coming in and leaving due to natural greenhouse effect is what keeps the planet warm enough for us to live on.
It is very obvious that if more energy comes in than the energy that leaves, the planet will become warm. Similarly, if the energy that leaves is more than the energy that comes in, the planet will become cool. The atmospheric temperature fluctuates over centuries due to certain natural causes. However, our "recent" (on a geological timescale) use of fuels that have been trapped underground are quickly changing the environment outside of these natural norms.
Go to the next screen to view an animation of the greenhouse effect.
Greenhouse Effect
In the first lesson, we saw that energy can be transformed from one form to another, and during this conversion, all the energy that we put into a device comes out. However, all the energy that we put in may not come out in the desired form. Please watch the following presentation:
What is the greenhouse effect?
Earth is a comfortable place for living things. It’s just the right temperatures for plants and animals – including humans – to thrive.
Why is Earth so special? Well, one reason is: the greenhouse effect! A greenhouse is a building with glass walls and a glass roof. The clear glass allows sunlight to shine into the greenhouse, while also trapping the Sun’s heat inside. This is how a greenhouse keeps plants warm, even at night and in the winter.
The greenhouse effect keeps Earth warm in pretty much the same way. Earth isn’t surrounded by glass, but it is surrounded by a jacket of gases called the atmosphere. In the daytime, the Sun shines through the atmosphere warming Earth’s surface. After the Sun goes down, Earth’s surface cools. This releases heat back into the air. But, some of that heat is trapped by the gases in the atmosphere. These heat-trapping gases are called greenhouse gases. Carbon dioxide, water vapor and methane are all examples of greenhouse gases.
Earth needs a balance of greenhouse gases to maintain just the right temperature for living things. But, some human activities are changing Earth’s natural greenhouse effect. For example, burning fossil fuels – like coal and oil – releases more carbon dioxide into our atmosphere. These extra greenhouse gases can cause the atmosphere to trap more and more heat, leading to a warmer Earth.
NASA satellites are constantly measuring the gases in our atmosphere from space. They have observed increases in the amount of carbon dioxide and other greenhouse gases. The information from NASA satellites can help scientists figure out where greenhouse gases are coming from and how they are ending up in our atmosphere. This information will help us better understand the impact that greenhouse gases have on our climate. And help us better understand this very special greenhouse that we call home.
Find out more about our Earth at NASA Climate Kids!
As can be seen from the Figure below, the amount of CO2 currently in the atmosphere is dramatically higher than previous levels even if we go back 800,000 years!
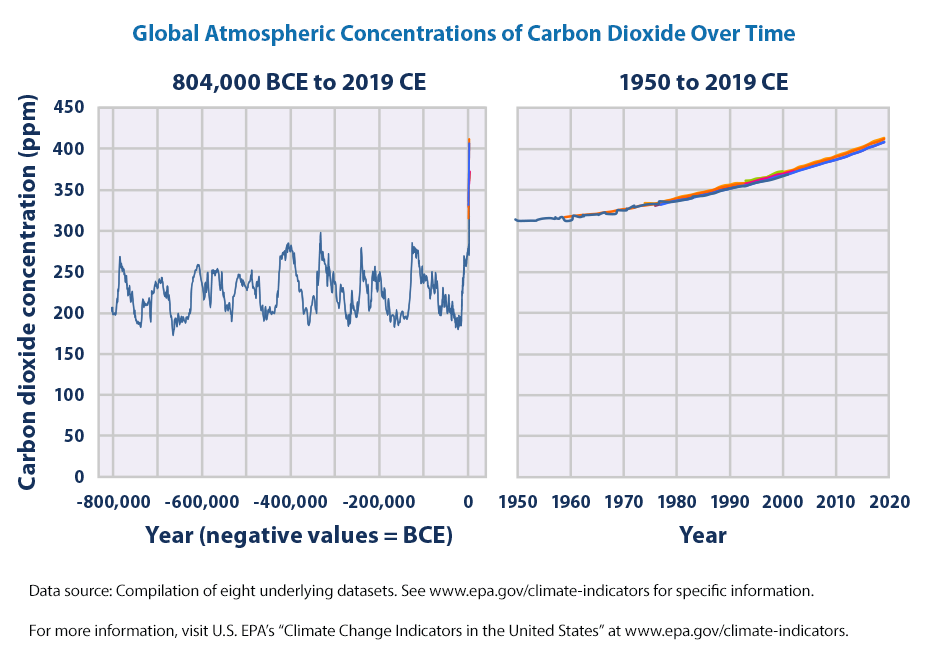
The onset of this dramatic rise corresponds to the industrial revolution and humanities increased use of CO2 producing fuels.
Greenhouse Gases
Our relationships with the greenhouse effect and greenhouse gases are complicated. A little bit is a good thing, and it plays a big role in what keeps us comfortable. However, too many greenhouse gases will heat up our planet and dramatically change climates throughout the world. It's also worth mentioning that CO2 is not the only greenhouse gas being produced by human activity.
The concentration of greenhouse gases in the atmosphere has been changing over the past 150 years. Since pre-industrial times, atmospheric concentrations of the gases have increased:
- CO2 has climbed over 31 percent.
- CH4 has climbed over 151 percent.
- N2O has climbed 17 percent.
Scientists have confirmed that this is primarily due to human activities, which include burning coal, oil, and gas, and cutting down forests.
Check this out!
Hold your mouse over the pie chart to see what percentage each gas accounts for in the total greenhouse emissions in the United States, and look at the table below for information about the sources of the gasses.
| Greenhouse Gas | Percent of Total Greenhouse Gases |
|---|---|
| Carbon Dioxide (C02) - Energy Related | 82% |
| Carbon Dioxide (C02) - Other | 2% |
| Methane (CH4) | 9% |
| Nitrous Oxide (N2O) | 5% |
| Other Gases (CFC-12, HCFC-22, CF4, SF6) | 2% |
The following list shows the greenhouse gasses and the source of emission:
- Carbon dioxide (CO2): Energy related CO2: 82% and Other CO2: 2%.
Produced by combustion of solid waste, fossil fuels, and wood and wood products. - Methane (CH4): 9%.
Source is the production and transport of coal, natural gas, and oil. Methane emissions also result from the decomposition of organic wastes in municipal solid waste landfills, and the raising of livestock. - Nitrous Oxide (N2O): 5%.
Produced by agricultural and industrial activities, as well as during combustion of solid waste and fossil fuels. - Other gases (SO2, CFC-12, HCFC-22, Perfluoromethane [CF4], and Sulfur Hexaflouride [SF6]): 2%.
Produced by industrial processes.
As you can see, energy related CO2 and CH4 accounts for 90 percent of the total greenhouse gas emissions in the United States. This highlights the impact of energy use on the environment.

Atmospheric lifetime is the period of time during which a gas changes and is either transformed or removed from the atmosphere.
GWP is an index defined as the cumulative radiative forcing (infrared radiation absorption) between the present and some chosen time horizon caused by a unit mass of gas emitted now, expressed relative to a reference gas such as CO2, as is used here. GWP is an attempt to provide a simple measure of the relative radiative effects of different greenhouse gases. In terms of GWP, methane is a much stronger greenhouse gas (~30x more potent) compared to CO2.
How Has CO2 Concentration Changed?
As you can see from the graph below, CO2 values have risen dramatically in a very short amount of time. These changes correspond to our increased reliance on fossil fuels which took off in the 1900s.
Try This!
Instructions: In the graph below, observe how CO2 concentration in the atmosphere has changed over the past 50 years. Based on your observations, answer the questions that follow.
| Year | Parts per million (ppm) |
|---|---|
| 1960 | 310 |
| 1970 | 320 |
| 1980 | 340 |
| 1990 | 360 |
| 2000 | 380 |
| 2010 | 390 |
| 2020 | 420 |
Data from the graph above was obtained from ice core samples of trapped air. More specifically, ice in the Polar Regions traps air from that particular time period, and then new ice is deposited over the previously deposited ice, trapping more air from the past. Thus, the analysis of ice core samples provides the composition of past air, which can be used to determine the past temperatures.
The increase in the greenhouse gases between 1950 and 2020 is believed to have caused an increase in the global temperature. The mean increase in the global temperature over the past one century is about 1 degree Celsius. However, this is the global average, which does not distinguish between ocean surface and land surface temperatures. The ocean surface increased by about 0.77 degree C whereas land temperatures increased by a staggering 1.43 degree C compared to pre-1900 temperatures. In other words, land areas are heating up about twice as fast!
Instructions: Review the graph below, showing the Annual mean for the Global surface temperature between years 1960 and 2020. The annual mean will show the detailed fluctuations.
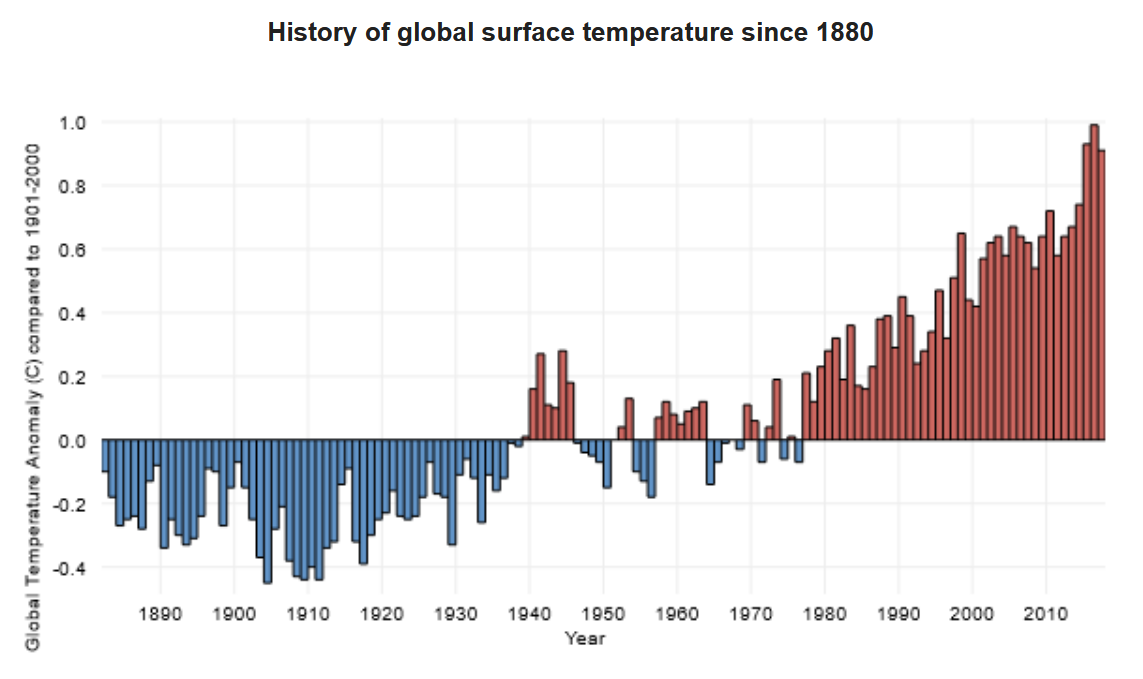

Since 1880, about when the industrial age first started, the average increase in global temperature has been 1 degree Celsius.Not only has there been an increase in temperatures with the increase of greenhouse gasses, there has also been an increase in CO2 emissions from fossil fuels – this has been apparent over the last 150 years (since about 1850).
If we overlay the temperature plot with CO2 emissions, you can see a strong correlation between the rise in temperature and increased CO2 production.
So what will happen in the next few decades? Well, it is hard to say because it depends on what we do in the future. Do we continue to replace fossil fuels with renewables, or do we hold onto our existing practices a bit longer? Experts have tried to predict what will happen to global temperatures based on what we currently know about our climate. A key variable is how much additional CO2 we emit over the next few decades.

These assumptions are used within climate models to predict possible temperature changes into the year 2100.

Though a few degrees doesn't seem like much, this is only the average temperature across the whole planet. In practice, many regions on land will have temperature increases far beyond a few degrees. As such, many predict an increase in the frequency and magnitude of heat waves, forest fires and other nature disasters. These factors are pushing societies to weigh the consequences of cheap fuels with their environmental impacts.
What is Known for Certain
Human activities change the earth's atmosphere.
Scientists know for certain that human activities are changing the composition of Earth's atmosphere. Increasing levels of greenhouse gases in the atmosphere, like carbon dioxide (CO2), have been well documented since pre-industrial times. There is no doubt this atmospheric buildup of carbon dioxide and other greenhouse gases is largely the result of human activities.
It's well accepted by scientists that greenhouse gases trap heat in the Earth's atmosphere and tend to warm the planet. By increasing the levels of greenhouse gases in the atmosphere, human activities are strengthening Earth's natural greenhouse effect. The key greenhouse gases emitted by human activities remain in the atmosphere for periods ranging from decades to centuries.
A warming trend of about 1oC has been recorded since the late 19th century. Warming has occurred in both the northern and southern hemispheres, and over the oceans. Confirmation of twentieth-century global warming is further substantiated by melting glaciers, decreased snow cover in the Northern Hemisphere, and even warming below ground.
What is Likely but Uncertain, Impact of Global Warming
Impact of Global Warming on such things as health, water resources, polar regions, coastal zones, and forests is likely, but it is uncertain to what extent.
Health
The most direct effect of climate change would be the impacts of the hotter temperatures, themselves. Extremely hot temperatures increase the number of people who die on a given day for many reasons:
- People with heart problems are vulnerable because one's cardiovascular system must work harder to keep the body cool during hot weather.
- Heat exhaustion and some respiratory problems increase.
- Higher air temperatures also increase the concentration of ozone at ground level.
- Diseases that are spread by mosquitoes and other insects could become more prevalent if warmer temperatures enabled those insects to become established farther north; such "vector-borne" diseases include malaria, dengue fever, yellow fever, and encephalitis.
Water Resources
Changing climate is expected to increase both evaporation and precipitation in most areas of the United States. In those areas where evaporation increases more than precipitation, soil will become drier, lake levels will drop, and rivers will carry less water. Lower river flows and lower lake levels could impair navigation, hydroelectric power generation, and water quality, and reduce the supplies of water available for agricultural, residential, and industrial uses. Some areas may experience increased flooding during winter and spring, as well as lower supplies during summer.
Polar Regions
Climate models indicate that global warming will be felt most acutely at high latitudes, especially in the Arctic, where reductions in sea ice and snow cover are expected to lead to the greatest relative temperature increases. Ice and snow cool the climate by reflecting solar energy back to space, so a reduction in their extent would lead to greater warming in the region.
Coastal Zones
Sea level is rising more rapidly along the U.S. coast than worldwide. Studies by EPA and others have estimated that along the Gulf and Atlantic coasts, a one-foot (30 cm) rise in sea level is likely by 2050.
In the next century, a two-foot rise is most likely, but a four-foot rise is possible. Rising sea level inundates wetlands and other low-lying lands, erodes beaches, intensifies flooding, and increases the salinity of rivers, bays, and groundwater tables. Low-lying countries like the Maldives located in the Indian Ocean and Bangladesh may be severely affected. The world may see global warming refugees from these impacts.
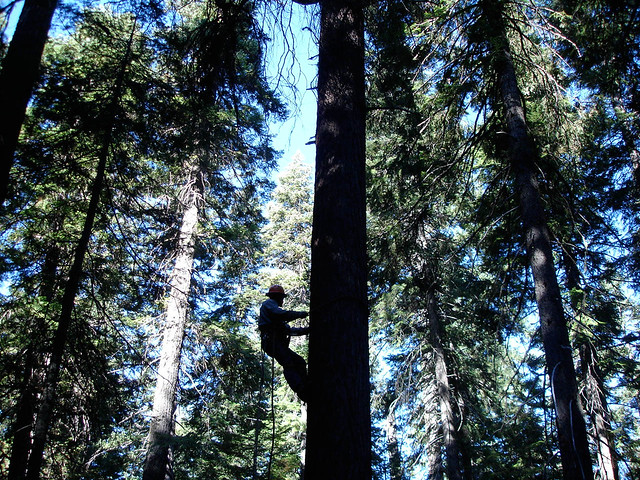
Forests
The projected 2°C (3.6°F) warming could shift the ideal range for many North American forest species by about 300 km (200 mi.) to the north.
- If the climate changes slowly enough, warmer temperatures may enable the trees to colonize north into areas that are currently too cold, at about the same rate as southern areas became too hot and dry for the species to survive. If the Earth warms 2°C (3.6°F) in 100 years, however, the species would have to migrate about 2 miles every year.
- Poor soils may also limit the rate at which tree species can spread north.
- Several other impacts associated with changing climate further complicate the picture:
- On the positive side, CO2 has a beneficial fertilization effect on plants, and also enables plants to use water more efficiently. These effects might enable some species to resist the adverse effects of warmer temperatures or drier soils.
- On the negative side, forest fires are likely to become more frequent and severe if soils become drier.
What is Uncertain
The long-term effects of global warming
Scientists have identified that our health, agriculture, water resources, forests, wildlife, and coastal areas are vulnerable to the changes that global warming may bring. But projecting what the exact impacts will be over the twenty-first century remains very difficult. This is especially true when one asks how a local region will be affected.
Scientists are more confident about their projections for large-scale areas (e.g., global temperature and precipitation change, average sea level rise) and less confident about the ones for small-scale areas (e.g., local temperature and precipitation changes, altered weather patterns, soil moisture changes). This is largely because the computer models used to forecast global climate change are still ill-equipped to simulate how things may change at smaller scales.
Some of the largest uncertainties are associated with events that pose the greatest risk to human societies. IPCC cautions, "Complex systems, such as the climate system, can respond in non-linear ways and produce surprises." There is the possibility that a warmer world could lead to more frequent and intense storms, including hurricanes. Preliminary evidence suggests that, once hurricanes do form, they will be stronger if the oceans are warmer due to global warming. Stil, the net result appears to be a more complex environment that is less hospitable compared to what we are accustomed.

Solutions for Global Warming
Today, there is no single action that will reverse the course of climate change. The main question is whether we want to wait and adapt to a new environment, or whether we want to start to do something now?
There is certainty that human activities are rapidly adding greenhouse gases to the atmosphere, and that these gases warm our planet. This is the basis for concern about global warming.
The fundamental scientific uncertainties are these: How much more warming will occur? How fast will this warming occur? And what are the potential adverse effects? These uncertainties will be with us for some time, but many suspect that point of no return is well past us. If we don't change our habits soon, we will be stuck with a warmer world until we find a way to reduce the concentration of greenhouse gases in our atmosphere.
Global warming poses real risks, and those risks increase as we continue to change the composition of the atmosphere. Ultimately, this is why we have to use our best judgment—guided by the current state of science—to determine what the most appropriate response to global warming should be.
What difference can I make?
When faced with this question, individuals should recognize that, collectively, they can make a difference. In some cases, it only takes a little change in lifestyle and behavior to make some big changes in greenhouse gas reductions. For other types of actions, the changes are more significant.
When that action is multiplied by the 300 million people in the U.S. or the 7 billion people worldwide, the savings are significant. The actions include being energy efficient in the house, in the yard, in the car, and in the store.
Everyone's contribution counts, so why not do your share?
Energy Efficiency Means Doing the Same (or More) with less Energy. When individual action is multiplied by the 300 million people in the U.S., or the 6 billion people worldwide, the savings can be significant.
How Can I Save the Environment?
Instructions: You can help save the environment by making changes from the top to the bottom of your home. Click on the hot spots below to see how you can make a difference:
Review
To review, these are the things you can do in your home – from top to bottom - to protect from the environment:
- Purchase "Green Power" - electricity that is generated from renewable sources such as solar, wind, geothermal, or biomass - for your home's electricity, if available from your utility company. Although the cost may be slightly higher, you'll know that you are buying power from an environmentally friendly energy source.
- Insulate your home – you’ll learn more about this in Home Activity Three.
- Use low-flow faucets in your showers and sinks.
- Replace toilets with water-saving lavatories.
- Purchase home products—appliances, new home computers, copiers, fax machines, that display the ENERGY STAR® label - You can reduce your energy consumption by up to 30 percent and lower your utility bills! Remember, the average house is responsible for more air pollution and carbon dioxide emissions than is the average car.
- When your lights burn out, replace them with energy-efficient compact fluorescent lights.
- Lower the temperature on your hot water tank to 120 degrees.
- Tune up your furnace.
- Insulate your water heater and all water pipes to reduce heat loss.
When you remodel, build, or buy a new home, incorporate all of these energy efficiency measures—and others.
Each of us, in the U.S., contributes about 22 tons of carbon dioxide emissions per year, whereas the world average per capita is about 6 tons.
The good news is that there are many ways you and your family can help reduce carbon dioxide pollution and improve the environment for you and your children.