Lessons
1: Energy Provision
Overview
Overview
Since the dawn of civilization, humankind has depended on energy for many uses. Energy is all around us and has played a role in nearly every aspect of society. Starting with the ability to use fire for light, heat, and cooking, to harnessing the atom for nuclear power, energy has been part of social and economic advancement. Energy is a fundamental and necessary aspect of manufacturing, agriculture, transportation, and just everyday living. Our initial reaction may be to consider electricity when we hear the word “energy,” but electricity is only part of the many forms of energy on which we depend.
We must first consider what a significant role energy plays in our day-to-day lives, and in helping a society and economy to function. Were it not for accessibility to energy, you would not be able to be taking this course online. As a matter of fact, imagine a day without any form of energy. No electricity, no lights, no air conditioning, no driving, no manufacturing, and so on. You get the picture! Energy is a fundamental necessity of society and the economy. One way we will see how important energy is to society is to understand how it is reflected in the United Nations Sustainable Development Goals (SDGs).
Learning Outcomes
By the end of this lesson, you should be able to:
- Discuss how the 4 Factors of Energy Provision present opportunities and challenges for individuals depending on their role in society
- Describe three key points about SDG #7 on energy
- Illustrate the connections between one of the 4 Factors of Energy Provision and the targets of Energy Sustainable Development Goal (SDG #7)
Lesson Activities
| Read | Lesson 1 content |
|---|---|
| Discuss | Reconciling competing drivers of energy |
| Discuss | The SDGs in context (optional) |
| Create | Lesson 1 infographic |
Questions?
If you have questions, please feel free to post them to the Questions about EGEE 401 Discussion forum in Canvas. While you are there, feel free to post your own responses if you, too, are able to help a classmate.
Competing Priorities of Energy Provision
Competing Priorities of Energy Provision
Energy is one of those issues that is faced with competing priorities. In other words, it is essential to society and the economy, as well as having profound impacts on the environment and availability of natural resources. Why should we care about this?
At a minimum, we want energy sources that are reliable, secure, and are accessible to as many as possible. Ideally, energy sources would also be sustainable. In the perfect world, we would find energy solutions that would be the best solutions for all these aspects. But we know that is not the case.
Those with specific interests or responsibilities may view energy solutions differently based on the desired goal. For example, those interested in environmentally-friendly solutions may prefer renewable energy sources. However, those tasked with providing a reliable 24/7 supply may be more wary of renewable energy sources, many of which are intermittent or inconsistent.
Four Factors of Provision
Four Factors of Provision
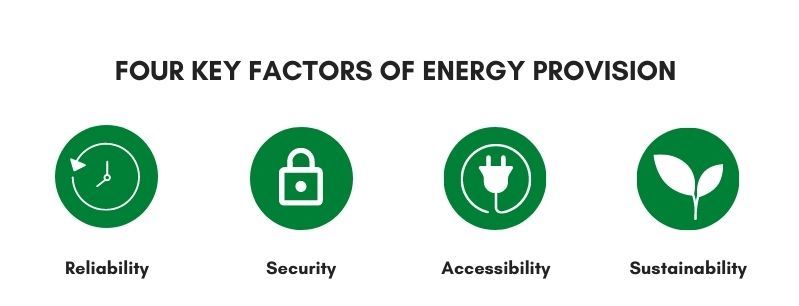
Let us look at those terms in more detail. First is energy reliability. A reliable energy supply is one that you can count on to provide the energy you need, when you need it, all the time. Whereas for many this is a convenience, there are cases such as infrastructure, hospitals, and national security where energy lapses are not only unacceptable and disruptive but can be life and property threatening.
Related to this is energy security. This is related to energy reliability but is more about how safe and secure is our energy infrastructure? Concerns about sabotage and terrorism, and the risk of the energy infrastructure being intentionally compromised are very real. Ironically, the more efficient and sophisticated our energy infrastructure becomes, with smart meters, connected systems and the like, the more susceptible it is to cyberattacks and compromise. Even the traditional “wire and poles” infrastructure is at risk from sabotage and natural disasters. We hear all too often of power outages due to storms.
Energy accessibility relates to the ability for those who need energy to get it. Unlike reliability and security, this aspect is more about equity and opportunity for the population as a whole. The expectations and thresholds are different in this case. For an area who did not have access to energy until recently, recipients might be more tolerant of lapses in reliability and even security as compared to areas with a long history of energy access. A component of accessibility is affordability. Living on the grid but being unable to pay the electric bill can mean energy is not accessible to you.
Finally, we speak of energy sources as being sustainable. This unfortunately has historically been the most expendable attribute. Sources that are sustainable are difficult to sell if they cannot also address at least one or more of the other three attributes. This is why solar, wind, and other renewables have taken so long to take root in the energy profile of many regions around the world.
A Closer look at the Factors
A Closer look at the Factors
Let’s explore how trying to balance these four attributes is a real-life issue. In the attached video, we ask a subject matter expert who has had to address this choice from a variety of perspectives what he thinks of the four attributes and how he has made decisions on which path to take and how to prioritize them.
Video Interview
Watch the following video interview between Ed Pinero (former EGEE 401 instructor) and Bob Barkanic (10:45)
Hello Class! Welcome to our discussion today! Today we’re interviewing a good friend and colleague of mine, Bob Barcanic. And Bob will share some of his experiences to help add some context for what we’ve been discussing in this lesson. And in this lesson we introduced a concept of energy accessibility, reliability, security, and sustainability. And we will be visiting these attributes throughout the semester from different perspectives. But we thought it would be a good start to have some real-life perspectives and I can’t think of anybody better to do that than Bob. So let’s go ahead and get started.
Again, Bob, welcome! And thank you for joining us. And, we’d like you to comment about your experiences on each of these attributes. But first please take a few minutes to introduce yourself including specifically about your energy-related background.
Well, thank you Ed. Like Ed said, my name is Bob Barkanic. And I am a consulting engineer. I have been in the energy industry for over 40 years. I’ve worked in the nuclear energy field. I’ve worked in government on energy programs. I have worked for a large Fortune 500 power company. I’ve taught, in fact, I’ve taught this very class at the Penn State World Campus. And, my present position is as an energy consultant. I am a professional engineer in Pennsylvania, and I have both my bachelors and masters in engineering science from Penn State University.
Excellent, excellent! And again, Bob’s being a little bit modest. He’s had a very distinguished career. He’s worked on Three Mile Island. He’s worked with the governor of Pennsylvania in the Department of Environmental Resources. And I’ve had the honor and privilege of working with Bob and for Bob several times throughout our respective careers. So, let’s jump right into discussion about these attributes, and we’ll start with reliability. We all want our energy supply to be reliable. So, from your experiences, can you tell us your thoughts on this concept of energy reliability?
Yeah, so the first topic being reliability is appropriate because it is one of the most important parameters that utility executives face. But, what is reliability? Reliability is simply keeping the lights on, or keeping the gas flowing, regardless of what’s going on out in the world. That could be storms. That could be cyber-security. That could be accidents. That could be equipment failure. So, the Pennsylvania Public Utility Commission, which is the entity that regulates utilities in Pennsylvania, measures the frequency, and the duration, and the restart time of those outages. The PUC determines how much money a utility can make in a given year based on that performance. And with the expanding distribution, new devices coming online such as smart grid devices, the increasing frequency and severity of storms, ensuring reliability for customers is a constant source of frustration for utility executives.
Excellent point, thank you! So let’s transition a bit. In this day and age, threats to, natural or intentional, do pose a risk to our power system. And also we have the issues of energy independence vs relying on another region for supply, and this could be a concern as well. So, with those concepts in mind, what are your thoughts on this issue of energy security?
Energy security in the electric utility industry has always been a priority. But the challenges today are even more confounding than they have been in the past. In the past you could “harden” your systems. You can harden them with structural barriers that could withstand an accident like a truck driving into a transformer station. Today, with everything being digital there’s an almost overwhelming number of hackers out there who for whatever reason are trying to get in and manipulate the electric grid, and that’s just on the electricity side. On the fuel side, there’s also geo-political issues. In September of 2019, there was a drone attack on one of the Saudi Iran Co oil refineries that disrupted one-half of the Saudi’s oil refining capabilities, and that was five percent of the global demand. So, the geopolitical issue from a drone attack, thankfully we and the Saudi’s had reserves so there was hardly any impact to our economy.
So, we’ve talked about the importance of the energy supply as reliable and secure. But another aspect is this issue of accessibility. And part of that includes affordability. So with your diverse background in this space, what are your views on this issue of accessibility and affordability?
I think accessibility on the electricity utility side in developed countries like the United States, for the most part, is not a significant issue. Affordability for that electricity is a completely different matter and there are programs built into government agencies that help people who are having trouble with their electric utility bills. I don’t, so I don’t see accessibility on the electricity side as a big issue in developed countries. On the natural gas side, the same cannot be said. Here in Pennsylvania, where we have an abundance of natural gas, marcel shale gas, one of the biggest challenges that the industry has is to get that gas to market, to customers, and to residents. Electricity in the developed world is a completely different matter as well. In the developing world, the solution might be to jump over a hundred years worth of technology and development that we’ve had in developed countries. Building our infrastructure out, and go directly to distributed generation. If you imagine bringing solar energy to a community or in a rural community in a developing country and the impact that that could have on their quality of life, not to mention their access to healthcare information, or communications, or commerce. That would be astounding. Getting natural gas in those areas could be a little bit more challenging.
So the new player on the scene is this issue of sustainability and sustainable energy. There’s a lot of talk of having more renewables in the mix. Just making our overall energy supply and energy system more sustainable. So, what are your views on this whole issue of energy sustainability?
Yes, so sustainability in energy and energy sustainability is the biggest issue of them all, right? It’s tied to climate change and you’ll be learning a lot about climate change in this class and in other classes at Penn State. It is, I think, the most challenging issue that we face. And as with accessibility, sustainability may actually be easier in the developing world than in the developed world. But still very challenging. In the developing world though, especially in rural places where infrastructure doesn’t exist, you could see how that distributed generation could be built much more easily than it could be in the developed world, because in the developed world we have enormous build-out of energy infrastructure. In the developed world, renewables must compete with existing energy resources. You don’t have that in the developing world. And with our 24 hour a day/365 days a year economy, intermittency of renewable resources is an issue that we have to contend with. And batteries may ultimately solve that but imagine the amount of infrastructure that’s necessary in the United States to replace the entire fossil fuel fleet of vehicles with electric vehicles. It’s a staggering amount. But that’s where we need to go. And additionally, in the developed world political infrastructure exists, and it’s robust. The political infrastructure is robust. But those communities, those companies that are tied to existing infrastructure, they have a right to ensure the status quo on that and they’re going to fight hard to do. So, I see that as perhaps political, overcoming the political infrastructure, is one of the most difficult challenges that we face.
Wonderful, thank you so much for that insight. That real-life insight on these four attributes is incredibly useful to the class. So, to wrap up, what are your thoughts on how these all integrate together? How do you deal with these competing priorities going forward?
So, we talked about many of the things that you’ll be talking about in the class, smart grid, distributed generation, renewable energy, electric vehicles, batteries. I would just ask you to remember the differences between the gas and electric industry that developed differently. So there are different challenges in each of those. And I would also remind you that there are different challenges in differences between the developed countries and the developing countries. And, finally I would just hope that you enjoy digging deeper into those issues as I have.
Wonderful, thank you! And I suspect this was very insightful. We appreciate you taking the time to chat with the class and hopefully we can have you come back later in the semester on some other issues. So, on that note, thank you. And thank you class, for joining us today for this.
Sustainable Development Goals
Sustainable Development Goals
In 1992, the world experts convened in Rio de Janeiro Brazil for what was billed as the first Earth Summit. This triggered an ongoing series of summits and actions that led to the current suite of Sustainable Development Goals (SDGs). Review the general information at the Sustainable Development Goals website [2], including the timeline of milestones that show how the concept has evolved since the beginning.
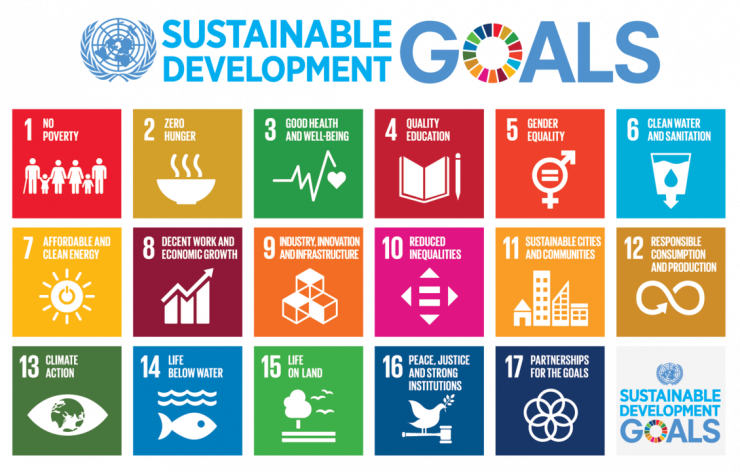
- No Poverty
- Zero Hunger
- Good Health and Wellbeing
- Quality Education
- Gender Equality
- Clean Water and Sanitation
- Affordable and Clean Energy
- Decent Work and Economic Growth
- Industry, Innovation and Infrastructure
- Reduced Inequalities
- Sustainable Cities and Communities
- Responsible Consumption and Production
- Climate Action
- Life Below Water
- Life on Land
- Peace, Justice and Strong Institutions
- Partnerships for the Goals
Reading Activity
On the Sustainable Development Goals website, you will find icons for each of the 17 goals. Click on each one and review the Overview. These are short entries that describe the goal and provide some facts and figures. For those goals that may be of particular interest to you, feel free to also click on the targets tab to get a better sense of what they are trying to accomplish. We will study the Energy goal in more detail later in this lesson.
SDG website [2]
Questions to guide your reading:
- Do you think the goals adequately cover issues facing society? If not, what is missing?
- In your opinion, are the goals realistic?
- What about the indirect links to other SDGs?
- How do energy-related decisions and actions impact other SDGs?
Comparing the SDGs
Comparing the SDGs and MDGs
It is important to note that the SDGs are “second generation” goals in that they replaced the original Millennium Development Goals (MDGs). Review the MDG Website [4] and I encourage you do a cursory review of the status reports, such as the Millennium Development Goals 2015 Report. An issue that has been dogging the entire effort since the MDGs were announced is that they are almost too aspirational and nearly impossible to achieve in the relatively short timelines set for the goals. For example, one was to eradicate poverty and hunger, and another was to achieve environmental sustainability. Results were of course mixed and, overall, we missed the mark on all the MDGs, even though progress was made towards each. We see the same happening with the SDGs where progress is being made, but the absolute end point goals will be an elusive target; clearly, while there are fewer people in poverty now than in the past, we did not eradicate poverty.
Watch the following video, Origin Story of Sustainable Development Goals (4:55)
As 2015 was approaching, it was very clear that the UN desperately needed a successor for the Millennium Development Goals. One which was going to overcome the challenges that plagued them. As the first step in 2012, during the Rio +20
Conference the UN formed two teams to build an elaborate agenda to replace the MDGs for the UN's upcoming 2015 conference in New York. The two teams were the UN Task Team, chaired by the Prime Minister of the UK, and the Presidents of Liberia, and Indonesia, and the Open Working Group managed by Intergovernmental Groups. The UN task team was responsible for preparing the UN's post-2015 agenda, whereas the open working group was responsible for preparing new development goals and setting targets.
The Open Working Group worked with civil society organizations, consulted all member countries, and engaged the public using face-to-face and online meetings, and door-to-door surveys. Both groups worked in parallel and combined their knowledge over this three-year period, which is known as the Post-2015 Development Agenda, encompassing both the agenda and the goals and targets.
In September 2015, during the conference in New York, after three years of negotiations and battles, the UN showcased the blueprint to achieve a better and sustainable future for all - known as the Sustainable Development Goals. 193 countries of the UN assembly committed to achieving the Sustainable Development Goals by 2030. The SDGs consists of 17 goals and 169 targets. The core framework for the SDG's expands on the MDGs by linking the social, economic, and environmental aspects of its goals. The SDG's address the shortcomings of the MDGs by incorporating a broader and transformative agenda.
The MDGs, which are largely focused on the targets for developing countries with funding from developed rich countries. However, the SDGs are for all countries developed or developing all of whom are expected to work together to achieve the universal goals and targets. The MDGs also provided no specific role for civil society organizations, whereas the SDGs have engaged the CSOs from the beginning by consulting them during a three-year post-development agenda period. Finally, the MDGs were drafted by technocrats who failed to consult global knowledge and expertise. This meant that the MDGs were disconnected from ongoing global debates on development priorities.
On the other hand, the SDGs were drafted by an open working group which worked with countries and organizations from all over the world. Despite overcoming the challenges and criticisms of the MDGs the question remains are the SDGs going to be successful while the SDGs provide a broader agenda than the MDGs with a potential for course correction. Will this make a difference? With transformative goals and target setting, there is a chance that countries might choose SDG's that are easier to implement, requiring minimal national adaptation which might result in only a handful of the SDG goals and targets receiving policy attention, effort, and resources.
Few things are certain, if the SDGs are to succeed they will depend on continued advocacy for each of its targets. Promoting an inclusive approach to development and incorporating a more granular and local approach. And as new global challenges arise like information warfare surveillance populism technology-based inequality and immigration, the SDGs and their interpretation will need to be adaptable.
The question is, is the UN flexible enough to do that? Or does a changing world need new goals to be drafted more frequently than they are now? Here's a quick recap. As 2015 was approaching, the UN needed a new agenda to overcome the challenges and criticisms of the MDGs. The UN formed two teams the UN task team and the open working group to develop a detailed agenda. The UN presented the SDGs in 2015 consisting of 17 goals and 169 targets to 193 countries. The SDGs addressed all the shortcomings of the MDGs. Continued advocacy promoting an inclusive approach to development and incorporating a local approach are some of the ways the SDGs are expected to succeed. The question remains are the SDGs going to be successful or will they be plagued by challenges that prevent them from making any meaningful impact?
Thanks for watching! Hope you enjoyed our video. If you did, leave us a like and subscribe if you haven't already, and let us know in the comments what you'd like us to cover next. If you'd like to learn more about sustainability, assess your skills, and interact with like-minded people, come join our SDG Plus community. You can test yourself too.
There are 17 SDG Goals, with Goal 7 on energy being the most directly related to this course. We will discuss Goal 7 next. However, it is important to be familiar with the other 16 goals because we will see that energy also permeates nearly all of the other 16. This is because energy impacts many other environmental, social, and economic aspects. Goals on infrastructure, economic development, and sustainable cities among many others have energy-related elements. Review the various targets for each of the 17 SDGs and see how many you can make the connection to energy reliability, security, and accessibility!
Goal 7 and its Targets
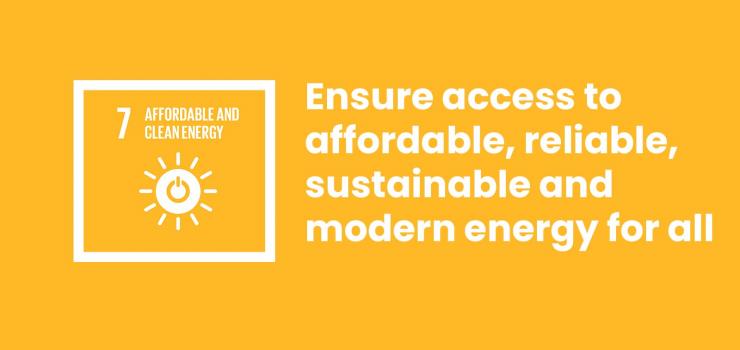
Goal 7 and its Targets
Goal 7 is to ensure access to affordable, reliable, sustainable, and modern energy for all. There are five targets associated with this goal, each having at least one indicator of success. The intent of the targets is to set discrete, measurable actions, with a way to assess progress and performance that will lead to meeting the main goal. We see in the goal and the targets' actions that will get at the key tenets that drive the energy dialogue- reliability, security, and accessibility.
The Sustainable Development Goals
Read the Executive Summary and scan the rest of the report, Tracking SDG 7, Energy Progress Report 2022 [7]. Pay attention to improvements in the targets since 2010 and note the variations. You will note that improvement is not consistent across all targets. If you need an overview refresher, go back to the required reading with the 17 SDGs and click on Goal 7.
Questions to guide your reading:
- Do you get a sense of what may be holding back progress where it has fallen short?
- Or are the targets too ambitious?
- In your opinion, do these targets get us to the overall goal?
One of the critiques against the SDGs is that they are too overreaching. In others they call for an ideal end state that is very hard to meet, and even if met, hard to validate. Considering that the goals have ten-year timelines, do you think Goal 7 is even realistic? The challenge with setting such goals is that progress is difficult to characterize. For example, if the ultimate goal is that the goal applies to everyone, then it is hard to say if the progress that was made is good or bad.
Let us think about the four attributes we learned earlier, reliability, security, accessibility, and sustainability. Do you feel all four aspects are addressed with Goal 7? Arguably, these four attributes are key and if Goal 7 doesn’t collectively address these, this SDG may not be the right path forward.
As we go through the rest of the class, let’s keep these aspirational SDGs goals in mind in assessing progress in these areas of reliability, security, and accessibility and sustainability.
Lesson 1 Infographic
Infographic Assignment:
In lesson 1 we learned about the 4 factors of Energy Provision, which include reliability, security, accessibility, and sustainability. We also reviewed Goal #7 of the Sustainable Development Goals established by the Earth First Summit. Now you’re going to engage in an activity to demonstrate your understanding of how these concepts relate to and impact one another through the creation of an infographic.
Purpose of this infographic:
To successfully complete this assignment, you will create an infographic that illustrates a connection between one of the Goal 7 targets and as many of the 4 factors as possible.
Communicating Visually:
As you begin to work on your infographic, keep in mind that a single target from Goal #7 can be applied to more than 1 factor. This means you’ll need to spend some time thinking about the various connections and how to demonstrate them in the most concise and effective manner possible. You’ll need to illustrate all this information in a manner that is easily understood ‘at a glance,’ meaning there shouldn’t be any additional resources or information one should need to read in order to understand what you are trying to communicate. For example, if you feel the second target described in the SDG #7 aligns with security and reliability, you’ll need to visually communicate these connections.
Successfully Completing this Assignment:
If you haven’t done so already, review the foundational resources provided in the Orientation lesson. They are titled, Creating Infographics, and Overview of Infographic Assignments. The rubric used for grading this assignment is provided on the following page in Canvas.
If you have any questions, please post them to the Questions about EGEE 401 Discussion Forum.
Infographic Information Video (4:13):
2: Understanding Energy Outlooks
Overview
Overview
In this lesson, we provide links to outlooks from 8 different entities, reflecting views from government, non-governmental organizations, academic institutions, think tanks, and industry. These are just a few examples and you are free to search for others. We have included a short narrative as to the nature of the organization preparing the outlook. When you explore the links provided, there is opportunity to learn even more about the organization.
In this Lesson 2, we will learn about “what” an outlook is. In lesson 3, we will learn how to use this information to draw conclusions about energy supply and demand. We will be looking at the same readings for both lessons, but from different perspectives.
Learning Outcomes
By the end of this lesson, you should be able to:
- describe the purpose of energy outlooks,
- identify the types of outlooks and who prepares them, and
- recognize differences and similarities among various outlooks.
Lesson Activities
| Read | Lesson 2 content |
|---|---|
| Write | 325 word (+/- 10%) essay |
Questions?
If you have questions, please feel free to post them to the Questions about EGEE 401 Discussion forum in Canvas. While you are there, feel free to post your own responses if you, too, are able to help a classmate.
What are Energy Outlooks?
What are Energy Outlooks?
Energy outlooks are all about reflecting “supply and demand.” They are projections of energy demand and availability looking out into the future. Whether combined into one document, or done as different products, outlooks can be short term, such as week to week or month to month, and others are longer term, some looking out a number of years. Whereas these outlooks may forecast 20 to 40 years, they are typically updated annually because conditions change frequently and many times unpredictably. So they are actually rolling predictions of 20 to 40 years, updated annually. For example, the COVID pandemic had an unexpected and profound impact on energy demand. We will discuss COVID impact again in a later lesson.
As you can imagine, in order to create such projections, some rather important assumptions must be made. These may be based on past energy supply and demand history combined with other patterns, such as population growth and distribution or economic development. Secondly, different types of organizations create outlooks because they wish to highlight specific trends or tell a story. In theory, all of the outlooks would be the same, or put another way, we would only need one to be done. However, in reality, not everyone agrees on what assumptions should be made and not everyone agrees on how to present the information.
It would be convenient if there were one master outlook, but in reality, there are a number of such outlooks, prepared by different organizations. A popular and important one is developed by the Energy Information Administration, which is an office of the U.S. Department of Energy.
Understanding An Outlook
Understanding An Outlook
In order to help you understand how to review/analyze these outlooks, we’re going to take a look at one together. We chose the EIA outlook because it is probably one of the more comprehensive options, is relatively “neutral” in terms of possible biases, and has some excellent navigation and interactive features.
Go to the link for the EIA [11]. You see on the landing page a layout of how to access information. As you scroll down the webpage, you will note that there are several options for how the information is presented. What EIA has done is divide the full report into many sub-publications that focus on specific aspects. The landing page also provides quick access information such as key takeaways and supporting information as well as a link to download the most recent outlook report.
LEARNING POINT 1:
Understand the overall layout and structure of the outlook.
As to the linked documents, they provide reports on energy supply sectors such as petroleum, natural gas, and electricity. EIA also provides reports by user sector, such as industrial, residential, and transportation. Finally, they provide supporting information such as related emissions data.
LEARNING POINT 2:
Understand how the information is sorted and presented.
Open the full report by scrolling down to the "Narrative" section and open the link "Read the full narrative." In the Foreward and Executive Summary the refernce case and side cases are discussed. This is very important information that explains how EIA developed their projections, what assumptions they use, and how things could be different. This type of information is critical to know when using any outlook because it puts the data into context.
LEARNING POINT 3:
Make sure to have some understanding of how the projections were developed in terms of sources of information and assumptions made.
Realizing that it is likely different outlooks might show different trends, it is important to recognize why that may be.
Finally, on the main page click on the "Interactive" icon under the "Data Tables - Reference Case Tables" header. Arguably, this is one the best features of this outlook, and I think makes EIA one of the better sources. I would recommend you “play around” with this interactive viewer. You will note several drop-down menu tabs where you can select many different variations of the information and see how the trends vary going into the future. The Publications Tables tab will let you pick an outlook year, and the Scenarios tab will let you pick the assumptions case, for example the aforementioned Reference Case. You will also see options for the various side cases. The Regions tab lets you see trends by geographic region. There are also tabs to show information either as a curve or on a map. The Map tab is particularly interesting in that you can run it as a time lapse animation to see how information changes. We will come back to this interactive Table Viewer in the next lesson where we explore the actual data.
This short tour through the EIA Outlook gives you a general sense of the kinds of information presented in outlooks.
Considerations:
I mentioned the terms alternate cases, sectors, and fuel types. It is easy to get confused as to what they all mean and why some outlooks are sorted one way, but others use a different format. It is all about the story they are trying to tell. For example, you may see energy demand sorted by user sector. These can include industrial, municipal/public, or commercial. Some even further subdivide industrial into types of industry. Sorting by user sector gives the reader of the outlook a sense of how our energy resources are shared among users. It also gives a sense of where the greatest demand is or is projected to be.
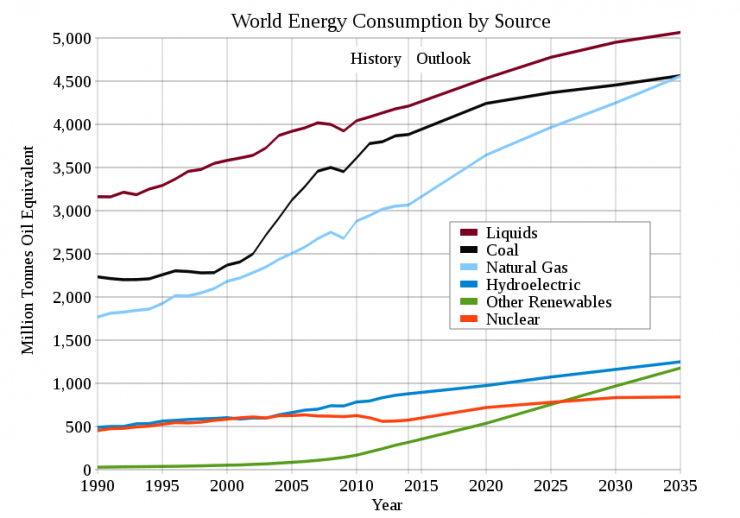
Another way to sort is by “energy sector,” or supply type. This type of sorting is used to demonstrate supply and tells us how much of each type is available and projected to be available in the future. In Lesson 3, we will take advantage of these sorting options to draw conclusions about projected supply and demand.
Particularly, but especially in the EIA outlook, they refer to alternate cases. As you can imagine, energy supply and demand in the future will be very dependent on many variables such as population growth, economic development, and policy decisions, among others. Clearly, no one can totally and accurately predict these variables, so in order to make projections, certain assumptions are made. Alternate cases are projections using other assumptions for certain variables. You are encouraged to explore some alternate cases in terms of which ones are used in the outlooks you explore. In Lesson 3, we will drill deeper into what the differences in results are between cases.
Comparing outlooks
Comparing Outlooks Assignment Overview:
On the following page, there is a list of several organizations with links to the outlooks they have produced. Your task is to review two of these, ideally from different types of organizations, to get a sense of what these are and what they tell us. Do not be too focused on the actual data. In a future lesson, we will deep dive into these same outlooks and explore the data in more detail. For now, the idea is to understand outlooks and start to get a sense of which types you would want to review based specifically on what you want to know.
Note that, for some organizations, several links are provided. This is because we have included annual outlooks for multiple years when available.
Purpose:
To successfully complete this assignment, you will write an essay which compares two or more outlooks to identify their priorities and how those relate to the Four Factors [Reliability, Security, Accessibility, Sustainability] discussed in this course.
Identify connections:
As you review the outlooks, keep in mind the four key attributes of energy in our society- reliability, accessibility, security, and sustainability. As you explore the outlooks, see if you can find how these attributes are reflected. For example, the World Energy Council states: “Securing flows of clean, reliable, affordable and sustainable energy to everyone, anywhere at any time is the ultimate vision of the World Energy Council.” You may explore how they use their publication to illustrate that point.
Successfully completing this assignment:
In 325 words (plus or minus 10%) write an essay that compares two outlooks and addresses the following points. Remember that for this lesson, we are focused on the general attributes of the outlook and not the specific information. Try to avoid comparing the data. Your essay should be submitted using Microsoft Word and will address the following questions:
- What is the purpose and focus of the outlooks you have chosen?
- Briefly describe the organizations that created the outlook- what is their purpose and focus? Priority area?
- How do they differ from each other?
- In general, how are the differences between the preparers reflected in the nature and format of information presented?
- Recall the exercise from Lesson 1 when you played the role and had to prioritize reliability, accessibility, security, and sustainability.
- How would these outlooks help you make that decision?
- In your opinion, when would you feel it appropriate to use one over the other, or does it matter?
- Could these outlooks help inform progress towards SDG #7?
Outlooks for Review
Energy Information Agency:
The Energy Information Administration (EIA) is an office within the U.S. Department of Energy and was established in 1977. It is primarily a statistical and analytic agency and provides neutral data for others to use.
Energy Information Agency [11]
International Energy Agency:
The International Energy Agency was established in 1974 in the wake of the oil crisis of 1973 and has evolved to be an information source of oil market and other energy sector data.
World Energy Outlook 2023 [12]
World Energy Outlook 2022 [13]
Global Energy Review 2021 [14]
Global Energy Review 2020 [15]
International Renewable Energy Agency:
The International Renewable Energy Agency (IRENA) is an organization supporting the movement towards a sustainable energy future, mainly through the promotion of renewable energy sources.
World Energy Transitions Outlook [16]
Global Renewables Outlook 2020 [17]
World Energy Council:
The World Energy Council (WEC) is a bit different in that their mission is more about sharing information and experiences, such as case studies, to help the delivery of energy. Forecasting is a component of what they do, and the World Energy Scenarios link below is their closest product to a traditional outlook.
World Energy Trilemma Index 2022 [18]
World Energy Scenarios 2019 - Exploring Innovation Pathways to 2040 [19]
Resources for the Future:
Resources for the Future (RFF) is a private nonprofit ‘think tank” which provides neutral and unbiased research to help inform energy-related decision and policy making. In addition to their outlook publication, which is available at the links below, they offer a succinct summary of key findings on the landing pages of these links.
Global Energy Outlook 2023 [20]
McKinsey and Company:
McKinsey and Company is a private sector diversified worldwide consulting firm. They have a highly varied suite of clients in the private and public sector. One of their products is providing studies and analyses. They prepare an oil and gas outlook.
Global Oil Supply Demand Outlook to 2040 [21]
ExxonMobil:
ExxonMobil is an energy company that provides energy sources such as oil and gas. They provide full life cycle services from exploration for new supplies of oil and gas, through producing fossil fuels from their fields, and all the way through refining, and marketing. ExxonMobil has diversified over the years to include non-fossil fuel sources such as wind and solar. ExxonMobil was born from the merger of Exxon and Mobil oil corporations- two long standing American icons of the industry.
ExxonMobil Outlook for Energy [22] (links to reports at the bottom)
BP:
Like ExxonMobil, BP is an energy source company that over time has diversified from only oil and gas, to now include renewables. BP used to be known as British Petroleum but changed its name to Beyond Petroleum to capture their expanded portfolio of sources.
BP Energy Outlook [23]
3: Using Outlooks
Overview
Overview
So far, we have explored what energy outlooks are, who creates them, and we started to understand what they tell us. In this lesson, we will use the information learned to actually use the outlooks to obtain information. Specifically, we will use the EIA outlook to learn aspects about global and U.S. national energy supply and demand.
This exercise has real-world implications. Policy-makers at the state level across the U.S. are preparing for potential energy shortages this year including heating oil shortages paticularly in the Northeast and Upper Midwest. State officials are tracking supplies and prices of key heating fuels in order to assess where shortages might occur if prices would rise causing problems for those who could not afford it. The EIA outlook, in particular, is a key source of information for the reponsible officials as it gives a sense of how much fuel might be available, where it could be, and what the trends in prices are.
Learning Outcomes
By the end of this lesson, you should be able to:
- Make comparative analyses from data sets provided in the outlooks such as differences in energy use trends among sectors or differences in trends between energy sources
- Learn how the trends would vary if assumptions change
- Draw conclusions from graphs generated using the EIA outlook
Lesson Roadmap
| Read | Lesson 3 content |
|---|---|
| Create | A graph based on outlook data |
| Write | An essay which summarizes the data on your graph |
Questions?
If you have questions, please feel free to post them to the Questions about EGEE 401 Discussion forum in Canvas. While you are there, feel free to post your own responses if you, too, are able to help a classmate.
Analyzing Outlooks
In order to prepare for the assignment of this lesson, let’s go back to the EIA website to create some graphs and see how we can glean information from interpreting the data.
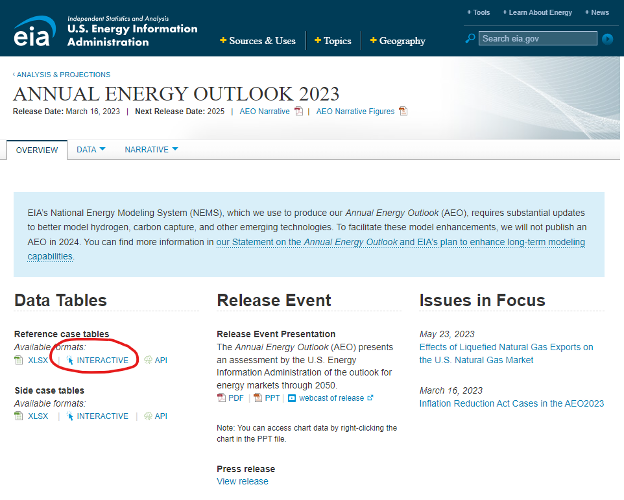
Under “Data Tables” in the subsection titled “reference case tables” click on Interactive (highlighted with a red circle in the image above). The page opens to Table 1 from the Annual Energy Outlook 2023. On the top line to the right of the table title, there is a drop-down menu called “Publications and Tables” with numerous options to choose from.
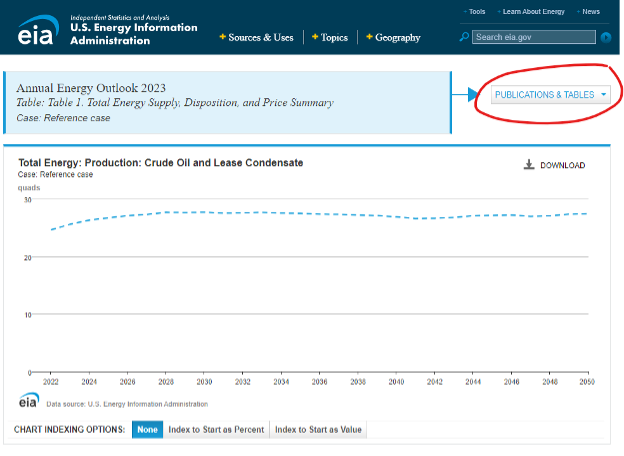
For the first example, I chose Annual Energy Outlook 2023 as the publication, and Table 2.
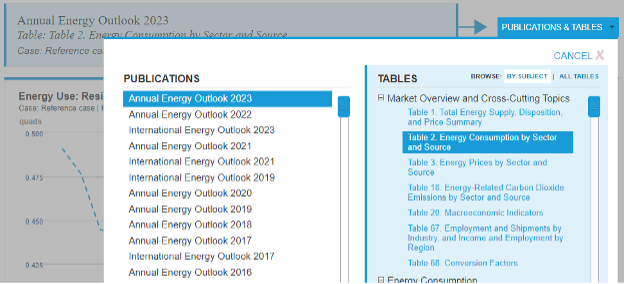
Below the graph, you will see a table with a column called PIN. Here we see the usage sectors (residential, commercial, industrial, transportation, etc.) and, underneath each of those, you will see the fuel type. Click on the light blue icon to the right of your desired entry or entries in the PIN column to plot those specific items above in the graph. It will superimpose as many as you choose.
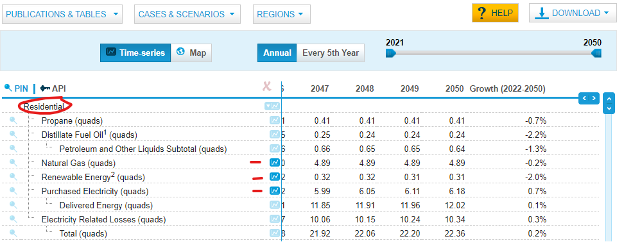
I chose to plot electricity, renewable energy consumption and natural gas consumption in the residential sector. I clicked on the three items and we see them plotted. You can now use this information to draw some immediate conclusions. For example, we see that renewable energy use in the residential sector stays very low, and declines slightly, over time. Natural gas usage is much higher, but it also declines slightly. Electricity demand, on the other hand, is the highest in terms of projected use, and actually increases over time.
Why is that? You would look into the rest of the report, especially the sections on those sectors and sources, to see why. Could it be that the shift of natural gas prices is making it less attractive? Is fracking projected to be banned at some point? Why is renewable such a small percentage and actually declining? To answer such questions, you will need to drill into the outlook a bit.
Feel free to go back to the landing page for the 2023 Outlook and click on the “Narrative” drop down to learn more about what is driving the trends and usage you have plotted. The overall point is that, by navigating the various parts of the Outlook, there is a wealth of information which can be gleaned from the narratives and data.
Interpreting Data
Overview:
By reviewing outlooks, we can gain an understanding of the drivers or influences that impact how they are created. Various companies seek to create outlooks that reflect the priorities that are most important to their goals and the anticipated needs of their consumers. Being able to analyze and interpret the data is an important skill you will need in order to achieve success in your chosen career. For this assignment, we will deep dive into one of the outlooks, the EIA Outlook, and explore the data in more detail.
Purpose:
To successfully complete this assignment, you will write an essay where you interpret the trends reflected in a graph you will create using the interactive function of the EIA Outlook.
Interpreting and explaining data:
As we demonstrated in the example above, it is possible to plot information from several variables in order to interpret what the patterns and trends tell us about energy sources and uses. This could be aspects related to different sources of energy such as natural gas or coal; or aspects about user patterns, such as residential vs. industrial. It is important that there be logic as to why you chose the variables to compare, as well as knowing where to find the supporting information from which you can draw conclusions about what you see. In the example above, we looked at other information in the EIA Outlook to explain the patterns that we saw in the graph we constructed.
Successful Completion:
We will revisit the EIA outlook we explored in Lesson 2, and the link. Energy Information Agency: The Energy Information Administration (EIA) is an office within the U.S. Department of Energy and was established in 1977. It is primarily a statistical and analytic agency and provides neutral data for others to use.
https://www.eia.gov/outlooks/aeo/ [11]
In 325 words (plus or minus 10%) write an essay that explores information presented by the outlook. Begin by creating a comparative graph as we did in the example but select different parameters. It would be best to compare logical items. For example, you might wish to compare industrial natural gas demand trends vs. residential trends. Or you might want to compare electricity vs. gasoline in the transportation sector. Do not feel limited to only two items; feel free to group several together that tell a logical story. For example, in our sample above, we chose two energy sources in the residential sector in order to try to draw conclusions. Your essay should be submitted in Microsoft Word and will address the following questions.
- Which parameters did you choose and why?
- What are the trends for each and how do they differ?
Using supporting information from the rest of the outlook, try to explain why the trends are what they are. The best way to do this is to read about the logic for each item. You can use the topic specific PDF or PPT links on the home page.
What is your opinion about the projection? Does it make sense to you? In our example above, one might wonder why the renewable energy use in the residential sector never really takes off.
4: Energy Transition- Fossil Fuels to Renewables
Overview
Overview
In this lesson, we will focus on the drivers for change in regard to electricity. What is moving us from fossil fuels to renewables? How does this shift impact reliability, accessibility, security, and sustainability? Conversely, how do these four factors drive the transition? In the previous lessons, we explore the outlooks that illustrate projected trends in supply and demand. These outlooks illustrate these trends, and, to an extent, offer some explanations. In this lesson we will step back and take a look at the high-level drivers of the trends these outlooks tell in regard to the transition from fossil fuels to renewables. In the next lesson, we will explore trends in energy efficiency and other ways to deliver electricity more effectively to users, regardless of how it is generated.
Learning Outcomes
By the end of this lesson, you should be able to:
- Recognize the drivers and trends involved in moving from fossil fuels to renewables;
- Relate these trends to energy sustainability, reliability, accessibility, and security; and
- Describe how these drivers and trends support the SDG #7 targets.
Lesson Roadmap
| Read | Lesson 4 Content and other assigned readings |
|---|---|
| Participate | One Minute Essay Activity |
| Write | 225 word (+/- 10%) essay |
Questions?
If you have questions, please feel free to post them to the Questions about EGEE 401 Discussion forum in Canvas. While you are there, feel free to post your own responses if you, too, are able to help a classmate.
Introduction to Energy Transition
Introduction to Energy Transition
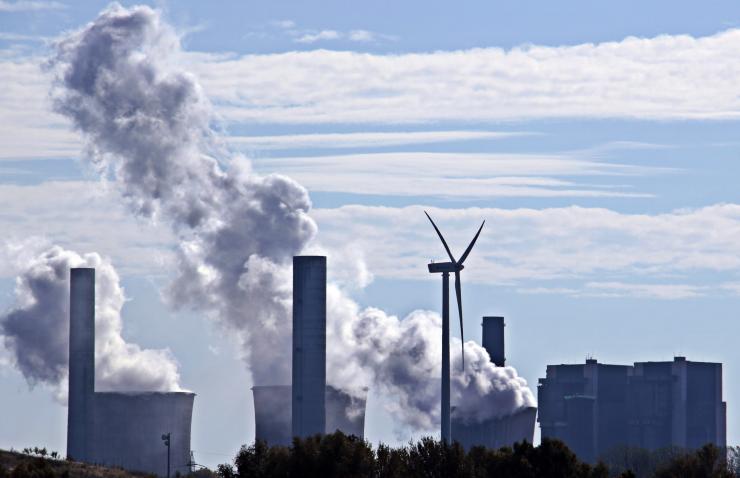
Throughout history, our society has seen periodic shifts in how we acquire energy. In some cases, it was done by introducing new technologies such as steam power engines or widely available electricity. In other cases, ironically, it was applying old approaches in more advanced ways such as solar energy heating or windmills. Note that prior to the heyday of the use of electricity, energy necessary to do work was obtained from sources we now consider renewables. These include wind, solar, and hydropower. Even fossil fuels date to the early days of organized society. Cultures used seeping crude oil, peat bogs, and coal to burn for light, heat, and cooking. Windmills dotted the Dutch landscape, and water wheels were common in early America. In the pre-electricity era, wind and hydropower were used more for mechanical purposes such as pumping water or spinning mills. Solar was used mainly for heating and cooking.
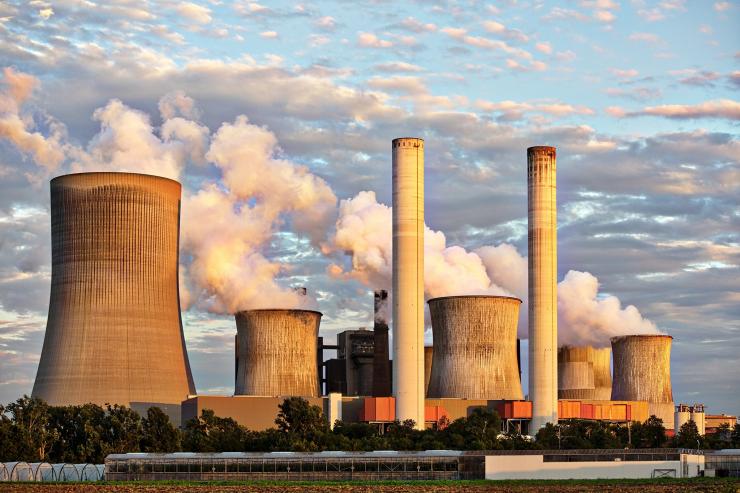
Credit: power-plant-industry-chimney [25] by Benita5 [26] from Pixabay [27] is licensed under the Simplified Pixabay License [28]
Electricity generation found a new application for fossil fuels, hydropower, and wind. The ability to generate electricity using some form of energy to spin turbines which generated current transformed the energy landscape. Burning fossil fuels generated steam to turn turbines. Even with the advent of renewable sources, including nuclear, the primary purposes are for generating electricity. Hydropower and wind energy now spin turbines, and solar can either heat water into steam or generate electricity directly via photovoltaics.
We learned from the outlooks that there is information available predicting how this transition will play out. One may think that, with all of the thinking that goes into an outlook, they would be rather accurate and reliable. That is relatively true until there is a “Black Swan Event.” In general, this is an expression for an event that occurs rarely and randomly but has severe consequences. Some definitions go on to say it is also something that, in retrospect, should have been foreseen. The Covid-19 pandemic is such an eventand perhaps even the war in Ukraine.
The 2022 edition of the IEA World Energy Outlook has this highlight statement: "The world is in the midst of its first global energy crisis – a shock of unprecedented breadth and complexity. Pressures in markets predated Russia’s invasion of Ukraine, but Russia’s actions have turned a rapid economic recovery from the pandemic – which strained all manner of global supply chains, including energy – into full-blown energy turmoil." Coupled with the lingering effects of the pandemic, the long-term impacts to the prospects for rapid clean energy transitions remains unclear. It is too soon to say whether today’s crisis represents a major setback for efforts to bring about a more secure and sustainable energy system, or a catalyst that accelerates the pace of change. The war in Ukraine and the pandemic continue to unfold; many uncertainties remain, and crucial energy policy decisions have yet to be made.
Drivers for the Shift to Renewables
Drivers for the Shift to Renewables
Let us explore general drivers to shift from fossil fuel to renewables, and some related disadvantages regarding energy security, reliability, accessibility, and sustainability. These are only high-level thoughts; in this lesson, you will be exploring more about these aspects. It is clear that the primary driver to go from fossil fuel to renewables for electricity generation has been sustainability- specifically the goal to reduce carbon emissions.
Reliability:
As we will explore more deeply in future lessons, the concept of reliability is “being able to depend on” getting the energy you need when you want it. The expectations for this vary around the world. For example, in the developed nations, especially the USA, reliability means having energy “24/7/365.” Any interruption is considered unacceptable, at a minimum for comfort and lifestyle, but, in cases of emergency services, for example, it can mean the difference between life and death. Being able to ensure reliable energy and having a plan to contend with lapses in reliability is often referred to as energy resilience.
We know, however, that there is a difference between the amount of energy required to keep society functioning and the amount of energy desired for discretionary activities. For example, powering a hospital is much more critical than lighting a stadium for a sports event. This necessary minimum amount of reliable energy is called the “baseload” and we will learn more about it in a later lesson. Historically, fossil fuel or nuclear plants provided most of the baseload, with hydropower becoming a key component more recently. Renewables are becoming greater contributors to baseload production but, to-date, they are not reliable enough to supply the baseload without additional generation methods.
Required Reading:
One interesting perspective can be found in this Minnesota based article, Why Transitioning to Renewable Energy Leads to Power Outages [33].
Accessibility:
Recall this means being able to get energy to your point of use. Having a reliable energy grid is not of much comfort to a person who cannot access it. In developed countries, especially the USA, accessibility is an issue in very remote areas. Even the most impoverished areas in the USA have access to the grid. However, it is important to note that affordability is a subset of accessibility. If you cannot afford to pay for energy, then it is not accessible to you, even if your home is connected to the grid. Interestingly, renewables have a history of providing energy in cases where grid access or affordability has been an issue. These are examples of onsite solar or wind to generate some power over the short term if grid access is disrupted. We are also now seeing movement toward using renewables to satisfy a portion of energy demand to improve affordability. This will become more widespread as the cost differential between renewables and non-renewables equalizes.
Security:
Here again, distributed energy and renewables, which are more adaptable to site-based production, are becoming desirable over a traditional nationwide grid. We have seen from blackouts over history that disruptions to the grid propagate quickly throughout the system and in a very short time can plunge major areas of the country into darkness. I had the rather unfortunate experience of living in New York City during the 1963 and 1977 blackouts. Both were caused by a very localized problem that quickly spread due to the cascading nature of the grid trying to make up loss of supply. A relatively new concern is the potential for intentional disruption, such as terroristic acts.
Sustainability:
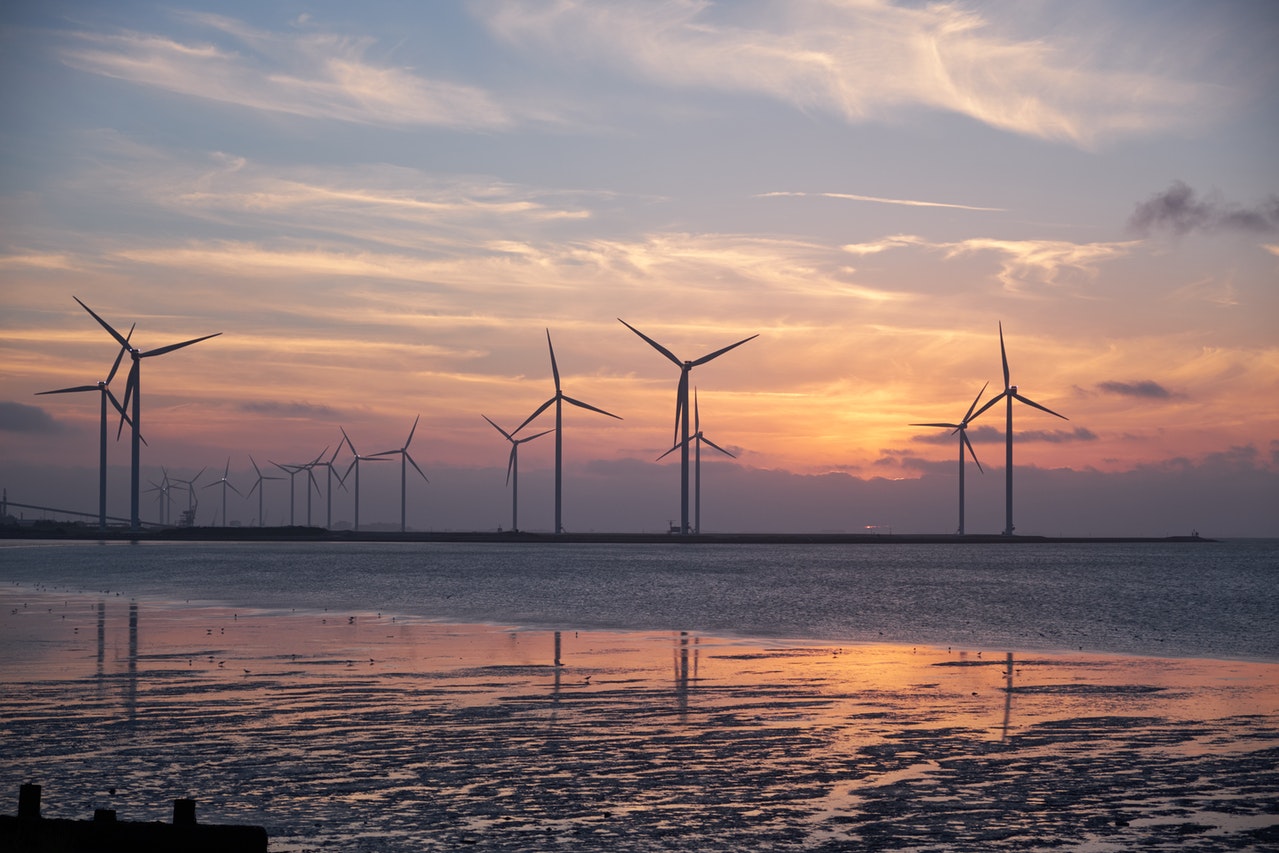
Probably the newest of the four attributes, sustainability drivers for energy have been the underpinning of the rapid expansion of renewable energy across the world. Here we see the greatest of the conflicts- while renewables tend to be the most “sustainable” in terms of environmental impact, they have struggled to become affordable compared to fossil fuels. More importantly, renewables alone cannot yet meet the demand, especially baseload. Until that is possible, through improved capacity to store energy combined with more built capacity, it is unrealistic to expect the energy supply to be 100% renewable in the near future. Renewable energy, such as wind and solar, by virtue of its characteristics, is practical for distributed energy- that is energy produced locally for a limited area, rather than drawing from a regional or national grid, although renewable energy does feed the grid.
Required Reading
Required Reading
A very interesting piece published by the Stockholm Environmental Institute goes into detail about the complexities and perceptions associated with reconciling fossil fuels and climate change goals.
Starting at the bottom of page 8, there is a section on Questions for the Next Level of Analysis. There is one specific question: “Is there a basis for a moral or legal claim against fossil fuel extractors?” Based on what we have learned and discussed so far, what are your thoughts on this question?
Skim the following article from the Stockholm Environment Institute and participate in the One Minute Essay Activity.
Fossil fuel production in a 2°C world: The equity implications of a diminishing carbon budget [34]
Questions to guide reading
- Is the argument against fossil fuels enough of a driver to renewables?
- Does the article adequately address accessibility, reliability, security, and sustainability in making the case for shifting from fossil fuels to renewables?
Examples of the Shift to Renewables
Examples of the Shift to Renewables
In other classes, you have learned the basics of energy, including types of energy created. You have also learned the basics of the various renewable energy sources. A very interesting effort is called Project Drawdown [35]. The overall intent is to provide insight and perspective on possible solutions to reduce emissions and mitigate climate change. Climate change is the subject of a future lesson, but the project does have some excellent insights on a number of solutions. We will be referring to this work frequently in this class. For this assignment we will focus on the section that talks about solutions for electricity generation in the context of transitioning from fossil fuel to renewables.
Purpose:
This assignment will help you practice looking at specific solutions in the context of the broader energy picture and how solutions need to be reconciled with energy-related needs.
Critical Thinking and Analysis:
This assignment will help you practice reviewing solutions and innovations in the context of accessibility, reliability, security, and sustainability.
Successful Completion:
This assignment has two parts to complete.
Part one:
Review the Drawdown website, specifically the section on electricity [36]. It covers both energy sources and solutions for efficiency and distribution. You should pay close attention to unique applications of wind and solar such as micro-wind and concentrated solar and different ways to generate energy from fossil fuels, such as cogeneration. You will note that the idea of Drawdown is to propose proven solutions to address energy challenges. These examples include a wide range of solutions but intend to demonstrate that practical solutions do exist.
Part two:
In 225 words (plus or minus 10%), write an essay which discusses climate change driven solutions and their potential impact. Begin by choosing one of the examples listed below and explain how it addresses one of the four attributes (accessibility, reliability, sustainability or security).
Review the entries for:
- Geothermal Power
- Utility Scale Photovoltaics
- Rooftop Solar
- Concentrated Solar
- Biomass Power
- Nuclear Power
- District Heating
- Micro Wind
- Methane Digesters
- Landfill Methane Capture
- Waste to Energy
- Distributed Solar Voltaics
- Ocean Power
- Wind Turbines- Onshore and Offshore
- Small Hydro
- Solar Hot Water
*You might also be interested in reviewing the introduction material on the homepage to learn more about the project.
5: Energy Transition- Using Less Energy Smarter
Overview
Overview
In the previous lesson, we learned about the drivers moving us from traditional fossil fuels to renewables in terms of generating electricity to meet the energy demands of society. In this lesson, we will explore some aspects of how we can use the energy provided, regardless of source, as efficiently as possible. We will also learn that efficient use of energy is not only about how well we use it, but also how efficiently it gets to you.
Learning Outcomes
By the end of this lesson, you should be able to:
- Illustrate application of Energy Efficiency,
- Illustrate how distributed energy and microgrids relate to traditional national grid,
- Explain the concept of Demand Side Management,
- Give examples of uses of a Smart Grid.
Lesson Roadmap
| Read | Lesson 5 Content and all assigned readings/videos |
|---|---|
| Discuss | Demand Side Management |
| Create | Infographic |
*Contributions to this lesson by Vera Cole.
Questions?
If you have questions, please feel free to post them to the Questions about EGEE 401 Discussion forum in Canvas. While you are there, feel free to post your own responses if you, too, are able to help a classmate.
Energy Efficiency Introduction
Energy Efficiency Introduction
There are several terms related to this topic that are important to know. For this lesson, we will touch on energy efficiency, distributed energy and microgrids, and the future of the way energy is delivered, which includes smart grids and demand side management.

Credit: Eight Electrical Metric Meters by Tim Mossholder [37] is licensed under CC BY-NC-ND 2.0 [38]
Energy Efficiency
Energy efficiency is the amount of useful energy you get from any type of system. It is calculated as the useful energy output divided by the total energy input. For example, a light bulb converts electricity to light and heat. Typically, the light is the "useful" output, and the heat is a byproduct. Because only five to eight percent of the energy used by a standard incandescent light bulb is converted to light, the rest is dissipated as heat.
Stated another way, energy efficiency generally means how effectively we use energy to accomplish a function. For example, a refrigerator that uses less energy than another model to keep the same amount of food cold is said to be “more efficient” than the other model. Another aspect of energy efficiency is how much of the energy provided is used as compared to that which is wasted. For example, with a steam boiler, the higher the percentage of the heat generated by burning fuel that is translated to the heat output in steam, the more efficient it is said to be.
The traditional grid is relatively inefficient because so much energy is lost in transmission between the power plant and the ultimate user. This is in part due to heat loss generated by the resistance of the transmission lines. Without getting into physics here, suffice to say that long distance transmission and traditional power plants lose energy as waste, usually as heat, between initial generation and delivery to your home. These losses average 6 to 8%, and minimizing these losses, combined with managing how much energy you use, serves as the foundation for the energy use efficiency movement. This doesn’t sound like much, but when you consider the losses at the power plant simply from burning a fuel to generate power, you will start to get a sense of how much energy it takes to make electricity and how important it is to be as efficient as possible from generation to transmission to end use.
The term "energy efficiency" is also used with a more broadly scoped meaning, such as this previously published definition from the World Energy Council: "energy efficiency improvements refer to a reduction in the energy used for a given service (heating, lighting, etc.) or level of activity. The reduction in the energy consumption is usually associated with technological changes, but not always, since it can also result from better organization and management or improved economic conditions in the sector ('non-technical factors')."
In this sense, a programmable thermostat may help with "energy efficiency." Simple steps such as remembering to turn off the lights is a non-technical behavior that can also improve energy efficiency. These are examples of energy efficiency in its broader meaning, related to the smarter use of energy for a specific purpose.
Energy efficiency helps in many ways. Recall our four attributes- security, reliability, accessibility, and sustainability. Energy efficiency, which fundamentally is using less energy when possible, is one of the few approaches that supports all four. By using less energy, there is more in the system increasing reliability and accessibility (in part, due to reduced cost of power from lower demand). Needing less energy means less use of fossil fuels and other environmental impacts. And using less energy makes us less dependent and therefore more secure.
Some content on this page came from an earlier version of this course and was written by Vera Cole.
EGEE 401: Energy in a Changing World by Vera Cole via the Pennsylvania State University is licensed under CC BY-NC-SA 3.0 [39]
Distributed Energy, Microgrids, and Smart Grids
Distributed Energy, Microgrids, and Smart Grids
If energy is lost by simply moving it through long transmission lines, then logic tells us that if we can use the energy closer to where it is generated, the better off we are. The concepts of distributed energy and microgrids are based on that notion- that it is better when energy is generated and managed closer to point of use.

According to EPA, distributed energy is defined as follows:
“Distributed generation refers to a variety of technologies that generate electricity at or near where it will be used, such as solar panels and combined heat and power. Distributed generation may serve a single structure, such as a home or business, or it may be part of a microgrid (a smaller grid that is also tied into the larger electricity delivery system), such as at a major industrial facility, a military base, or a large college campus. When connected to the electric utility’s lower voltage distribution lines, distributed generation can help support delivery of clean, reliable power to additional customers and reduce electricity losses along transmission and distribution lines.”
A microgrid is simply a “small scale grid.” It does the same thing as the larger regional and national grids, but on a geographically more limited scale. It can be connected to the main grid, but once it obtains the power, it manages it through a smaller, more localized grid. Alternatively, the microgrid can have its own generation capability.
Required Video:
Watch the short video on distributed energy. It is from a company in the UK, but the concepts are directly applicable here in the USA. This video is also helpful in that it relates distributed energy benefits to several of the four attributes we have been exploring this course (reliability, accessibility (including affordability), security, and sustainability.
Powering the UK's homes and businesses is about balancing demand and supply. As a country we have constant energy needs, but when we all want to use energy at the same time energy demands spikes. For the last 150 years our energy supply has come from big, centralized sources - power stations using coal, gas, and nuclear, and more recently, renewable energy like wind farms and solar all feeding into the National Grid. But many of our older power stations are closing, and power from renewables is intermittent, leaving a potential gap in supply.
Our energy demand is also changing with the growth of electric cars and smart technologies giving us more control over our energy use, but putting more pressure on the National Grid and on our energy bills. It's why we're looking at supply and demand in a new way using distributed energy, which holds a key to more affordable, secure, and low-carbon energy. Our distributed energy and power business helps big energy consumers, like businesses and hospitals, to use energy more efficiently and become small-scale energy producers by installing energy efficiency measures, adding technologies like solar panels and combined heat and power, or by using their backup generators at periods of high demand. We can help them to design, install, and manage these assets by connecting them to our energy control centers.
From here, we can help smooth out the peaks in demand that put pressure on the network. During these spikes, our distributed energy customers can actually earn money by generating energy, reducing their consumption, or delaying their energy use. We're also seeing major developments in battery storage. This will help big energy users to better manage how and when they take energy from, or export it back to the grid. Distributed energy won't replace all of our large-scale power stations, but it will provide much-needed flexibility and help customers tackle the three big energy issues: lowering bills through energy efficiency and new sources of income, ensuring a more secure energy supply and improved site resilience, and providing a low-carbon energy system and energy footprint. We believe distributed energy has a vital role to play in the UK's energy mix, which is why we're investing 700 million pounds by 2020.
To find out more about how we're investing and how we can help your business take control of this energy, go to centrica dot com forward slash distributedenergy.
Additional Reading:
As additional reading, please read the features and benefits page on microgrids provided by the Microgrid Resources Coalition [43].
Demand Side Management
Demand Side Management
Electricity is not easily or efficiently stored in large amounts. In an electricity grid, power generation and power consumption must be closely matched at all times. If power generation and power consumption get out of balance, blackouts and other systemic failures occur. Hence, electricity must be produced on-demand, as needed. Naturally, demand changes throughout each day and throughout the year. Demands are met with a combination of power plants that are used all the time (base load) and others that are used when needed to meet peak demand. Together, they must have the collective capacity to meet actual demand, real-time.
Large swings in demand are expensive and problematic. When demand is low, expensive generating facilities (built to meet peak requirements) are sitting offline idle. When demand is high, all available generators are online, running full tilt, stressing the system, and risking reliability. Reducing large swings in demand allows for the more cost and energy-efficient design and operation of the electricity grid and its generators.
To achieve this balance, widespread efforts are being made to involve the consumer in the management of electricity demand. Overall, the umbrella term for working with customers to balance their electricity usage with the available supply is called demand response. The essential component is some form of communication with the customer or the customer’s systems so that they know when a change in their demand is desirable (supply is low, use less or supply is high, good time to use more).
There are many ways to accomplish this using tools and methods described as demand-side management (DSM). EIA defines DSM [45] as follows:
"Demand-side management (DSM): A utility action that reduces or curtails end-use equipment or processes. DSM is often used in order to reduce customer load during peak demand and/or in times of supply constraint. DSM includes programs that are focused, deep, and immediate such as the brief curtailment of energy-intensive processes used by a utility's most demanding industrial customers, and programs that are broad, shallow, and less immediate such as the promotion of energy-efficient equipment in residential and commercial sectors."
Because of seasons and weather patterns, the United States' electric grid is built for capacity we almost never use. A report from Advanced Energy Economy [46] (AEE) finds that 10% of the country's electric system is built to meet demand in just 1% of a year's hours. And reducing those demand peaks – typically met with the costliest, dirtiest electricity generation – can have a significant impact on consumers' bottom lines. UtilityDIVE (Nov 4, 2015) [47]
Other terms related to this topic are load shifting and load leveling (both refer to rescheduling electricity usage to reduce peaks), time-of-day or time-of-use pricing or real-time pricing (customer is charged more for electricity used during peak periods) and smart grid (see below).
Some content on this page came from an earlier version of this course and was written by Vera Cole.
EGEE 401: Energy in a Changing World by Vera Cole via the Pennsylvania State University is licensed under CC BY-NC-SA 3.0 (https://creativecommons.org/licenses/by-nc-sa/3.0/ [39])
Energy Storage
Energy Storage
The Energy Storage Association explains the importance of grid energy storage: "Energy storage fundamentally improves the way we generate, deliver, and consume electricity. Energy storage helps during emergencies like power outages from storms, equipment failures, accidents or even terrorist attacks. But the game-changing nature of energy storage is its ability to balance power supply and demand instantaneously - within milliseconds - which make power networks more resilient, efficient, and cleaner than ever before.” (FAQs [48])
We also know that electricity is not easily or efficiently stored in large amounts. The Energy Storage Association identifies five categories of Energy Storage Technologies [49]:
-
Batteries – a range of electrochemical storage solutions, including advanced chemistry batteries, flow batteries, and capacitors
-
Thermal – capturing heat and cold to create energy on demand or offset energy needs
-
Mechanical Storage – other innovative technologies to harness kinetic or gravitational energy to store electricity
-
Hydrogen – excess electricity generation can be converted into hydrogen via electrolysis and stored
-
Pumped Hydropower – creating large-scale reservoirs of energy with water
Primitive as it may seem, the grid-tied energy storage technology with the largest capacity is simply to pump water to a higher elevation, storing it as potential energy. Called pumped storage, or pumped hydropower, the energy is recovered when the water from the higher elevation is used to drive turbines for hydroelectric power conversion. This process uses more electricity than it produces. So why do it? When a power plant has extra capacity, it generates electricity used to pump water uphill. Then, when the plant is stretched to capacity and electricity is at its highest price, this pumped storage can be used to generate low-cost hydroelectricity.
Some content on this page came from an earlier version of this course and was written by Vera Cole.
EGEE 401: Energy in a Changing World by Vera Cole via the Pennsylvania State University is licensed under CC BY-NC-SA 3.0 (https://creativecommons.org/licenses/by-nc-sa/3.0/ [39])
Smart Grid
Smart Grid
We have discussed distributed energy that relates to the physical nature of the grid- its geographic expanse and where power is generated relative to the user. But these grids, be they the large national scale or microgrids and distributed energy, need to be able to “think and make decisions” in order to optimize power generation and distribution. We refer to this as a “smart grid.”
Required Reading and Video
Watch the short video and read the page found at https://www.smartgrid.gov/the_smart_grid/smart_grid.html [58] This website is managed by the U.S. Department of Energy and has a good overview of what we mean by smart grid.
Lesson 5 Infographic
Infographic Assignment:
In this lesson, we learned some aspects of how we use the energy provided, regardless of source, as efficiently as possible. We also learned that efficient use of energy is not only about how well we use it, but also how efficiently it gets to you. To determine how well you understood the points discussed in this lesson, you will create an infographic which relates to your personal use of energy.
Purpose of this infographic:
To successfully complete this assignment, you will create an infographic that illustrates how your home could ideally benefit from concepts of this lesson.
Communicating Visually:
Illustrate points where and how energy efficiency and the smart grid would relate, and how your home could connect to distributed energy features such as microgrids. You can show both the interior elements, as well as how the home relates to the grid in map diagram format. In your illustration, show connections, if any, to the national grid. Illustrate which elements of your home that would be part of the smart grid.
To help you in thinking of what to show, the U.S. Government has simplified energy efficiency shopping for customers with the ENERGY STAR [59] rating system, a joint program of the U.S. Environmental Protection Agency and the U.S. Department of Energy that awards Energy Star status to highly efficient products. If you'd like more information, visit the Energy Star website [60] or read through How Energy Star Works [61].
For other ideas, once again go to the Project Drawdown [62] page, click on the Electricity icon, and explore some of the innovative projects dealing with efficiency and distributed energy. Some cases have been around a while, like green and cool roofs, but others are quite cutting-edge like dynamic glass and building automation.
Successfully Completing this Assignment:
If you haven’t done so already, review the foundational resources provided in the Orientation lesson. They are titled Creating Infographics and Overview of Infographic Assignments. The rubric used for grading this assignment is provided on the following page in Canvas.
If you have any questions, please post them to the Questions about EGEE 401 Discussion Forum.
Infographic Information Video
6: Transportation
Overview
Overview
In this lesson, we will continue the discussion about energy but will turn to transportation. Other than power (electricity) generation, the largest consumer of fossil fuel and renewable energy is the transportation sector. But unlike the power generation sector, the transportation sector is not yet as advanced or as diverse in terms of alternatives as power generation. For the most part, the bulk of transportation is still propelled by fossil fuels. Even electric cars are indirectly powered mainly by fossil fuels since that is how most of our electricity is generated. Hence, when we speak of future trends in the fossil fuel to renewables transition, how that relates to transportation is critically important.
Learning Outcomes
Upon completion of this lesson, you will be able to
- Identify energy sources used in the transportation sector
- Calculate your transportation-related carbon footprint
- Find energy outlook information related to transportation
Lesson Roadmap
| Read | Lesson 6 content and all assigned readings |
|---|---|
| Participate | Graded Discussion |
| Calculate | Your carbon footprint |
Questions?
If you have questions, please feel free to post them to the Questions about EGEE 401 Discussion forum in Canvas. While you are there, feel free to post your own responses if you, too, are able to help a classmate.
Energy in Transportation
Energy in Transportation
We can explore energy in the transportation sector the same way we looked at power generation. First, energy for transportation is driven by the same four attributes as electricity- accessibility, reliability, security, and sustainability. And the definitions of these four parameters are the same as we learned in an earlier lesson, except that they manifest themselves in quite different ways. For example, use of fossil fuels is a significant contributor to greenhouse gas emissions, and therefore climate change. Striving for sustainability in the transportation sector becomes a key issue.
Second, accessibility takes on a different impact. Even though an area may have adequate access to electricity, unless it is made available in a way that can be used in transportation, such as an adequate network of charging stations, one can argue that it is not accessible.
Third, reliability may be a factor of spacing between charging stations or time to recharge batteries. If the spacing between charging stations is greater than the distance I can get from my electric vehicle on one charge, then the system is not reliable.
Finally, security becomes important as we switch sources of energy. The more electric cars we have, the more important the security of the power grid becomes. If something were to disrupt our power grid, we would not only lose electricity to run our homes and businesses but would then also lose the ability to move about.
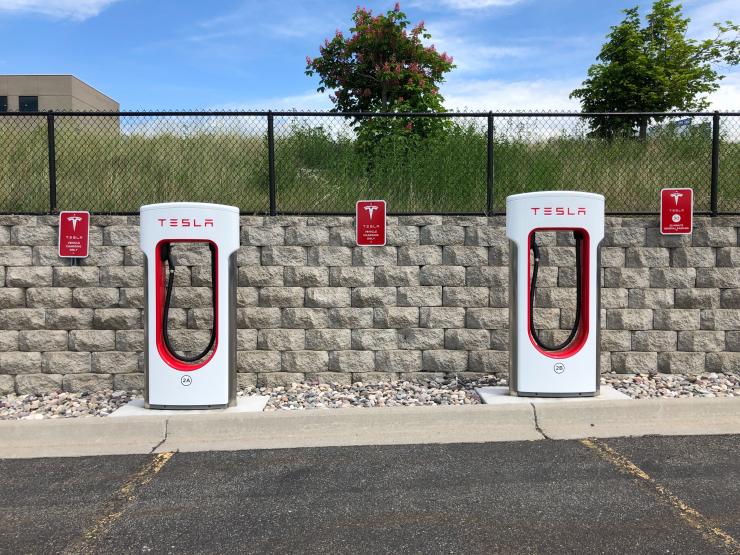
The dual nature of energy in the transportation sector.
With the advent of electric vehicles, we now must deal with two aspects of supporting the transportation sector. There is the direct use of fuels for transportation, such as gasoline or diesel for cars, trucks, planes, and trains. Even compressed natural gas or hydrogen-powered vehicles use a fuel source directly on board the vehicle. However, we now must contend with indirect fuel use. This is true of electric vehicles. The electricity must come from somewhere, and the fossil fuel to renewables transition means that it will impact the transportation sector in terms of how the electricity is generated.
We are also realizing opportunities for direct use of renewables. For example, there are experimental trains, aircraft and seafaring vessels powered by solar energy. As you can imagine, the practicality of powering something in motion with renewable energy sources becomes somewhat of an engineering and logistical challenge. That said, some of the earliest transportation, ships on the ocean, for example, were powered by wind first, before the advent of steam power (fueled by burning coal onboard).
Assigned Reading I
Assigned Reading I
We will once again return to Project Drawdown to explore energy use in the transportation sector. Recall that Project Drawdown explores examples of innovative approaches and technologies to lead to more sustainable energy production and use, especially energy with a lower carbon footprint.
https://drawdown.org/sectors/transportation [65]
Scan the "Solutions in this Sector" examples at the bottom of the page. You will explore some exciting options for more efficient and sustainable solutions, realizing the point made above that transportation sector has a significant carbon footprint. And you will also note that the answer is not always a more efficient vehicle. Sometimes the solution is looking at mobility in a completely different way.
For example, a more well-known alternative in transportation that has been around for a long time is mass transit and carpooling. The idea behind these options is to put more people in fewer vehicles. Even if the vehicle itself is not any more efficient than in the past, the overall impact is still less because you move more people per unit energy. But in the Project Drawdown examples, we also see the evolving concept of “virtual transportation.” That is being somewhere else, but not physically having to move. Telecommuting and virtual meeting is on the rise. And the COVID pandemic has propelled society into the virtual realm much faster than may have been originally expected, or desired! Finally, there are examples of moving from point A to point B, but using more mechanical energy forms of transportation, such as bicycle. And of course, there is always good old fashion walking. But whereas walking is probably the most sustainable, it is not practical unless the distances to cover are manageable. And this is the catalyst behind walkable cities and communities.
Assigned Reading II
Assigned Reading II
Now that we have learned some about what energy means to the transportation, let us revisit some of the outlooks we studied before to see what they say about transportation. But first, we will visit the EPA website regarding greenhouse gas emissions and the transportation sector. Review the website:
EPA Greenhouse Gas Emissions [66]
Particularly note the graphic "Greenhouse Gas Emissions from Transportation,1990-2020." As you will note it is relatively flat, indicating only minor changes in the long-run with a slight upward trend until the pandemic hit. Of note also is the footnote that states the GHG emissions related to electricity used in transportation is negligible (less than 1%). We have heard so much about the shift to more electric vehicles, you can imagine the usage percentage will climb above 1%, and unless it is using renewably generated energy, the GHG emissions will start to climb at a higher rate as well.
You can test this hypothesis by visiting the EIA Outlook that we studied before and going to the summary PDF for the transportation sector.
PDF on Transportation Emissions [67]
This section of the outlook focuses on the transportation sector and illustrates trends in fuel type and related GHG emission trends.
Questions to guide your reading (for both the EPA and EIA references):
- What are the primary drivers of the trends in fuel use?
- How do GHG emissions reflect trends in changing fuel sources?
- Why do you think gasoline will remain the dominant transportation fuel source through 2050?
- How would you predict the GHG emissions trend in the EPA link (1990-2020) will change going forward? Hint: compare with the EIA data.
Lesson 6 Infographic
Infographic Assignment:
In this lesson we learned about the role of energy in transportation. Now, you’re going to engage in an activity to demonstrate your understanding of the role you, personally, play in the consumption of energy through the creation of an infographic.
Purpose of this infographic:
To successfully complete this assignment, you will create an infographic that illustrates your carbon footprint.
Lesson 6 Assignment
One interesting exercise is to see how you fit in the national averages for carbon footprint resulting from transportation. For this lesson’s assignment, you will calculate your GHG footprint related to your transportation habits using the following equations. Transportation accounts for about 28% of global GHG emissions, and that average applies to personal GHG emissions as well. In other words, the average per capita emissions is about 17 tons of carbon, of which 6-9 tons of carbon come from our personal automobiles.
But first, let us look at an example prepared by the previous instructor, Ed Pinero, by viewing this video (4:20):
Good morning everyone! Hope you enjoyed learning from the lesson this week. For this week’s assignment, for this lesson, you will be figuring out your transportation footprint and then comparing that to the national average. We will also ask you to consider, what kind of lifestyle changes you can make, within practical limits of course, to adjust your footprint if it is much higher than average. To help you along with this exercise, we will walk through an example of basically my own situation. We will use flyers to talk through it but your assignment is to present this as an infographic with a layout of your choice.
Let’s get started. First we need to note what the reference numbers are. For this assignment we will use EPA’s values as noted in this first slide. So, we have an average annual per capita emissions of 17 tons of carbon per year. Six to nine tons of that comes from our own personal automobiles. And this is approximately an average of a little less than five tons per vehicle with an average of two vehicles in a family. We will use 19 pounds of CO2 per gallon of gasoline or 22.2 pounds per gallon of diesel depending on your vehicles, from the EPA.
Calculating our transportation carbon footprint.
- Average annual per capita carbon emissions is 17 tons of carbon/year.
- 6 to 9 tons of that comes from personal automobiles (average 4.6 tons per vehicle/yr average of two vehicles).
- We will use 19 pounds of CO2 per gallon of gasoline and/or 22.2 pounds of CO2 per gallon diesel, depending on your vehicle(s) [from US EPA]
So the first thing you need to do is get your personal data. Using my example, there are three vehicles in our family and they all run on gasoline. Our first vehicle averages about 20 miles a week, second vehicle goes around 100 miles a week, and the third vehicle averages about 20 miles a week. So you can see that our total mileage in a given week is about 140 and when you multiply that by 52 weeks, you get 7,280 miles per year. Now clearly this is an approximation, but we’re just trying to get a sense of magnitude of what our footprint actually is.
Getting your personal data - Ed Pinero Example
- 3 vehicles in the family, all run on gasoline
- Vehicle One: averages 20 miles/week
- Vehicle Two: averages 100 miles/week
- Vehicle Three: averages 20 miles per week
- Total miles per year = 20 + 20 + 100 x 52 = 7,280 mi/yr
If you’re not sure, or if you have a vehicle that uses something other than gasoline or diesel, you can look up online what the carbon footprint is of that type of car. Realize that all types of cars, even electric ones, have a carbon footprint. For example, hybrids do use gasoline, although it is more efficient than a normal combustion engine. For electric cars, electricity needed to charge the battery has a carbon footprint of its own. Even alternate fuel vehicles, such as liquid natural gas, ethanol, or natural gas, have a carbon footprint. All of this information is readily available online, especially from the EPA and the Department of Energy.
Calculating CO2 Emissions
- Average mileage efficiency for all 3 SUVs = 30 mpg
- 7,280 miles at 30 mpg = 7,280/30 = 243 gallons
- 243 gallons of gasoline x 19lbs/gal = 4,807 lbs CO2
- 4,807 lbs/2000 lbs/ton = 2.4 tons/yr
So for my calculations, we see that my average fuel efficiency for all three vehicles is about 30 miles per gallon. So, using the 7,280 miles per year at 30 miles per gallon, we go through about 243 gallons of gasoline a year. This equates to 4,800 pounds of carbon per year based on our vehicles. And, if you convert that to tons, we’re about two and a half tons of carbon per year from our three vehicles.
Figuring why, comparing to national average, can you do better?
- 2.4 tons/yr is quite low compared to the average of 6 to 9 tons/yr
- Why? - we do most of our driving around locally, I work from a home office; COVID lockdowns have reduced our driving to at least half of typical, but even normally, we would still be within the 6 to 9 ton/year average
- We could do better if we had a hybrid or electric car(s), but the cost to benefit ratio might not be worth it
So, what does that actually mean? Well, two and a half tons per year is quite low compared to the average of six to ten or six to nine tons per year for the average family. So, why is that? Well, in my case we do most of our driving locally. I work from a home office and of course, these covid lockdowns we’ve had this year have really reduced our driving to at least half of what it typically does. But that, even normally then, we still would be within the six to nine ton per year average. You can always do better, and if we had a hybrid or electric vehicle it would reduce our footprint even further. But frankly the cost to benefit ration might not be worth it, considering how low our footprint already is.
So, hopefully this exercise has helped you understand what your carbon footprint is in terms of transportation and then start getting you thinking about what you may be able to do as a result of what your footprint is relative to the national average. Hope this little exercise was helpful in helping you do the assignment. Good luck!
The equations we will use for this exercise are as follows:
- CO2 emissions from a gallon of gasoline = 2,421 grams x 0.99 x (44/12) = 8,788 grams = 8.8 kg/gallon = 19.4 pounds/gallon
- CO2 emissions from a gallon of diesel = 2,778 grams x 0.99 x (44/12) = 10,084 grams = 10.1 kg/gallon = 22.2 pounds/gallon
Based on your driving habits, and your vehicle's city/highway fuel efficiency rating, calculate your annual GHG emissions in pounds. Prepare an infographic that shows the math and the assumptions you used. In the infographic, also note things that you could do to reduce that footprint.
- The assumptions
- Examples of what they could do to reduce that footprint
Infographic Information Video
Creating Infographics
Step 1: Getting Started
The best way to start working on your infographic is to start by reviewing the assigned online readings. You may wish to scan the assignments in advance to know which lessons have an infographic. As you work your way through the lesson, pause to write down key points you feel are especially important. You may also find it beneficial to create a quick drawing or sketch to visually support your learning and retention of information. This process is called sketch-noting. Sketch-noting is essentially capturing content in a visual format. The drawings do not have to be elaborate. They can be simple and use basic shapes. By sketching key concepts from the course, it enables your brain to remember more effectively.
Step 2: Conducting Independent Research
Once you have completed the online chapter, you will need to conduct your own investigation on a topic relating to the information discussed within the online lesson. Use the online readings as a starting point. You may consider the following questions to help you begin your independent research. First, is there something you found interesting in your readings and want to learn more about? Is there a point in which you wish to gain further clarity? Are you interested in seeing how the statistics may have changed over your lifetime? For example, comparing the data today, to the year you were born. After you have found at least one suitable article, follow the same process of note taking or sketch noting that you implemented when you reviewed the online readings. You may review as many articles as you wish to further your understanding of the topic, but you are required to submit an infographic that includes reference to a minimum of one external source. Note that some of the infographic assignments define the topic and this may help focus your research and modify the proposed steps.
Step 3: Synthesizing Key Points
In reviewing your notes or sketches, find the points you feel are most important and want to insure you remember beyond the semester. The infographic should be more than simply recapping the online readings. These points will likely be the most interesting, or thought provoking aspects of the various articles and readings you reviewed. Distill those points down to approximately ten, plus or minus a few is perfectly acceptable. This will help you narrow your focus on the points you want to convey in your infographic. Following this strategy will also give you the ability to quickly identify the connections between the course readings and other sources of information. Your submissions must include a connection between the course content and another source.
Step 4: Create the Infographic
Now we’re going to create the infographic as Step 4. When you’re ready to create your infographic, open Adobe Spark, Canva, or another program of your choice. It is recommended that you use one of the available templates in the software. This will save you a significant amount of time in creating the infographic. It will also ensure the readability and view-ability of your infographic. You are welcome to create something original, however this is recommended only for individuals who have advanced knowledge of color theory and graphic design. Mixing certain color types, such as red and green, or red and black, make text unreadable. Select the template you think your content will transfer to ,easily. Replacing text in the template with your own and change out the graphics for ones that tie more strongly to your content. When adding quotes, graphics or other data to your infographic, be sure to clearly identify the source from where it came. Simply adding a list of citations at the end of the page is not an appropriate way to cite a source and will result in a loss of points. You should also acknowledge the program where the template came from as part of the citations.
Once your infographic is complete, you can download a copy and submit it to canvas. Then you’re done! Infographics are an innovative and effective way to convey ideas that will help your intended audience grasp the content. These take practice but will help you with your communication of ideas in the future.
7: Energy in the Industrial Sector
Overview
Overview
In this lesson, we will continue the discussion about energy but will turn to the manufacturing (or “industrial”) sector. The U.S manufacturing sector uses a significant amount of energy, emits a large portion of greenhouse gases (GHG) and is a major economic contributor in terms of jobs and GDP. Globally, growing populations and rising middle classes throughout the developing world, will mean new consumers demanding all the products we take for granted in the U.S. That means more natural resources to fuel factories and energy sources to power them. In light of that fact, it is important to understand where the manufacturing sector stands in terms of its own transition from energy efficiency to onsite renewables. How manufacturers consume energy and how policy-makers incentive energy efficiency and use of renewables is of critical importance globally as we seek to build a more sustainable energy future and economic system.
Learning Outcomes
Upon completion of this lesson, you will be able to:
- Identify energy sources used in the industrial sector
- Understand general trends in energy efficiency and typical energy uses within the industrial sector
- Identify general best practices to improve manufacturing sustainability
Lesson Roadmap
| Read | Lesson 7 content and all assigned readings |
|---|---|
| Participate | Graded Discussion |
| Complete | Essay |
Questions?
If you have questions, please feel free to post them to the Questions about EGEE 401 Discussion forum in Canvas. While you are there, feel free to post your own responses if you, too, are able to help a classmate.
Manufacturing and the US Economy
Ever since the onset of the industrial revolution, manufacturing capacity and output in the US has been nurtured due to its critical importance both in terms of producing what US consumers demand, but also in terms of the key components and products needed to maintain national security. Underpinning that growth has been the relatively easy access to the vast natural resources reserves in the US including abundant fossil fuels to power manufacturing facilities.
While the overall percentage of the workforce employed in manufacturing has fallen considerably in the past fifty years, the industrial sector still accounts for approximately 11% of US GDP and hovers around 9% of the workforce (NAM: 2022 US Manufacturing Facts [68]). Despite this smaller economic footprint in the US, the industrial sector emits 23% of total US GHG emissions (EPA) and accounts for 33% of total U.S. energy consumption (EIA). Thus, when looking at the energy transition in the US, as with the transportation sector, improving manufacturing processes and materials use is imperative (EIA: Use of Energy Explained [69]).
Industrial processes use energy in a variety of ways including those similar to commercial and residential facilities: heating and cooling, lighting and office-related needs. But manufacturing also requires energy to turn motors and power industrial equipment, generate steam for process heating and even use fossil fuel derivatives for feedstocks (e.g., chemicals, plastics). Natural gas and petroleum account for the majority of energy use with renewables seeing a slight increase in the past 20 years. One area where manufacturing has made significant gains is in energy efficiency. In fact, data from the most recent Manufacturing Energy Consumption Survey from the US EIA (2018) revealed that “from 1998 to 2018, manufacturing energy intensity decreased by 26%. During this same period, manufacturing gross output increased by 12%, indicating continued energy efficiency gains.”
Not surprisingly, accompanying the efficiency gains have been a general trend of declining GHG emissions from US manufacturers in terms of both direct emissions (produced at the facility) and indirect emissions (produced offsite but associated with the facility’s use of electricity). The EPA reports that “total U.S. greenhouse gas emissions from industry, including electricity, have declined by 14% since 1990.” Even with all the positive momentum in this sector toward greater energy efficiency and a lower carbon footprint, there is still ample opportunity for improvement due to the variety of ways the industrial sector consumes energy and the vast amount of resources required as feedstock and inputs to production.
Required Reading
This Project Drawdown site provides a "Sector Summary of Industry [70]."
This EPA site documents "Sources of Greenhouse Gas Emissions [71]."
After reviewing the EPA overview of GHG emissions in the US industrial sectors, turn back again to Project Drawdown to explore energy use in the industrial sector. Scan the "Solutions in this Sector" examples at the bottom of the page and compare with the four general reduction opportunities the EPA identifies. How might the solution categories in Project Drawdown help address any of the four opportunities identified by EPA? What other reduction opportunities could EPA have identified? What about additional solutions Project Drawdown could highlight? No doubt there are many ways to reduce energy use in the extremely complex system that constitutes the US industrial sector. Considering the improvements that have already occurred and the many opportunities that remain, US manufacturing is positioned to play a complementary role to overarching energy and climate goals.
Energy Transition in the Industrial Sector
Due to the overall importance of manufacturing to the US economy, the federal government devotes a significant amount of resources toward ensuring the strength of the sector but also toward continued improvement of its energy efficiency and use of clean energy (through incentives, tax credits, grants, etc.). Importantly though, manufactured components are needed to build wind turbines, solar panels, battery storage devices, variable speed motors and other finished products that collectively contribute to the energy transition. Using lighter materials and recycled materials in the manufacturing process also means final products that are themselves potentially more energy efficient and sustainable from a resource standpoint. Thus, as the US and other countries incentivize the development of the products and technologies that result in more renewables and more energy efficient products, the efficiency and sustainability of the manufacturing process itself can convey multiple co-benefits to society.
Required Reading
This US Department of Energy document shares “Energy-Saving Opportunities for Manufacturing Enterprises [72].”
Reading Guiding Questions:
- Compare and contrast energy efficiency approaches of industrial facilities to commercial and residential facilities. Are the same or different approaches used?
- Considering the size and scale of the impact as well as potential benefit to the facility, industrial energy efficiency programs seem like laudable public policy goals. Are they or should the focus be more on residential, or commercial?
- How can we ensure even small and medium sized manufacturers have access to these programs and funding?
Required Video
What might the future state of manufacturing look like with continued improvements in energy use? In the video below, the US Department of Energy outlines some of the benefits to the economy and the energy transition of clean manufacturing techniques. Importantly, this video drives home the point that cleaner manufacturing processes improve energy efficiency and sustainability, but also new materials and methods used in the process itself result in manufactured components that improve the overall sustainability of many types of final products. Lastly, increased efficiency, productivity and sustainability of the industrial sector can significantly enhance the overall competitiveness of US manufacturing.
Video- Energy 101: Clean Energy Manufacturing (4:23)
Intro
Most of us have a basic understanding of manufacturing. It's how we convert raw materials, components, and parts into finished goods that meet our essential needs and make our lives easier. But what about clean energy manufacturing? Think of it as taking manufacturing to the next level.
Clean Energy Manufacturing
Some clean energy manufacturers use innovative technologies to improve manufacturing products or processes by reducing energy use in waste. Others use cutting-edge advanced manufacturing techniques like 3D printing to save time and energy or to build other clean energy technologies like wind turbines and solar panels. Clean energy and advanced manufacturing have the potential to boost the US manufacturing industry and open pathways to increased American competitiveness.
Advanced Composites
So, what does clean energy manufacturing look like? Well, one example is advanced fiber reinforced polymer composites. These innovative materials combine strong fibers with tough plastics so that the end product is stronger but lighter than steel. American manufacturers already use advanced composites and products such as aircraft and satellites, but as manufacturing processes for making advanced composites become faster and more efficient. Lower costs will unleash these materials and other industries - including clean energy industries. For example, advanced composites could help manufacturers make lightweight vehicles with record-breaking fuel economy. Lighter and longer wind turbine blades and strong high-pressure tanks for natural gas fueled cars.
Advanced Battery Technology
Let's look at their potential benefits for vehicles. Advanced composites could reduce the weight of a vehicle's body and chassis by as much as 50 percent and improve fuel efficiency by about 25 percent without compromising performance or safety. This could help save thousands in fuel costs over the lifetime of an average vehicle. Another example of clean energy manufacturing is advanced battery technology for plug-in electric vehicles. Most plug-in electric vehicles today use lithium-ion batteries, which already offer an excellent power-to-weight ratio, high-energy efficiency, and long life. But through advanced manufacturing, new advancements in lithium-ion battery production has led to significant cost reductions. This makes for cheaper batteries and more plug-in electric vehicles on the streets.
Advanced Manufacturing
Advanced manufacturing means more than just making high-tech products. It also includes using new leading-edge machines and processes to streamline productivity, saving time, energy and money. One example is 3D printing or additive manufacturing. With this breakthrough process, product development no longer begins on a draftsman table, instead additive manufacturing creates 3D objects directly from a computer model reducing wasted materials and saving energy. So how does it work? 3D printing produces an object from scratch by adding material and successive layers, similar to how an inkjet printer deposits tiny dots of ink to make a 2D image. 3D printers can create nearly any object imaginable by depositing materials right where they are needed. This fast-developing new technique will likely make a huge impact in manufacturing as it gives industry new design flexibility, reduces energy use, and shortens time to market. A variety of industries are exploring 3D printing, including clean energy, automotive, electronics, aviation, pharmaceuticals, and food. So, as you can see, clean energy manufacturing is changing the way we do business. From the kinds of products we build to the ways we build them, and it's making America more competitive. Clean energy manufacturing, recharging and revolutionizing American manufacturing.
Lesson 7 Assignment
Overview:
In this lesson, we explored energy use in the industrial sector and the general trends overtime in its improved energy efficiency and lower GHG emissions. However, there is still ample opportunity for improvements in multiple types of manufacturing processes across all industrial sectors. Considering how dependent the US economy is on spending on consumer products, improving the sustainability of high demand/widely used goods can result in big wins for energy and the environment. There are also many incentives at the federal and state levels for improved industrial energy efficiency. Improving the energy use profile of manufacturing while also utilizing new materials in the manufacturing process itself, can yield multiple co-benefits for society at large. To pull these concepts together, we’re going to engage in a creative activity.
Purpose of this Essay activity:
To successfully complete this assignment, you will write an essay which reflects the ideas and concepts presented in this lesson, specifically answering the questions provided below.
Successfully completing this assignment:
You will need to pick one manufactured item from your home (piece of furniture, an electronic device, bathroom fixture, etc.) and research the typical manufacturing process for that item and how facilities that produce that item (or its component parts) typically use energy.
In your submission of 325 (plus or minus 10%) word or less, please answer the following questions:
- Describe in general the typical method for manufacturing or assembling the product you chose
- How is energy generally used in the facilities that manufacturer and/or assemble the product you chose?
- How might you improve the energy efficiency of those facilities?
- Are there ways to swap out key material inputs for new materials that would improve the sustainability of the product and its end use?
- How might you incentivize these energy and material improvements?
Hint: the US Department of Energy, EPA and EnergyStar all have good resources to understand basic manufacturing processes, related energy use as well as incentives and best practices.
8: Energy Approaches- Global
Overview
Overview
In this lesson we will look at some examples at how other regions deal with energy issues. For example, we will touch on Europe, Asia, and North America. We will learn that there are different drivers that lead a country to do what it does in regard to energy, and we will see how markets and politics play into these decisions. We will also explore the role of renewables in national energy development. Finally, we will explore a market-driven approach separate from policy or regulation.
Learning Outcomes
Upon completion of this lesson, you will be able to
- Evaluate the factors that influenced regions to make the decisions they did regarding energy, using natural gas as a case study
- Identify the impact of renewable energy policies in global regions using case studies
- Identify whether accessibility, reliability, security, or sustainability are the priority in national policy of other regions by comparing the definitions of these factors with specifics of the policies
Lesson Roadmap
| Read | Lesson 8 content and all assigned readings |
|---|---|
| Discuss | Dr Grigas' presentation |
| Create | Infographic |
Questions?
If you have questions, please feel free to post them to the Questions about EGEE 401 Discussion forum in Canvas. While you are there, feel free to post your own responses if you, too, are able to help a classmate.
Introduction to Energy Geopolitics
Introduction to Energy Geopolitics
The entire global society needs energy, and therefore each nation and region need to make decisions regarding how it provides energy to its people and economy. But not everyone is starting from the same point, and not all countries have the same priorities. In other words, even though at the end of the day we are talking about providing fuels and electrification, the pathway to get there and what drives decisions will vary. For example, we will learn that for the United States, the primary element is energy security and independence, whereas for others, it is simply providing accessibility to more of their population. And for yet others, it may be more about political positioning and leverage.
There are several aspects to consider when thinking about providing energy. We need to recognize that providing energy means not only electrification but also fuels to generate the electricity, as well as fuels for transportation and industry. Natural gas becomes an important variable in that it is relatively plentiful, cheap, and on the lower end of fossil fuel carbon footprint. And of course, renewables are playing a bigger and bigger role in national energy markets. But in more developing markets, coal and oil will continue to play a big role. While there is action in some areas to reduce or eliminate coal use, in other areas, like India and China, it is even growing in use. Before we get into details of regions, it is important to also recognize that there are two ways to transport natural gas: via pipelines from gas fields, or delivered via tanker as liquefied natural gas (LNG). You will see that this dual option plays a major role in the geopolitics of energy.
Why is the natural gas story so important? Natural gas is a fossil fuel that is relatively clean (especially compared to coal or oil) and can be used to fuel power plants to generate electricity as well as to create heat to generate steam. Natural gas is also growing in use as a transportation fuel. It is a pivotal fuel source and plays a key role in nearly all global settings. It is likely that the transition from fossil fuels to renewables as a way to reduce carbon emissions will need to go through a natural gas phase. In other words, it is not practical to go from a coal and oil economy to an all-renewable economy without natural gas as a transition fuel.
Required Video:
Watch the video of a session held at an energy conference in Copenhagen, Denmark where Dr. Agnia Grigas, a Senior Fellow at the Atlantic Council and world expert on the geopolitics of energy, spoke about natural gas and drivers in different regions. This short video (approx. 30 minutes) is an excellent high-level overview of different regions and how they see natural gas in their energy decisions.
So ladies and gentleman, let's get started. Our first keynote speaker is Dr. Agnia Grigas. She is a senior research fellow at the Atlantic Council, Washington, DC. She's an energy and political risk expert within the field of energy and foreign policies in the U.S. and Eurasia. She just recently published a critically acclaimed book called, “The New Geopolitics of Natural Gas,” and that is exactly the topic of today's presentation. Ladies and gentlemen, please welcome, Dr. Agnia Grigas.
Good morning. First, it's a real pleasure for me to be here in Copenhagen and in Denmark this morning. Actually, it's my second time in Copenhagen this year so I'm starting to feel like a real local, and even more so, given that I took a brisk 30-minute walk to get here this morning. So I feel really local. It's also very exciting for me to be in Denmark today because Denmark has been an important country in natural gas development historically. And it's also center stage today in important decisions regarding European gas markets.
So my talk today is on natural gas, as you've heard. Why natural gas? Certainly there are exciting developments in renewable energy, and here, Denmark is a leader. And there are also I mean, the oil markets have also always been important. In my view, we are currently in a historical transition in the gas markets. Something that could be comparable to what was experienced more than a hundred years ago in the oil markets when they first went global. So my talk today, my talk today will take a global perspective on the gas markets. Particularly from also a geopolitical perspective and of course I will also bring in some views from Washington. So, let's get started. I will be, my remarks will be based largely on my newest book, which was released by Harvard University Press just at the end of last year. And the book’s starting point, is really a focus on the transitions in the gas market. And based on those transitions and then I make arguments what I anticipate will be the changes in the political relations, and geopolitical relations, between the key importing and exporting states. So what are these market changes that I'm talking about? And I'm sure the audience in this room knows these market changes very well.
But the ones I focus on in the book that I think are key is really the growth in LNG trade that we have been experiencing over the last 10 years, really probably since the Fukushima disaster, that really made the LNG markets global. And then of course the shale revolution, the North American shale revolution that has unlocked particularly for United States, its unconventional oil and gas reserves. And that has established the United States, now, as a major, major energy producer. Another factor is really the greater interconnections, the build-up of gas interconnecting infrastructure, across the world and also particularly in Europe - pipelines, LNG import terminals, connectors, reverse flows, and so on. And then finally, but certainly not least, we have climate change concerns which have been growing the appetite for natural gas both in Europe, both in the developed economies, and particularly in developing Asia, in the developing Asian economies.
So all of these changes together point, in my view, to a globalizing gas market. And, in fact, I think we can even call it a global gas market today. Although here I'll say the academics still debate this point quite vigorously. But I think maybe we're, here we can be a little bit more free and we won't get too upset about it if we call it a global gas market. And I think we're also seeing these changes are pointing increasingly to a buyer’s market, as well. So, you know, coming to, well, the big elephant in the room. Or, what are we willing to call it? The new energy superpower, as they call it in my work, it's the United States. The shale revolution really has established the United States as an energy superpower. It has created, made the United States the largest natural gas producer in the world, surpassing Russia. And that is a very significant development. And we also see the United States emerging as a leader in oil production. So again, very significant developments for a country that not only has a vast demand for energy resources, and one that until recently, anticipated to be importing a lot of its energy needs. So now, not only the United States anticipates to be self-sufficient, but it's also poised to be an LNG, a leading LNG exporter. It started exporting liquefied natural gas in 2016, with these American cargos going all over the world. And in a few years time, the United States is expected to take third, and then subsequently second place as the largest LNG exporter in the world. Again, dramatic, dramatic changes in the United States. And of course we see the leadership of the United States that is also very intent on using this energy diplomacy potential. And, whether we like the rhetoric or not, so, just to give you a little glimpse here, currently the United States has three operational LNG export terminals.
But, I'm just giving you a snapshot of one region in Louisiana. Just one region, which currently has about ten, you know, ten projects in the works and of course various stages of development, but ten projects for LNG export terminals. So again, very significant, you know having gone from, well, since the 1960's there was essentially just one LNG export terminal. Then in 2016, we had a second one open, this year, a third one, but ten in the works just in Louisiana. And a lot of the focus now today in the media is about American LNG exports, their actual volumes. Where they're going to go? Are they going to go to Europe? Are they going to meet Europe’s demand? Are they going to go to Asia? But I would say maybe what's maybe even more significant today is not just the actual volumes or exports of American LNG, but actually the impact of American industry, American gas industry, on the global gas trade, particularly the way of doing business and the terms that American energy companies are prepared to offer. So, particularly a move away from oil-linked gas pricing. Move towards more hub-based pricing, and move away towards long-term contracts, towards more medium-term contracts, and even spot trading short-term contracts, and so on. And no destination clauses, of course. That's something that has been already, you know, a regulatory factor in the EU. But the U.S. is offering those conditions across the globe. And again, the growth of LNG versus piped gas. So, all of these conditions, and this way of, let's say, America’s, an American energy company’s, way of doing business, I would say, also support the idea of a buyer’s market currently.
So this brings us to the other energy superpower, Russia naturally, and also here I'll step in with my area of expertise is really global energy markets, and as well with a focus on Eurasian security issues. So I also work on Russian foreign policy, and I have published a couple of books on the subject. So from my perspective, and there are different ways we can interpret it, but you know has Russia been just simply a supplier of energy to Europe? Has it used it as a source of influence? As a source of political leverage? Even has it used energy as a political weapon? Of course, I know this is a hotly debated topic. I would actually say all of the above. Russia has certainly used all of these tactics. So some of the examples are, of course, as you see on the on the slides, gas halts, political gas pricing, price hikes, threats of gas price hikes, particularly towards countries that were highly dependent on Russian gas imports. Countries where gas generally had a monopoly or near monopoly. Also gas has been for Russia not only a source of revenue, but I would say even more significantly, it has been a source of political influence. And the basis for doing, you know, diplomacy, for establishing friendships, and sometimes a little bit more than friendships.
And so we see a few, a few examples of European political leaders that have had very close relations with Vladimir Putin, often times in relation to gas pipeline deals being made. So of course we see former Chancellor Gerard Schroeder and the infamous Nord Stream pipeline project. We see Berlusconi and Erdogan regarding the South Stream and Turk Stream projects in the past. And then we see more recent Victor Urban of Hungary also has a close friendship with Vladimir Putin. And also you know has said he would love to see more Russian gas in Europe. So given what I had outlined earlier with the US now being an energy superpower, the largest natural gas producer in the world, does that mean that Russia is a declining, you know, declining energy power? And here I would say a little bit, well let's you know, let's hold our horses. Russia still is the largest gas exporter in the world. It still holds that position. It certainly has vast resources. And though in terms of LNG markets its, its position, and it's been trying to ramp up that position, but it's coming from you know catch up phase. Let's say it's in a catch up phase. So currently it is about number seven in in terms of LNG exports. And you know World Rankings, now Vladimir Putin has said that personally, he said that he'll make Russian a number one LNG exporter. Now of course he didn't give a timeline for that. I may be a little bit skeptical to see that in the very immediate term. But certainly we will see Russian LNG becoming very competitive in Europe, I think, really within the next year. And of course there are plans for new pipeline projects.
So there are two important pipeline projects right now that Russia is pursuing. One is Nord Stream 2 and the second one is the Turk Stream project. I view both of these projects as an effort by Russia to hold on to the European energy markets. And if you look at these two pipelines and their trajectories, they also signal which markets are very important, of course, for Gazprom. So the Nord Stream 2 pipeline project goes directly to Germany, and Germany is in fact, Gazrom’s largest European gas importing market. So naturally they want to pursue and maintain this market. In a way, I would say even lock it in, given the changes that we’re experiencing in the global gas markets, the greater competition, the moves to LNG, and so on. This pipeline again, is it just, is it just an exporter of natural gas, or is it an exporter of more friendships, political alliances, and even potentially corruption? I just came yesterday from Hamburg and Rostock. Rostock is the area where the Nord Stream 2 pipeline would be expected to land. And Germany is also watching Denmark's decisions very carefully regarding this pipeline. There though, of course, they have the impression somehow that it's a done deal and Denmark would do nothing about this pipeline. Certainly that is not the case. I'm sure the folks in this room know that very well. There's still a lot of decisions to be reached, and there are there a lot of problems with this pipeline and its implementation. Not least of course, is America's position. And maybe we'll get a little bit more into that into the discussion, but I can say now that the United States is quite serious about potentially sanctioning this pipeline. And thus, the companies that are involved in this pipeline as well. Currently, there are five bills that have been passed between the Senate and Congress that all directly would implicate Nord Stream 2 into a set of type of sanctions. You know, sanctions regime. So if even one of these goes into law, you know, so you see there's quite a bit of appetite and quite a bit of bipartisan support in the United States for sanctions on this pipeline project.
So the second one I touched on briefly, as well this is the Turk Stream pipeline. And Turkey is for gas the second largest European gas market. And again an effort to build the, and of course that growing, a growing market for gas with a lot of demand. So there is also an interest to maintain this market as competition, is heating up. And also Turkey then serves as a gateway to southeastern Europe. And these gas markets for Gazprom this is where Gazprom still maintains a monopoly position in many countries. So in terms of energy, energy diversification in Europe over the last few years, given these changes in the markets in terms of more liquidity, more competition, more LNG, we've seen some countries really grasp these opportunities. And I think some of the success cases are Poland and Lithuania. For example, that went from being 100% dependent on Russian gas, and countries that had experienced numerous interruptions to their gas supplies. In fact, Poland during the winter of 2008-2009, when Gazprom cut supplies to Ukraine. And because they’re further, you know, downstream the pipeline. In that cold winter, they in fact even had citizens freezing to death because it was so cold. They had about eleven casualties so you can imagine this is a highly sensitive political issue. If you have your, you know, citizens experiencing casualties actually because of a gas halt.
So Poland and Lithuania are countries that have built their own LNG import terminals. Lithuania, a floating terminal, a small-scale terminal to meet its, you know rather small demand. And Poland, as well, these are new developments. But the countries have already been importing Norwegian LNG, and last summer the first cargoes of American LNG. So also that was maybe a not so significant perhaps from a market perspective, these were one-off delivery’s. Although subsequently Poland has signed a new gas deal for 20 years with an American supplier. But from a political, from a symbolic perspective this was very important for these countries.
Croatia is another case there are plans for Croatia to build an LNG import terminal. We'll see how that goes through because Croatia was earmarked a hundred million from the European Union of funds to build this terminal. But literally as those funds were earmarked, Gazprom signed a 10 or 20 year deal with the local gas company to essentially meet all of Croatia's gas demand for the next 10 or 20 years. Essentially eliminating, you can see, the appetite for this LNG terminal. Nonetheless, the terminal has significance beyond Croatia’s local market because it would be a gateway from other southeastern European countries further down the line that don't have access to the coastline, the lovely coastline, that Croatia has. So we'll see. This is an important project. We'll see how it goes, how it goes ahead.
Here I'd like to discuss a little because our focus was quite a bit on Europe, but on developing Asia, particularly China. There were a lot of discussions post 2014, you know really when there was a deterioration of relations between Russia, and well, Europe and the United States following the annexation of Crimea. And then with much, I would say, pomp, Russia made this type of a turn towards the east. A pivot towards the east, and a pivot towards eastern markets. At the time many discuss whether this even signals a political alignment, or, you know, when you will kind of access them. At the end of the day I don't put that much stock in it, though the power of Siberia pipeline will open at the end of 2019, or you know, roughly in that time period. And will start delivering Russian piped gas to China. We can see from those negotiations that really even those discussions that started, you know, almost a decade ago, that at the end it was Beijing that dictated a lot of those terms rather than Moscow.
And China has a very well diversified and very, I would say, thought-out energy strategy particularly based on room with a focus on their energy security. I think they've learned some of the lessons from Europe, from not to get over dependent on any particular supplier. And in fact, I, in my book, I argue that they use their kind of power of demand quite well. So, in fact, your vast demand puts them in a strong negotiation position. So of course they'll have deliveries, piped deliveries, from Central Asia and Myanmar, Russia, they will also import LNG from all over the world. They are also pursuing very aggressively their own domestic gas development program both conventional and unconventional. In fact they are one of the only four countries in the world today that have a commercial shale fracking program. So I mean that's the United States, Canada, Argentina, and China. And they have expended vast amounts of money to pursue this shale program. And I would say, while many have been skeptical, because maybe their results didn't quite match, you know, the efforts and the investments. Still, it's only a matter of time given that it's such a political project for Beijing, and such a necessity that they will break through. And they will be producing significant, significant volumes from both their conventional and unconventional gas development programs.
India, another country in developing Asia where really we can see the future of gas demand. Both China and India will probably be setting that, setting the future of global gas demand, quite differently I would say than China. India, hasn't had such a maybe carefully thought-out and pursued a gas import strategy. Or get, you know, a gas program. For a long time they didn't have a lot of the infrastructure both internally for gas transit and gas imports. They're trying to ramp that up. But you can also see that from from a different position really, India had than China, in terms of their negotiations, I would say a weaker position up until this date. Though, there are now new efforts to renegotiate in Indian and their Galle company their gas terms and gas import supplies, of course also a large importer of LNG in the years to come.
So, this new geopolitics of gas and where I will say I will put here, the United States, in the center-front as this new emergent power, and of course with president Trump's proclaimed policy of energy dominance, and of course LNG diplomacy. This position, I think, sometimes raises some eyebrows and maybe some smiles in Europe. And I see that in the audience even as I say these words but here you have to realize that in fact but and also you can say today there's a lot of discussion, well is America only pursuing, potentially pursuing sanctions against Nord Stream 2 because they have their own LNG to sell? You know is it only a new commercial interest? And here I would point that if you look go back to the 60’s, really as far back as the 60’s, America’s and Washington's position on this topic has been unchanged, very consistent, and in fact, values driven. So since the 1960's the United States has been very cautious about its European allies becoming over dependent on, well at the time Soviet, and subsequently Russian, gas. Naturally, as NATO's largest power, and let's face it as a security guarantor for a lot of the European states, the United States is directly implicated in the energy security considerations or risks of its allies.
So again since the 1960's they've tried to dissuade their European partners from pursuing and importing Russian gas. In the early 80’s, President Reagan sanctioned a pipeline that was being built at the time. The sanctions didn't go far. There was an economic downturn, and also they didn’t, United States didn’t, have much to offer as an alternative. Again looking since after the Cold War the United States has supported projects like Nabucco the southern gas corridor. So it would bring alternative Caspian gas to the Europe, the European Union again not American gas. It has also tried to dissuade Germany from building Nord Stream I, but I think what has changed today really is the fact that the United States said it has gas exports and it now is no longer worried about its own supply. It has a surplus and it can export that to its allies not only in Europe, but also in Asia. Many of which also tend to be energy import dependent. And even if we look at Asia, Japan, historically Korea, you know, very energy and particularly gas import dependent countries.
So here again I was, as you raise your smiles and eyebrow, add this new energy dominance and diplomacy. Do consider that this has been a very long-standing American position. So given these changes in the energy markets, given as I said, now importing countries have more options. They have, there's more liquidity in the market. There are new players with you can say fairer, perhaps, terms like the United States. And potentially a buyer’s market so should we still be concerned about energy security or energy risks? And here I just put out some thoughts from a recent study I did from the hybrid COE Center which is a new center focusing on hybrid warfare threat risks that was recently opened in Finland by NATO and EU member countries. So, in fact, risks remain. And in these globalizing markets there's more infrastructure that we have to worry about, and more new infrastructure and their security. In the cyber and digital age. of course, they're more risks from state and non-state groups in terms of hackings or cyber attacks on our energy sector and our infrastructure.
And there's also the role of propaganda and information warfare that many of us maybe don't think about when we think about the energy sector. But we see it increasingly over over the last, you know I would say, decade. There was one instance there was quite an interesting case in the United States in the Columbus chemical plant where there was a media type of operation, a false operation, seemingly connected to, you know, to Russia, that argued that there had been an explosion in this chemical plant in the United States. And there were these types of messages and social media and so on, causing a public panic essentially in the region. So again, maybe we don't think of propaganda as something is that important energy sector, but increasingly with social media and our digital information age it can become, at least a you know, at least at risk, least a source of concern for the public.
Questions of corruption, a case that Denmark I think, has recently been more focused on in terms of the Danske Bank case. Cases for using energy for different interest groups for foreign influence. So again we're not, even though we're in an era of globalization, greater liquidity, more supply, and better terms, we're really not in an era of post energy security.
So I will leave it at that and I think we'll have a few questions and I hope to get some questions from the audience. You can always reach out to me or follow me on Twitter, and I put up also some of my past work, my past books, on the slides. So you get a little bit of an idea of my area of work. Thank you. [Applause]
From watching the video, what do you think drives the energy policy in these regions? For example, what is different between the USA and other regions such as Russia and Eastern Europe. What about India and Asia?
Also make note of how changing conditions in one part of the world may alter how a country in a different part of the world critically and almost instantaneously change priorities. For example, how did the U.S. becoming energy independent and a net exporter of natural gas affect how Russia and China interact with their region? In light of the very recent Biden Administration decisions, we are no longer energy independent. How do you think this changes what you have seen so far?
In light of the Russia-Ukraine War and sabotage to the Nord Stream pipeline, listen to an update from Dr. Grigas.
How has Russia’s invasion of Ukraine affected Europe’s energy mix? How are European states balancing the move towards a green future with their present needs? How are the Baltic states positioning themselves in these European debates? Dr. Agnia Grigas, Senior Fellow at the Atlantic Council, gives us the historical context and future factors that will affect European energy security for decades to come.
Source: The Future of European Energy: An interview with Dr. Agnia Grigas [73]
Renewables in National Policy
Renewables in National Policy
As we heard from the interview with Bob Barkanic in Lesson 1, developing areas of the world without established energy infrastructure actually have an advantage when it comes to uptake of renewable energy. This is because they can essentially “leapfrog” to renewable energy and not have to first build, then adapt and retrofit, traditional fossil fuel powered national electric grids. We also learned in prior lessons that renewable energy systems can be more diversified and distributed, thereby making deployment easier. Of course, we will not be able to do an exhaustive analysis of renewable energy policy of all countries. But it is useful to explore a few examples from different regions.
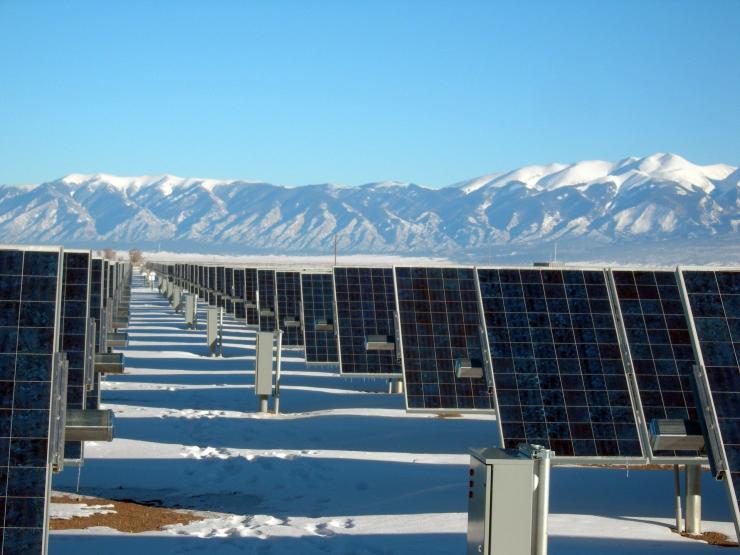
We will learn about the USA and renewable energy policy in a later lesson, but we see on a global scale that although renewables bring much benefit, there are challenges on a national and regional scale. For example, in places like Africa and Latin America, while the overall lack of a reliable energy grid and infrastructure brings opportunity to start with renewable sources, there is also the diffuculty of regional-scale cooperation and coordination (necessary in order to benefit from economy of scale) across the continents' collections of independent nations. Without this cooperation and coordination, you will end up with a series of country specific, and disconnected systems.
To this end, IRENA (recall IRENA from our review of energy outlooks) has been working in several areas supporting development of strategy and capacity building to incentivize regional cooperation through a concept they call Clean Energy Corridors. These corridors will help connect efforts into broader networks that will work together more efficiently and add market stability.
Assigned Reading
Read the narrative on the home page of IRENA’s Clean Energy Corridors to gain a better understanding on these corridors. Then, go to the link for the report on Africa, “Scaling Up Renewable Energy Deployment in Africa.” Read pages 3 and 4 of this report, the section entitled “Energy Transformation in Africa”.
IRENA’s Clean Energy Corridors [75]
Scaling Up Renewable Energy Deployment in Africa (PDF available on next page)
Questions to guide your reading:
- How do you think creating such corridors will catalyze growth of renewable energy?
- Why are these prevalent in developing areas, rather than developed nations?
- In the Africa report, can you identify the relationship to energy accessibility, reliability, security, and sustainability?
Renewables will figure prominently in national energy policy of developed economies as well. These will be different than with Africa and Latin America in that developed countries tend to have fossil fuel-dominated grids already in place, and renewables will need to be integrated into this existing infrastructure. As an example, let us explore what is going on in our northern neighbor, Canada.
Renewable Energy Policy in Canada
Renewable Energy Policy in Canada
As you can imagine, Canada is quite different in terms of grid maturity and economic development than we saw with developing areas. How Canada address renewables and plans to integrate these sources into their energy grid is quite different than Africa.
Assigned Reading
You will find an excellent overview of the nation’s renewable profile on this Canadian government website [77].
Also listen to the podcast called Lessons for a Canadian Hydropower Company by the Columbia Energy Exchange. This is long (46 minutes) so you do not need to listen to it all, but listen to the first ten minutes and maybe skip ahead a few times to get the essence of the interview.
Lessons from a Canadian Hydropower Company [78]You might be surprised to see exactly how their renewable portfolio is balanced. Canada by far depends on hydroelectric power. This is an excellent example of a situation where a country wants to leverage renewables and utilizes their best resources to do so. Canada does use solar, wind, and others, but for them, moving water is the primary option. You might also find it interesting that up to 80% of Canada’s energy is generated by clean, low to zero emission sources. But this is in large part due to nuclear being part of the mix.
We also see with Canada something typical with developed nations with mature traditional fossil fuel powered electric grids. The most effective way they can grow renewables is by replacing part of this fossil fuel-dominant energy portfolio with renewables. Recall this differs from areas where there is no established grid where they can integrate renewables from the start. To make this “retroactive integration” feasible, there is a need to have a mix of regulation where it is required by law combined with incentives to create the technology and practices that will make the transformation feasible.
In Canada, the government requires there be a certain percentage of renewables in the energy mix of power production. This percentage may differ from province to province, but, in all cases, there must be a renewable energy component in the total electricity generated. Canada also has a transportation component where the federal Renewable Fuels Regulations require fuel producers and importers to have an average renewable content of at least 5% based on the volume of gasoline that they produce or import, and at least 2% of the volume of diesel fuel that they produce and import.
Market Forces at Work - ISO 50001
Market Forces at Work - ISO 50001
In parallel with the geopolitics of energy, there is the market sector, driven by supply and demand and competition. These forces are in play across national boundaries and although clearly sensitive to what governments and government policy do, the markets are more influenced by competitive positioning and market share. This market-driven, energy related action concept is evident when it comes to companies, and energy consuming industries in particular. These entities are looking for an advantage to leverage energy use. This may mean reducing energy use or becoming more efficient to save money, thereby increasing profitability. Or they may wish to actually sell this improved efficiency to gain more market share and/or be able to sell a product at a premium. An excellent example of this would be a company who switches to renewable energy sources. Such a switch can improve efficiency, reduce their carbon footprint, and improve their brand.
Companies strive to integrate concepts and strategies through effective management processes. Doing things ad hoc without logic, organization, and follow up poses risks and introduces inefficiencies. As a result, a company will look for management techniques, which they can combine with technology, to increase performance in a given area. This is quite true with energy use. In searching for such approaches, companies, especially multinationals, will look for global scale, recognized standards, and protocols. By creating an international standard, it provides an approach that could be replicated, and would be recognizable to others, thereby increasing understanding, transparency, and awareness. A common way to create such global processes is through international standards. And the International Organization for Standardization (ISO) is the premier organization for developing standards. ISO standards are market-driven, voluntary standards created by groups of experts and stakeholders. If you wish, you can learn more about ISO at their website [80].
The importance of these standards is that they help provide a pathway for organizations, typically companies and industry, to improve their performance in a variety of areas using voluntary, market-driven pathways in lieu of, or in conjunction with, policy and regulation driven by government. Over the years ISO has developed thousands of standards to help bring consistency across the globe. ISO standards cover a wide array of topics from management approaches to specific products. You depend on the consistency offered by ISO standards every day and may not even be aware of it. For example, it is because of standardization that a credit card magnetic strip is in the same place on the card and configured in such a way that card readers around world can recognize nearly any type of credit, debit, or charge card.
Specifically, ISO 50001 addresses energy management. ISO 50001- “Energy management systems – Requirements with guidance for use” was initially created in 2011 and updated in 2018. This is a management system standard, not a technology system. In other words, it provides a framework for organizations to manage their energy use in a way that brings efficiency and enhanced performance. Whether it is to improve energy efficiency, expand the use of renewables, or reduce energy use overall, some contend that allowing organizations to set their own goals, procedures, and approaches will lead to better performance than “one size fits all” policy or regulation. In reality, the answer is a mix of the two.
Required Reading
Previous instructor, Ed Pinero, prepared an overview PowerPoint regarding ISO 50001 when he was the Chair of the international committee that developed the standard. Review the slide deck entitled “Overview of ISO 50001 Energy Management System Standard.”
Questions to guide your reading:
- Why would an organization go through the effort of implementing a voluntary standard?
- What is it about the plan-do-check-act approach that makes an EnMS work?
- What kind of energy use benefits are likely to result from using ISO 50001?
Lesson 8 Infographic
Lesson 8 Assignment
In this lesson, we discussed Canada’s renewable energy strategies and resources. Now you are going to have an opportunity to explore the strategies, policies, and resources used by a country of your choosing. The goal is to create an infographic that summarizes this information in a visual format.
Purpose of this infographic:
To successfully complete this assignment, you will create an infographic that describes the renewable energy approach and policies for a chosen country.
Communicating Visually:
To begin creating your infographic, select a country that is of particular interest to you and review their policies for renewable energy. Then create an infographic which describes the renewable energy approach and policies for that country. As done above, note what renewable sources are emphasized, what policy approaches they use and so on. Identify whether accessibility, reliability, security, or sustainability are the priority in your country of choice, with specifics of the policies that informed your answer.
You’ll need to spend some time thinking about the various connections and how to demonstrate them in the most concise and effective manner possible. You’ll need to illustrate all this information in a manner that is easily understood ‘at a glance,’ meaning there shouldn’t be any additional resources or information one should need to read in order to understand what you are trying to communicate. In other words, try to visually show the connections between policy goals- do renewable energy requirements connect to climate change goals? Your infographic may include factoids and even selected screen shots to demonstrate a point; but make sure to input your own interpretation of how these individual facts can relate.
Successfully completing this assignment:
If you haven’t done so already, review the foundational information on creating infographics. You can view those resources through the links provided below. The rubric used for grading this assignment can be found on the Infographic Activity webpage as well as the Infographic Drop Box for Lesson 1 on Canvas.
Infographic Information Video
9: Energy Approaches- USA
Overview
Overview
The U.S. is a complicated place in terms of regulations, and it is no different when talking about energy markets and options. The energy-related industries are for the most part private sector entities that are covered by a wide assortment of regulations and requirements. The oil and gas sector that provides fuels for transportation, industry, power generation, and personal use is one of these sectors. We also have power generation public utilities which are entities that maintain infrastructure on behalf of the public. These can be government entities, or private companies which are heavily regulated and under some form of public control. For this lesson, we will focus on the power-generating utilities, including the transmission and distribution of the energy.
Learning Outcomes
Upon completion of this lesson, you will be able to:
- Describe the differences between regulated and deregulated energy markets
- Discuss how renewable energy policy and RPS compare and contrast within regulated/deregulated markets
- Discuss how to use information about your local market to make informed choices about your energy use
Lesson Roadmap
| Read | Lesson 9 content |
|---|---|
| Discuss | Relationship between deregulation and renewable energy |
| Write | 325 word (+/- 10%) essay |
Questions?
If you have questions, please feel free to post them to the Questions about EGEE 401 Discussion forum in Canvas. While you are there, feel free to post your own responses if you, too, are able to help a classmate.
Regulated vs Deregulated Markets
Regulated vs Deregulated Markets
To get a good understanding on how the energy markets work in the USA, it is first important to understand the differences between the types of markets. For example, we have fuel supplier markets, like oil and gas companies and coal producers, who are private sector companies that compete for customers to whom they sell their products. If you use propane or fuel oil to heat your house, or are looking for a gas station to refuel your car, you get to choose from a number of suppliers who are all competing for your business.

We also have electricity providers who generate power and manage the grid. Parts of this grid include power producers who use fuels to run turbines and generate electricity and who are also private sector companies. This power then gets put into the transmission and distribution system to get the electricity to users. It is an understatement to say that this system and the relationships between players is quite complex, and there have been major changes in how this works over time.
One of the fundamental concepts to begin to understand these complex relationships is that of regulated vs. deregulated markets. To an extent, the entire energy sector is regulated in one way or another. So before discussing regulated vs deregulated, we should first define the key segments of the energy sector. For now, we will focus on the power generating sector, and the aspect of getting electricity generated and distributed. For this lesson, we will not be looking at regulation of the fuel sources themselves such as oil, gas, coal, nuclear, and hydroelectric. Each of these fuel types has its own, unique, myriad regulations. Also, we are not going to get into the intricacies of the legal and business elements. The goal is to understand how these regulated and deregulated markets relate to energy security, accessibility, reliability, and sustainability.
Energy generation is what power plants do. Whether they are coal, oil, gas, nuclear, hydroelectric, or a combination of these sources- these plants generate electricity by consuming a fuel and putting that electricity into the transmission and distribution grid (the power lines and power poles that crisscross the country). With the advent of renewable energy, power is also generated at wind and solar farms, biomass-to-energy plants, waste-to-energy plants, and others. All of these power generating options wish to add their power into the national grid.
The Federal Energy Regulatory Commission (FERC) regulates the transmission of electricity across the national grid. This includes setting standards for reliability and security and putting some controls on pricing. Price control was intended to address the risk of unfair charges that would prove detrimental to the public at large. Referring to our four attributes, FERC is most concerned with accessibility, reliability, and security. Whereas FERC does not actively focus on energy sustainability, they do indirectly support it by allowing renewable energy to be put into the grid, as well as allowing provisions for demand response. As we discussed before, demand response is allowing the generation sector to work with consumers to optimize efficiency of energy use.
Interestingly, when one speaks about regulated and deregulated markets, they are usually not referring to many of the complexities described above. In reality, when their state is unregulated, they usually mean the concept of consumers being allowed to choose their own power producer. You can imagine that having thousands of independent grids with their own generation units, transmission lines, distribution points, and wires right to your home would create an unreliable, tenuous mess. Blackouts would be common and the ability to meet demand when and where needed would be almost more by luck than by planning.
Hence, the power sector had to be regulated to ensure consistency and reliability across the country. The ability for these systems to interconnect and work together was the only way to ensure reliable power. But we know that there are hundreds of power generation and transmission entities in the U.S. With the advent of renewable energy generation, there are thousands of additional sources of electricity trying to get connected to the grid. There was a need for government-driven oversight of the system.
Over time a situation evolved that proved to be unfair to consumers. Historically, the electric utility was a single entity that owned and controlled the system from the power plant to the end user. These utilities had their service areas, and they were the “only game in town.” As a user in that market you had no choice.
Even though there was a growing number of power producers, including a growing amount of renewable energy available, there was only one set of wires available in a given area. In order to allow consumers to shop more competitively for electricity but recognizing that it would need to come to their home or business through the transmission system available, several states opted to decouple energy production from transmission. This decoupling is what is commonly referred to as a “deregulated market”. In reality, only the power production is deregulated. The transmission and distribution are still regulated.
In a deregulated market, you can shop around for a good electricity price, or you may be willing to pay more than average to ensure your energy comes from a renewable source. By keeping the transmission and distribution regulated, regardless of from whom you buy your power, you are assured that it will be delivered to you without undue cost markups, at high levels of reliability. Those who move the energy to your home are required to cooperate with the generation players to ensure enough power is in the system and reliably delivered to you at a fair price.
In essence, the entire issue of deregulation was an attempt to break up power utility monopolies and allow for more choices and therefore better and more competitive prices, but still keep enough regulation to not compromise accessibility and reliability. We shall see below in the Kim et al assigned reading paper how the element of deregulation affects renewable energy choices. But it is important to note that integration or promotion of renewable energy was not a driver or reason for deregulation. Before we discuss what the relationship actually is between deregulation and renewable energy, we need to understand what we mean by renewable energy policy.
Renewable Energy Policy
Renewable Energy Policy
In addition to regulated vs deregulated aspects of states, there are also a wide variety of ways states encourage, or require, renewable energy as part of the state’s energy supply. The way RPS are implemented varies, and there are specific types of approaches. In other words, there are many ways to generate renewable energy, and then there are various policy options to getting this energy into the state’s energy mix. Generating solar energy for your home or a building is fine, but it does not help to build commercial scale solar, like a solar farm, if there is no way to get that power into the grid. And to get that power into the grid not only requires the right technology and spatial logistics, but it has to be allowed by the regulations. How that is allowed, and actually encouraged is through a state’s renewable energy policy.
Suggested Reading
There are a number of vehicles, or programs, that allow for renewables. A recommended resource to explore these programs is the Database of State Incentives for Renewables & Efficiency®. You can access this database directly at https://www.dsireusa.org/ [81] or via the EIA website [82].
One example is the Renewable Portfolio Standards program, or RPS, which require utilities to include a certain percentage of renewable energy in their power mix. How these are reflected across the states varies quite dramatically, and not all states have RPS. As of mid-2019, 29 states and the District of Columbia had some type of RPS, and another 8 states had voluntary goals or objectives. Pennsylvania is one of the 29.
The Current State of the Marketplace
The Current State of the Marketplace
The deregulation of the power sector and introduction of renewable energy policies has proven to be positive from all four attributes’ perspectives- accessibility (includes affordability), reliability, security, and sustainability. The end consumer, whether your home or place of work, now can choose where they buy their electricity, but are still assured reliable delivery. It is, in essence, the “best of both worlds”.

Currently, 29 of the 50 states have some degree of deregulation in their markets. Note that because natural gas is so integral to energy consumption in the home and in industry, it is also regulated with deregulated parts. In other words, in some states, you also have a choice in who sources your natural gas, even if it is not the same as the distribution. Unlike with electricity markets where you may decide to choose a supplier based on how they generate the electricity, with natural gas, it is more about price competition.
Let us use an example not too distant from the PSU campus in southeastern Pennsylvania near Lancaster. The electric utility is PPL. This is the only utility that services the area, so they own and are responsible for the transmission and distribution of electricity, whether residents buy it from them (PPL also generates power via a sister generation company), or from another producer of their choice. Pennsylvania has several utilities that cover various parts of the state so someone living in Pittsburgh does not use PPL infrastructure; they have their own utility. Until the state deregulated in 1996, that meant buting electricity from PPL. But today, residents in this part of the state have no less than 20 options for buying electricity. In Pennsylvania there were advantages and disadvantages of deregulation. One positive change was that the utilities were required to allocate part of their income towards energy efficiency and renewable energy awareness and programs. Another major advantage was the ability to shop around for good rates. But that also introduced some disadvantages. First of all, the price caps that were in place in the regulated market (to avoid a single monopoly provider from high prices) were eliminated and many saw big changes in their pricing. Another disadvantage was that now the consumer was faced with a large number of choices and complex payment plans. It was suddenly possible to accidentally put yourself in a situation where you actually paid more than you used to, even in the more competitive market.
Fortunately, in Pennsylvania, a new state authority, PA Power Switch, was established to provide a wealth of information and guidance to residents and businesses in navigating the deregulated market. Feel free to visit the Power Switch website [84].
Deregulation and Renewable Energy Policies
Deregulation and Renewable Energy Policies
Now that we understand more about deregulated markets and renewable energy policy, let us revisit the question of how they relate, if at all. For this, we will read parts of an interesting study done by Columbia University and published in 2016.
Required Reading
Access the following paper through the following link:
Read pages 22; top half of 29 (up to Research Design); pages 30-32; and, the conclusion section on page 47.
Questions to guide you reading:
What is the likely relationship between deregulation and renewable energy policy, i.e., the concept of issue linkage?
Lesson 9 Assignment
Lesson 9 Assignment
Overview:
In this lesson, we explored the concepts of regulated and deregulated energy markets and the factors that impact each. We also discussed renewable energy policies as it related to regulated and de-regulated markets. We also discussed the current state of the energy marketplace and how it pertains to your geographic location. To pull these concepts together, we’re going to engage in a creative activity.
Purpose of this Essay activity:
To successfully complete this assignment, you will write an essay which reflects the ideas and concepts presented in this lesson, specifically answering the questions provided below.
Successfully completing this assignment:
You will need to research your own options regarding the electricity market. You present the information in the form of an essay (325 words plus or minus 10%). Even though some of you live in Pennsylvania, not all replies will be the same because we learned that market choices are not the same statewide in many U.S. states.
In your submission, please answer the following questions:
- Is your state deregulated? If so, to what degree (electricity only? Natural gas?)
- [If not, focus your comments on if there are plans for deregulation. Also discuss what options you do have to choose a power producer.]
- Do your choices include renewable energy options? Do you think it would be different if you were deregulated/regulated (as compared to what you are)?
- Can you identify the specific renewable energy program approach(es) used in your state?
- Are there programs for consumers to learn how to choose their energy provider?
- Does your local utility offer educational material on energy efficiency and saving energy?
- Does your utility have demand side options (such as smart metering, etc.)?
10: Energy Approaches- USA continued
Overview
Overview
As we continue our review of energy in the U.S., we now turn to the role of Energy Policy legislation and Executive Branch actions. In a previous lesson, we learned specifically about the role of deregulation and how it relates to renewable energy policy. But on a much broader scale, there have been several times in history when global and national events and conditions led to the creation of overarching energy policy legislation that had significant, cross-cutting impact on energy development and markets. There have been five major, relatively recent policies. In this lesson, we will review those policies and what the key impacts were for each. We will also touch on executive branch actions that have affected the marketplace.
Learning Outcomes
Upon completion of this lesson, you will be able to:
- Identify the key aspects of the seven pieces of energy policy legislation
- Describe how the Federal government leverages its energy use to impact the energy marketplace
- Describe the role of Executive Orders in driving Federal government energy use
- Explain how these policies affect energy accessibility, reliability, security, and sustainability
Lesson Roadmap
| Read | Lesson 10 content and all assigned readings |
|---|---|
| Discuss | Energy markets |
| Write | 325 word (+/- 10%) essay |
Questions?
If you have questions, please feel free to post them to the Questions about EGEE 401 Discussion forum in Canvas. While you are there, feel free to post your own responses if you, too, are able to help a classmate.Federal Government Energy Use
Federal Government Energy Use and Executive Branch Actions
We speak often of legislation and regulations, but the executive branch of government- the White House and federal agencies, also play a significant role in energy. For the purpose of this discussion, we consider the government not as the developer of legislation or implementer of law and regulation, but as an organization with energy-related impacts and demands. The U.S. government is one of the largest procurers of the energy in the world, and the single largest user and purchaser of energy in the U.S. The purchasing power of government to simply maintain its operations is large enough to affect and, to an extent, actually shape markets and pricing. Also, goals for improvement in energy performance can have a big impact on the overall energy use in the country.
One type of approach commonly used by the Federal government is the Executive Order (EO). An EO is a directive from the President to the Federal agencies and those entities under Executive Branch jurisdiction. An EO is not binding on the general public. However, EOs do impact the general population by the actions, or lack of actions, of Federal agencies in response to an EO. EOs do not have the force of law and remain in effect once issued until it is revised or revoked by the issuing President or a subsequent President. Congress can memorialize all or part of an EO into legislation, as happened with the energy efficient Federal buildings part of EO 13423 into the energy act of 2007 (see below). Once this happens, the EO or the portion memorialized now has the force of law and can only be changed or undone by Congress.
In the realm of energy, EOs are important in that they drive Federal use and procurement of energy which in turn affects the energy markets, in part because of the great use of energy by government operations.
Before we delve into what goals and commitments the Federal government has made over the years, let us explore how the U.S. government figures into national energy use.
Required Reading
Let us revisit the EIA Outlooks again to get a snapshot of energy use by the government. This short piece from 2019 gives you a good sense of how energy use has changed over the years and gives you an idea of which operations and agencies use the most.
EIA Outlook [86]
This resource by the Bureau of Transportation Statistics might provide more insight into specific fuel use by agency, which may give you a sense as to how agencies use energy.
Bureau of Transportation Statistics [87]
Questions to guide your reading:
- Which agencies are the biggest users? Why do you think that is?
- Why are the defense agencies separated out from the civilian agencies?
- Why is the Post Office such a big user based on percentage?
Now that we have a better use of how and how much energy is used by the government, let us explore how the government has addressed their energy usage over time. The best way to explore this is to review the various EOs in the past 20 years. EO 13423 issued in 2007 was the first one that consolidated the various environmental and energy goals of the government into a single, coordinated, and integrated sustainability strategy.
Required Reading
For the five main EOs (13423, 13514, 13693, 13834, and 14057), review the introduction sections, as well as the parts on scope and goals. Feel free to also read the more administrative sections that speak to roles and responsibilities and due dates, etc. if you find it interesting, but these sections are not required.
Questions to guide your reading
- How have goals and expectations changed over time?
- How do energy accessibility, reliability, security, and sustainability figure into the energy parts of the orders?
- How do the orders relate energy to other aspects such as water use and fleet management?
Energy Policy Acts
Energy Policy Acts
During the same periods of time when the EOs were being conceptualized and issued, Congress was busy developing pieces of legislation. Although there is no set interval for these actions, there have been some key events and conditions that led to the development of the legislation. Beginning with the 1978 act prompted by the severe Middle East oil crisis that resulted in long lines at the gas pumps, we see legislative actions attempting to solve a problem. We also see a pattern from the early acts to the later ones of first trying to address inherent flaws and weaknesses in our energy infrastructure, and then evolving into trying to further protect the consumer and incentivize more sustainable solutions such as renewable power and more fuel efficient and alternative fuel transportation.
Below are links to the key acts since 1975. For each, there is a summary of its key provisions and why they came to be. Also provided below are some useful links to read more about the legislation. If you are extra ambitious, links are also provided to the legislation itself. You do not have to read the acts themselves, but briefly scanning them will give you some good insight into how complex these pieces of legislation are. Also keep in mind that this Federal effort is superimposed on state level legislation and regulation. As the power sector became more deregulated at the Federal level, it forced the states to take on more responsibility, as we saw in the previous lesson.
Required Reading
Read the summaries below. In order to be able to follow along with the questions to guide your reading, you may wish to open some of the provided links.
Questions to guide your reading:
- Can you identify how the acts addressed security, accessibility, reliability, and sustainability?
- Do you note the increase in the role of energy sustainability in the later years (as demonstrated by increasing reference to renewables and efficiency)?
- In your opinion, which act is the “most important”?
Energy Policy and Conservation Act of 1975
The primary goals of EPCA are to increase energy production and supply, reduce energy demand, provide energy efficiency, and give the executive branch additional powers to respond to disruptions in energy supply.
- Public Law 94-163 [88]
Energy Conservation and Production Revenue Act of 1976
The Energy Conservation and Production Act of 1976 (P.L. 94–385) took the Energy Policy and Conservation Act of 1975 one step further by including incentives for conservation and renewable energy and providing loan guarantees for energy conservation in public and commercial buildings.
- H.R.6860 - 94th Congress (1975-1976): Energy Conservation and Conversion Act [89]
- A good summary of the 1975 and 1976 actions are found on pages 4 and 5 of the FEA Report [90]
1978-National Energy Act of 1978
The National Energy Act (NEA) of 1978 was passed by the U.S. Congress in response to the energy crisis of the 1970s. It was designed to resolve a disjointed national energy policy and empower the United States with greater control of its national energy destiny. The NEA and its progeny established energy efficiency programs, tax incentives, tax disincentives, energy conservation programs, alternative fuel programs, and regulatory and market-based initiatives. Results of the NEA have been mixed. Most of the market-based initiatives have been retained, but many of the regulatory initiatives have since been abandoned.
Energy Policy Act of 1992
The Energy Policy Act (EPAct) of 1992 (Public Law 102-486(PDF)) aims to reduce U.S. dependence on petroleum and improve air quality by addressing all aspects of energy supply and demand, including alternative fuels, renewable energy, and energy efficiency. EPAct 1992 encourages the use of alternative fuels through both regulatory and voluntary activities and approaches the U.S. Department of Energy (DOE) carries out. It requires federal, state, and alternative fuel provider fleets to acquire alternative fuel vehicles. EPAct 1992 also defines "alternative fuels" as: methanol, ethanol, and other alcohols; blends of 85% or more of alcohol with gasoline (E85); natural gas and liquid fuels domestically produced from natural gas; propane; hydrogen; electricity; biodiesel (B100); coal-derived liquid fuels; fuels, other than alcohol, derived from biological materials; and P-Series fuels, which were added to the definition in 1999. Under EPAct 1992, the US Department of Energy (DOE) has the authority to add more alternative fuels to the list of authorized alternative fuels if certain criteria are met. DOE's Clean Cities initiative was established in response to EPAct 1992 to implement voluntary alternative fuel vehicle deployment activities.
Energy Policy Act of 2005
This act was intended to further promote coal, oil, and gas development, but also provided for incentives such as tax credits for renewables. This act also had several provisions for clean fuels and alternative fuel vehicles. Another key component was a continuing effort to address the public utilities’ issues with power generation. This included provisions to fix problems caused by earlier legislation that deregulated parts of the power generation sector.
- Energy Policy Act of 2005 [94]
- Energy Policy Act of 2005 Fact Sheet [95]
- Impacts of the Energy Policy Act of 2005 [96]
Energy Independence and Security Act (EISA) of 2007
Signed on December 19, 2007, the act aims to increase U.S. energy security, develop renewable energy production, and improve vehicle fuel economy. Additionally, the act strived to increase the production of clean renewable fuels; protect consumers; increase the efficiency of products, buildings, and vehicles; promote research on and deploy greenhouse gas capture and storage options; improve the energy performance of the Federal Government. Regarding the Federal government performance, the act memorialized as law portions of Executive Order 13423.
- Energy Independence Security Act of 2007 [97]
- Energy Independence and Security Act of 2007 [98]
- Summary of the Energy Independence and Security Act [99]
Energy Policy Modernization Act of 2015
Overall, this bill continues the pattern seen throughout the development of legislation of increasing renewables, providing for more energy security by promoting domestic oil, gas, and coal production, and ensuring more reliable and affordable energy. This bill amends the Energy Conservation and Production Act, the Energy Policy and Conservation Act (EPCA), and the Energy Independence and Security Act of 2007 with respect to energy efficiency in buildings and appliances.
- Energy and Natural Resources: Energy Policy Modernization Act [100]
- Alliance to Save Energy: The Energy Policy Modernization Act of 2015 [101]
The Energy Act of 2020
The Energy Act modernizes and refocuses the Department of Energy’s research and development programs on the most pressing technology challenges — scaling up clean energy technologies like advanced nuclear, long-duration energy storage, carbon capture, and enhanced geothermal. Crucially, across all of these technologies, DOE is now empowered to launch the most aggressive commercial scale technology demonstration program in U.S. history. The bill sets up a moonshot of more than 20 full commercial scale demos by the mid-2020s.
- The Energy Act of 2020 [102]
Executive Order
- Catalyzing Clean Energy Industries and Jobs Through Federal Sustainabilit [103]y [104] (White House press release)
The Energy Provisions of the Inflation Reduction Act of 2022
The Inflation Reduction Act (IRA), which was signed into law in August 2022, will cut Americans’ energy costs, create good jobs and transform U.S. efforts to address the climate crisis. It is the largest single step that Congress has ever taken to address climate change. The IRA includes nearly $370 bilion in investments in disadvantaged communities, prioritizing projects that repurpose retired fossil fuel infrastructure and employ displaced workers, setting the U.S. on a course toward a fair, equitable and economic clean energy transition.
Lesson 10 Assignment
Overview:
In this lesson we learned about energy policy in the U.S. and the role of deregulation in renewable energy policy. In this assignment, you will draft a summary discussing key aspects of these policies.
Purpose:
This assignment will help you practice synthesizing your knowledge and presenting a concise written summary of key principles relating to energy generation and the four factors.
Successful Completion:
For this lesson’s assignment, imagine you are an expert providing consultation to the Congress in developing the “EGEE 401 Energy Policy Act of 2023.” You are tasked with writing the summary section identifying key provisions of the act. In 325 words (plus or minus 10%), write this summary, with an opening statement of the overall intent of the act, and continue with statements or bulleted points of the key provisions. For example, what would you say about power generation and the grid? Renewable energy? Climate change? Coal, oil, and gas? As part of your introduction, comment on key aspects of earlier legislation that informed your approach. In your essay, include something for about how your new legislation will support accessibility, security, reliability, and/or sustainability. You might want to review the most recent Acts to get a sense of how these are structured and for some content hints!
11: Energy and Climate Change
Overview
Overview
Climate change is the topic of its own course, and you will have dealt with it in several of your other classes. For this lesson, we will focus on the energy-climate change nexus. We know that a big part of the issue with climate change is the greenhouse gas emissions from consuming fossil fuels, and most of that occurs to generate energy. Hence, energy and climate change are intricately linked.
We will focus on climate change but from the perspective of energy. We have learned this semester that there are four drivers for energy decisions and policy- accessibility, reliability, security, and sustainability. And we have realized that a large part of the sustainability attributes relates to greenhouse gas emissions and climate change.
Learning Outcomes
Upon completion of this lesson, you will be able to:
- List the conflicting priorities between climate change-driven policy, and energy-driven policy
- Identify how the four attributes of energy (accessibility, reliability, security, and sustainability) relate to climate change
Lesson Roadmap
| Read | Lesson 11 content and all assigned readings |
|---|---|
| Participate |
Graded Discussion |
| Write | 325 word essay (+/- 10%) |
Questions?
If you have questions, please feel free to post them to the Questions about EGEE 401 Discussion forum in Canvas. While you are there, feel free to post your own responses if you, too, are able to help a classmate.
Energy and Climate Change
Energy and Climate Change
Energy production, or more specifically, use of fossil fuels to generate energy is one of the largest, if not the largest, contributor to greenhouse gas emissions and hence anthropogenic-induced climate change. We need to make this distinction about anthropogenic sources in that there are naturally occurring sources of greenhouse gases, especially carbon dioxide, that fluctuate over time and also contribute to climate change. We know from the geologic record that the earth has been experiencing climate change for billions of years. So clearly climate change is not a new issue coincident with the advancement of society. However, our widespread use of fossil fuels has surely changed the natural balance of greenhouse gasses in the atmosphere.
If the biggest anthropogenic contribution to climate change is use of fossil fuels, then energy production becomes the key activity. We consume fossil fuels to generate electricity, power transportation, and run industry. We also use fossil fuels commercially and residentially for heating, cooking, and other uses. We have learned this semester that simply switching away from fossil fuels is not practical in the short term, and would compromise goals of accessibility, reliability, and security even though it would help towards energy sustainability. The answer will be rooted in the ability to find an optimal balance of key activities- shift to renewables and alternate fuels, increases in energy efficiency, and finding ways to capture and sequester the carbon dioxide that is emitted.
Required Video
Please watch Dr. Meghan O'Sullivan present The Geopolitics of the Energy Transition: How the Pursuit of Net-Zero Changes International Politics" (specifically from minute 4:20 to 33:00). As noted in the video description: "This presentation is part of the 2021 lecture series, entitled Rethink Energy: Countdown to COP26, which is co-organized by the IIEA and ESB. On this occasion, Professor O’Sullivan discusses how the transition away from fossil fuels will remake the geopolitical landscape. In the wake of the COP26 summit in Glasgow, she focuses on how the increasingly urgent need to reduce greenhouse gas emissions is changing the priorities of the great powers, creating new divisions between countries, and offering new sources of geopolitical leverage. Professor O’Sullivan examines the global energy transition, particularly over the next decade as countries meet 2030 targets. She concludes by assessing how the actual efforts to move to a net-zero future will disrupt current patterns of international affairs, long before the world has completed this historically unprecedented energy transition. About the Speaker: Meghan O’Sullivan is the Jeanne Kirkpatrick Professor of the Practice of International Affairs and Director of the Geopolitics of Energy Project at Harvard Kennedy School. She is also the Chair of the North American Group of the Trilateral Commission. Professor O’Sullivan is an award-winning author, most recently of Windfall: How the New Energy Abundance Upends Global Politics and Strengthens America’s Power. From July 2013 to December 2013, Professor O’Sullivan was the Vice Chair of the All-Party Talks in Northern Ireland. She was also special assistant to President George W. Bush and Deputy National Security Advisor from 2004-2007. She is on the board of Raytheon Technologies and is a member of the International Advisory Group for Linklaters. Professor O’Sullivan was awarded the Defense Department’s highest honor for civilians. She holds a B.A. from Georgetown University and a masters and doctorate from Oxford University."
Questions to Guide your Viewing
- How will the power that comes from being a fossil fuel producer influence commitment for climate change?
- What do you think about Dr. O'Sullivan's point about climate change as a "threat multiplier"?
- Do you think the shift to renewables will shift the balance of power from petro-states to those with plentiful deposits of rare earths?
The Geopolitics of the Energy Transition: How the Pursuit of Net-Zero Changes International Politics Video (57:33)
[Music]
Good afternoon! And, you’re welcome! My name is Alex White, chair of the IIEA's energy Working group, and I’m delighted to welcome you to this event this afternoon, which is part of the 2021 lecture series brought to you by ESB and the IIEA. Throughout the course of the year, we've invited international thought leaders and renowned energy experts and political leaders to address critical issues in energy policy. I think if you've been with us even for some of those events, I think you'll agree that it has been, and continues to be, a most stimulating and informative series of engagements. And today, we are privileged to be joined by Professor Megan O’Sullivan. And I’d like to thank Megan for being with us today given her undoubtedly busy schedule.
Megan O’Sullivan is the Gene Kirkpatrick professor of the Practice of International Affairs and director of the Geopolitics of Energy project at Harvard Kennedy school. She's also the chair of the North American group of the Trilateral Commission. Professor O’Sullivan’s an award-winning author, most recently of, “Windfall: How the Energy Abundance Upends Global Politics and Strengthens America’s Power.” I always marvel at how American authors get away with such lengthy titles, and they still appear so punchy when you see them in the bookshops in the States. And that's certainly a very interesting volume, which I’m sure many of you have seen. From July 2013 to December 2013, Professor O’Sullivan was the vice chair of the All-Party Talks in Northern Ireland, as many people may recall. She was also special assistant to President George W. Bush, and deputy national security adviser from 2004 to 2007. She's on the board of Raytheon Technologies, is a member of the International Advisory Group for Linklaters. Professor O’Sullivan was awarded the Defense Department's highest honor for civilians. She holds a BA from Georgetown University, and a masters and a doctorate from Oxford University.
We'll have to stop at this point, or we'll take up the entire period that we have. That’s such a stellar, and interesting, and varied career that our distinguished speaker has this afternoon. The title of Megan O’Sullivan’s address is, “The Geopolitics of the Energy Transition: How will the pursuit of net zero change international politics?” What's going to happen this afternoon is that Megan will speak for maybe 15, 20 minutes. After that presentation, we're going to go to a Q and A session with you, our audience. You can join the discussion using the Q and A function on Zoom, which you should see there on your screen. Feel free to send your questions in throughout the session. Don't wait until the end. Once, if a question occurs to you, you can put it into the chat function and it'll be banked there, and we'll get to it at the end of the presentation. Please do identify yourself, if you don't mind, and your affiliation if you have one, when you ask a question. Reminder that the entire event is on the record and is being recorded as you probably know from an indication point. Feel free, the last point, to join the discussion on Twitter if you're so motivated. And the hashtag is #rethinkenergy. I want to thank, by the way, the ESB for their continued collaboration and support for this series. And we do have with us, Jim Dollard, who's executive director of Generation and Trading at the ESB. We hope perhaps to have a word from Jim, in the course of our afternoon session. So, hopefully we'll come to Jim later. Thank him for being present. And once again, thank the ESB for all of their support. It's over to you Megan O’Sullivan. Thank you for being with us, and the floor is yours.
Excellent! Thank you very much Alex, and good afternoon to all of you. It's still morning in my part of the world, but I know you're well ahead of me. It's a real pleasure to be here with all of you today and to be with the Institute of International European Affairs. This has been an engagement long in the making. I think it has literally been years that we have been going back and forth, and originally I was hoping to be with you in Dublin, a place that is near and dear to my heart. But alas, I am sitting here in Cambridge, Massachusetts, which is not a bad place to be, but we're still able to have what I expect will be a really interesting dialogue. And I’m also grateful for the support of ESB to the IIEA for this series.
And as Alex said, and Alex, thank you for that introduction, I’m going to talk about the energy transition. And that is, the move that the world is undergoing right now away from fossil fuels, or carbon intensive energy, to a world of a sustainable energy mix. And of course, this isn't the first time that the world has gone through an energy transition. And if we look at the past transitions, be it from wood to coal, or coal to oil, we can see that this transition will probably have a lot in common with those transitions. You know, for certain it will have the quality of actually taking generations.
It's never a quick thing to shift the fuel mix of a global economy, so it will take generations to do that. It will likely be very uneven around the world and most importantly this energy transition will occur, as others did in the past, not because the world ran out of the energy that was dominant in the mix, but either because of environmental or technological innovations allowed the world to move to what is viewed as a superior energy source. So, there's a lot that this energy transition will have in common with history. But when I really look at it, I think there's much more that will separate this transition from the previous transitions. That this transition is unprecedented in a number of ways that I think makes it much more complicated, much more fraught, than past transitions. And you know, most obviously there is the question of urgency. This isn't a transition we have the luxury of kind of sitting back and watching it unfold and placing bets as to what the timeline will be. This is a transition that we all know, having just witnessed COP26, how much urgency there is around the transition. And unlike other transitions, in this case we will need to displace existing energy sources well before it is economic to do so. And this is also very different than past energy transitions which have happened in the context of glowing, maybe glowing, but growing energy demand. And this has allowed new energy sources to come into the mix without needing to replace the old ones. Here, because we have an issue with the carbon that is emitted from the sources of energy that dominate the global energy mix right now, we're going to have to find a way to retire some of those assets well before we would do so if we were doing it just on economic grounds.
And then lastly, and I’d say most importantly, this is a transition that is going to be governed, or led, or eked out by policy as much as the market. Whereas in the past these transitions have been largely market driven, here we need the governments, because of the time urgency, to take us through this transition in conjunction with the market. But this makes it much more uncertain because as we all know, and I know acutely sitting here in the United States, that policy is reversible so we're facing what will be a massively disruptive transition. And I often hear people talk about the need for a smooth energy transition, and I try very hard you know not to lift my eyebrows, or roll my eyeballs, because I think the prospects of a smooth transition are approximately zero. We are talking about remaking the foundations of the global economy. We're not just moving to a different energy mix, a different use of energy sources, we are remaking the energy system of the globe and that is inevitably going to be hugely disruptive.
And this should be part of our expectations. It should be part of our policy planning process. And we should be thinking very hard about how this transition is going to remake the political order. And, as a former policymaker in the realm of foreign policy, I would say that policymakers are now really acutely focused on how climate change is a threat multiplier. And that's the language that we've really seen emerge from at least American political leaders over the last decade, that anything that was a problem before, is going to be more of a problem as a result of the warming of the planet. So, a huge focus on how the warming of the planet is going to create new security challenges, new foreign policy challenge, a real focus and I know this is true in Europe, the increased number of refugees that are going to result as the world gets warmer. That there'll be new crises prompted by natural disasters, either political or economic consequences of those disasters. From an American perspective, the Pentagon looks around the world and looks at the military bases that America has and, you know, realizes that many of these bases are going to be threatened by rising levels of water. And that this is going to prove problematic to our capabilities. So, there is a real focus on that. And that has changed in the last 10 years. Where I think before, this was not regarded as a major national security or foreign policy issue.
But I would say where we don't yet have sufficient attention, and this is where I’m going to gear most of my comments, is on the geopolitical implications of actually the energy transition itself. So, this is distinct from the warming of the planet. But I’m talking about the geopolitical impacts that everything we do, all of the efforts to decarbonize the economy, are going to have. So, if you think about the effort to move to net zero, as the title of my talk implies, just that effort, even if it's successful or not successful, that effort is going to reorder geopolitics. It's going to create some positive things and it's going to create a lot of new more problematic relationships or challenges. And I really think that policymakers need to focus more on this, because the reality is the transition is still decades in the making. So, we might focus at the net zero point, and we might say a world where we're really down to carbon emissions that are net zero, the world is not emitting any more carbon. And hopefully pulling carbon out of the atmosphere. That geopolitically, that might be a calmer world than the world dominated by oil and gas and coal of the last 100 years. But I would say we can fantasize about that world, but we have a few decades at least before we get there, and that interim is going to be extremely, extremely rocky. And a lot of the conventional wisdoms that I’m going to discuss about what that transition period is going to mean for geopolitics I think, are either wrong, or overstated, or oversimplified. And again, you know, really don't focus on this period where we're going to see not only the emerging geopolitics of clean energy. We're going to see them not replacing the geopolitics of oil and gas. We're going to see them layered on top of the geopolitics of oil and gas. And I think the best example we could have to point to this complex layering of geopolitical dynamics is what we've just experienced you know the COP26 talks happening in Glasgow, focusing the world at the same time of a very serious energy crisis in Europe, and China, India, and other parts of the world. Where you have Russia actually able to influence things geopolitically because of its ability to provide or not provide more gas to Europe in a geopolitical and economic crunch. So, we see both of those things happening simultaneously and that is going to be the mark of the next few decades.
So, what I’d like to do with the remainder of my time is to give a few examples. There are many. I’ll just do a few, a few examples of how these geopolitical shifts are going to arise from the transition itself. Again, from the acts and the efforts to move in a direction of decarbonizing the global economy. And I’ll emphasize how this process of transition is likely to be very different than the end state of net zero. And I’ll start with the most obvious and easiest example, and that is the power of petrostates. I think it is conventional wisdom but also true in a lot of ways that if and when the world gets to net zero, that the power of states that produce large amounts of oil and gas will be greatly diminished in the international system. And of course, oil and gas have been huge determinants of geopolitical power over the last not decade, century, I would say. So, that is true if we look ahead several decades. But in the interim, I think there's too often conventional wisdom that this transition is going to be completely destabilizing and disempowering for most oil and gas producers. I would say that is true in in many cases. I lived in Iraq for two years over the last decade and I’m very sensitive to how that country both has fairly fragile institutions and a budget that is overwhelmingly, and I mean 95 percent dependent, on oil revenues. In a country like that, it is really not well positioned for the years that are to come from the energy transition, similarly a country like Nigeria or Algeria, or perhaps even a country like Ecuador. So, there are many countries that are going to suffer are going to experience potentially big political changes. But I would say an area that we should also be focused on is the power of the gulf states of Saudi Arabia, of the Emirates, of other producers that actually are likely to be able to influence geopolitics even more so than they are now, in the coming decade or two because of the nature of the transition.
And very briefly, as many of you may well be familiar with, the reality is the world is not moving to a world where there will be no use of oil. I think a lot of the rhetoric that we hear would suggest that's the case. But if you really look at any of these energy projections, let's take the ones from the international energy agency in Paris, and you'll see that even in the net zero world, the world is still using a lot of oil and gas. I think the net zero 2050 projections of the IIEA that came out in the spring said, in a net zero world, so if we are successful in moving to a world of net zero which is compatible with climate ambitions, that the world will still be using about half as much gas as it's using today, and about a quarter as much oil as it's using today. Of course, that scenario assumes that there is viable and commercially sensible carbon capture technology.
So, it's not that these energy sources will be emitting carbon the same way, but they're still going to be a vital part of the energy mix. And countries like Saudi Arabia, and the UAU, and others, potentially Russia, actually have the ability to continue to be dominant producers in that landscape. That they have low cost, particularly the gulf producers, very low cost and actually very low carbon footprints of their oil production. And the result will be that as other producers around the world fade away, or just it becomes not commercial to produce anymore, those producers will be, as they like to say, the last producer standing. So not only will they continue to be able to produce oil, but they will be producing the overwhelming majority of the oil that the whole world consumes. And that of course brings more geopolitical power than we're seeing from them today in OPEC.
So that is one example about how some of the conventional wisdoms about this energy transition really deserve a second look so that we can better anticipate the politics going forward. I’ll give a couple of more examples, and I’m sure the other ones that I’d like to touch on can come up in our Q and A. I’d also point out that as people are well aware, that clean energy will itself bring new sources of geopolitical power and I think this is really important and interesting, and to the extent that I am concerned about the conversation about clean energy geopolitical power, it is that it is a little bit too high level. I think it's important for us to really kind of look more deeply at what the sources of geopolitical power are going to be from a clean energy superpower. Like, what actually makes a country a clean energy superpower? And there, I would say it's two things primarily at the high-level, innovation and access to cheap capital.
But when we dig down there are several other areas where a country might actually be able to exert geopolitical power on account of its clean energy status. And I would say one is the ability to set standards. Which I won't say much about, but happy to return to if people would like. Two, is this issue of critical minerals. Which I think is worth saying a few issues about here at the outset, because it is really, I think, capturing the attention of people much more than it did a few years ago. And essentially, as many of you may be aware, even though we're moving in the direction, and hopefully we'll move even more rapidly in the direction, of energy sources like wind and solar, and will deploy electric vehicles. These innovations require very high concentrations of some critical minerals. And I’m talking, you know, nickel, cobalt, lithium, rare earth's elements, these types of minerals are needed in much greater quantities than they currently are produced in the world. And in fact, the EIA says in 2040, if we're actually on track to hit our climate goals, we'll be using six times these critical minerals that are currently produced in the world today. So, that creates concerns about you know, can the world ramp up this production sufficiently to actually enable these technologies to grow at the scale that these projections would seem to suggest, or is required to make the transition? And it also raises questions about supply chains. And here, China has a very dominant role not only in in producing these critical minerals but even more so, in the processing and refining of these minerals.
And so, right now we can go into more detail, but China does have a very dominant role in the supply chain. And I think it's quite reasonable for people to be concerned that China might use that role to exert geopolitical power in the future. We can look to 2010, when China did decide to stop exporting rare earth elements to Japan. In the context of a dispute over the Senkaku islands in the East China Sea. So, China has demonstrated, you know, a willingness or a propensity to do this in the past. And, you know, this is a reasonable concern going forward. And to make a long story short, which we can dig into in more detail, I think that the main point that I take away is that in the short to medium term, that China’s real lock on the supply chain I think, is going to have big geopolitical effects. But over the longer run we're going to see the market and governments respond to this dominance. And we will see the development of more production, more refining, more processing in other parts of the world as people are no longer simply focused on the fact that China can do this cheaply, and China is willing to bear the economic cost, other countries will step in. But there will be a window between now and then which may be 10 to 15 years before either there is more supply of these critical minerals, or people have come up with alternatives and substitutes for these minerals, and no longer are they needed quite so much. Other sources of geopolitical power in a clean energy economy I think is the ability to manufacture inputs cheaply. Again, China very much dominant particularly in the solar panels, as we know. And here we should say yes, this this gives them some real economic and potentially political influence. But it's not the same as the 1973 oil embargo. Being able to withhold an input into an energy process is different than actually withholding an energy source itself. So, we should be cognizant of this power but also not overstate it.
And then lastly, something that I think I will leave for Q and A, but I hope very much we’ll come back to, is this whole question of geopolitical influence from being a low-carbon fuel producer. And there I’m talking mostly about hydrogen and ammonia. And I think that is a very important and interesting sector that will develop. And it could have a lot of the hallmarks of the natural gas, both the kind of the infrastructure, the supply chain, but also the geopolitical dimensions that the liquefied natural gas market has had in the last several decades. So, I hope we will return to the hydrogen question.
Just a couple more ways in which the world is going to change geopolitically because of the energy transition. One of them that I wanted to touch on is the whole issue of globalization. We've all been very much beneficiaries of globalization of this trend. It really depends on who you ask when globalization started. Some people would say after World War II, some people say the collapse the Soviet Union, others go back into the 1800’s. You know undoubtedly, it's been a process that has shaped the world and has shaped economic and political relationships for many decades. And under covid we saw a little bit of a step away from globalization and things moving more in the direction of deglobalization. And there is an open question about whether the energy transition will reinforce these deglobalizing trends?
Without being definitive about it I would say, on balance, I do expect that the energy transition will move power, or will move away from energy being a globalizing factor to energy being more of a deglobalizing factor for a few reasons, two of which I’ll mention here. We certainly know that energy trade is a major component of the global economy. Energy trade binds the world together. People are consuming energy from all over the world. And a world that is net zero, or is moving in that direction, is much, much more likely to be a highly electrified world. A world where the economies or a lot of what we do today using other sources of energy, will be electrified. And if you look at some of these projections, there was a Princeton study that looked at what America’s economy would look like in a net zero scenario, and it anticipated that America would use two to three times the amount of electricity that it's using today, to power cars, to power you know virtually everything that it's possible to electrify and still work well. Of course, there are sectors of the economy that are hard to electrify. But if that's the case that the world is more electrified and that electricity comes from low carbon or zero carbon energy sources, then that will remove a big part of the global trade economy. And it is simply the reality at least right now, and probably for the foreseeable future, that it's not very economical to pass electricity over very long distances because of transmission losses. And as a result, countries will be consuming more energy that they either produce within their own borders, or that are produced maybe in adjacent countries. So, there'll be that move away from a global energy market trade to much more domestic or regional energy market trade.
I’d also say one of the deglobalizing trends that I’m particularly concerned about as it relates to the energy transition has to do with the rise in protectionism. And this is something I’m actually hoping that I will learn from some of you today more deeply about some of the initiatives that the European Union is thinking of taking, having to do with trying to levelize the costs of manufacturing and other things by instituting what we're calling, carbon border adjustment mechanisms. Of course as conceptualized that tool is simply to level the playing field between countries or regions that actually put a price on carbon and those that don't. However, it is not too hard to see, and this is not directed at Europe, per se, but just that countries whether it's eventually the United States or somewhere else that use these mechanisms, that this could become you know a steppingstone to a larger protectionism that actually creates a lot of barriers between a developed green economy and a more developing dirty economy. And this of course would be very de-globalizing and would have a lot of implications. We can talk a lot about great power dynamics as being another thing that is going to be influenced by the energy transition and I imagine that some of the comments and questions we'll take in our in our discussion will bear on that. I think that this energy transition is going to have great bearing on the relationship between Russia and Europe, between Russia and China, between the U.S. and China, between India and China. There's all kinds of great power relationships that will be perhaps fundamentally affected by the energy transition.
The one I’ll just say a couple of words about is that U.S. - China relationship and again happy to go into it in more detail if people would like. As is very evident I think to anyone who would be inclined to call in this afternoon or join this call, you know the U.S. - China relationship is you know perhaps more fraught than it has been at any point really maybe since Tiananmen Square. And the relationship is also a lot more complex. There has been a lot of hope and expectation that climate would be an area around which the U.S. and China can find common ground. That climate could be a little island of cooperation otherwise in a sea of confrontation. I would say you know the last week we've had a few indications that there's still an aspiration for that to be the case, both on the part of Washington and Beijing. But I think over the last, well almost year that President Biden has been in office what we've seen is actually the opposite. That it's been very hard to detangle climate from the rest of the relationship and that if anything, I think the climate relationship between the U.S. and China is likely to be more competitive than it is going to be cooperative. And the big question that remains is actually will a competitive rather than cooperative relationship between the U.S. and China be conducive to a successful energy transition? Or will it be an obstacle? Will it be a roadblock in the effort to get to net zero?
Let me mention one last dynamic and then close. And I look forward to comments. The last dynamic I’d like to mention, the geopolitical dynamic that I think will be greatly either altered or exacerbated by the energy transition, is the relationship between the developed and the developing world. I think over the last several decades the world settled into a trajectory, and I’m looking at this from a fairly high level, but where the developing world was growing more quickly than the developed world. And that there you know was a phrase in development economics called convergence, where you know eventually the developed world would grow and the developing world would grow more quickly. And that these two types of economies were both growing in tandem. We're now I think in a different kind of landscape. And part of that has a lot to do with covid, as we're well aware. And how covid has exacerbated inequalities within countries but also between countries and certainly between the developed and the developing world. And I think the energy transition is going to have the same effect and it's likely to be even greater. We certainly saw the tensions between the developing world and the developed world well on display in Glasgow. And those tensions I think are only going to intensify as sense of climate injustice increases as countries in the developed world become more and more impatient and more and more focused on the need to decarbonize economies. I think what we're going to see hopefully is more aid and cooperation given to the developing world. But the reality seems to point in the direction that it is plausible to imagine we're going to see more frustration, more pressure, and potentially the use not only of incentives but also penalties to try to get countries to move to decarbonize their economies without addressing what the developing world looks at as a huge injustice. If we think about the cumulative emissions in the in the atmosphere today, twenty five percent of them are from the United States, going back to the industrial era up until today. Only two percent of those emissions are from Africa. And so, you can see this is the grounds for I would say a very contentious relationship.
So, I’ll stop there, and I’ll say you know pointing out the ways in which geopolitics are going to be exacerbated, complicated by the energy transition, in doing this I’m not at all trying to argue against the transition. There's no question in my mind that there is great urgency associated with this transition. And my intention is much more to highlight to policymakers that we need to pay a significant amount of attention to how the process of decarbonization is going to upset geopolitics in international relationships. And it's important for us to do so for a number of reasons, most obviously to any foreign policy maker you want to anticipate new tensions, new threats, new dynamics in relationships. Some of them will be opportunities, some of them will be challenges. But I’d also say it's really important that we do this if we're interested in keeping the possibility of a successful energy transition in our sights. Because certainly the ability for the side effects of this energy transition to undermine the transition itself are evident. The possibility that the transition fuels populist parties that oppose the energy transition is certainly something that we can easily imagine, or actually might be seeing, in different parts of the world. And certainly, if we get to a place where national security considerations are seen as being at odds with moving forward in the energy transition, this could be extremely problematic for the speed and the scope of the energy transition. Which is where I started this talk, by just underscoring how urgent both of those things are.
So, with that, Alex and Jim, I’d like to stop. And I’m looking forward to comments and questions. And as I said, feel free to disagree with me or educate me. Not everything needs to be a question.
Fantastic, thank you so much for that. You've covered so much ground. And I’m sure there will be many questions. And you've stimulated a lot of thoughts and ideas, I’m sure, in all our minds. Jim, we had some slight difficulties with the connection to you earlier. Do we have your audio? Can you hear me, okay? I can hear you, Alex. Can you hear me? Oh excellent! And I can hear you, which is even more important. Do you have any thoughts, or just some insights? We were, we were going to have you in, to you know, before Megan started. We're very happy to have you now with any thoughts that you have.
Just briefly, chairman, and good afternoon, everybody. I hope you'll all agree that was a really interesting lecture from Megan, the latest in the IIEA Rethink Energy series. I think it is very timely, Megan said that it's very timely in the context of COP26, but also in our own country in terms of the climate action plan, revised plan, that's going to put climate action at center stage for us in every aspect of our lives. I suppose for ESB, you know our strategy is to deliver secure, affordable zero-carbon future in terms of energy. And that's going to be a significant change. It's going to be very demanding right across the value chain from networks generation, and right through our customer-facing businesses. I’m responsible for generation within ESB and I suppose you know at one level the renewables challenge is very significant. But it's a known challenge. It's one we can see. And it's one we're intent on delivering. I think the storage challenge, and Megan mentioned green hydrogen, for Ireland storage is going to be huge issue in the delivery of the success of renewables. How do we manage intermittency? And I think green hydrogen is a really important play for Ireland. And ESB strongly believes that, and that's why we launched this year, the Green Atlantic project at Moneypoint. But we see that becoming a major energy hub for the island. I think, over the next 10 years though, gas in particular will be a critical part of our transformation. That is a reality in this country. We are moving to net zero, but gas will be a reality. We've seen what's happened in gas prices in the last, I suppose two months, they've multiplied by between a factor of six and ten. And the impact that's already having on our economy and the issues even this week with North Stream II in terms of its certification in Germany with Russia. And so, the issues Meghan talks about are really timely, really interesting and are framing, I suppose, our immediate future. I think in particular, I really liked Meghan your comments about a smooth transition. I think that's particularly noteworthy the way you put it. I really recognize what you've said because it's a massive transition. I think your comments on a role of existing players on the world stage is to be noted given our dependence on gas for the next 10, 20 years, really relevant. I think there's something for Ireland, what you said about role of new players. Can Ireland innovate? Can it bring enough capital in in hydrogen and other places to play a big role beyond what it currently sees maybe? And finally, your comments around supply chains. We can see what's happened in solar. We can see there's a race in hydrogen now as well. And the economies are competing to be the supply chain into the future. So, I think your discussion, your presentation, was really fantastic and very timely in the world we live in.
Thanks very much Jim! That's terrific. And we've got lots of questions coming in here. And I’m just going to go first of all to one from James Libsy. And in a way he's sort of summarizing some of the key themes of what you presented. And he's asking the question back to you in the following way. He says, “Thank you, first of all, for a fascinating talk.” And says, “Can we anticipate whether the strains of the energy transition will strengthen the role of international society? International society is an interesting concept and a rules-based order? Or will those strains drive us rather more towards greater competition between trading blocs? And is there anything we can anticipate around migration in this regard?”
Sure, it's a great question James, and I think it kind of gets at the heart of the whole question you're asking. Look at the whole geopolitical order itself. And I would say you can argue this both ways right now. Being an optimist, I’d like to say that there's certainly opportunities to rebuild some parts of the international order around these new realities. That even before the energy transition was so front and foremost in the minds of so many people around the world, there's an acknowledgment that the international order that has buttressed much of the globe over the last 70 years was under strain for a variety of other reasons, be it the rise of China, the diffusion of economic power. There were lots of things that were putting that order under strain. And so, I think there is, and was, a need to re-look at that international system, that international order, even before we start considering climate and the energy transition. But now that we are so squarely in that transition and our success in that transition is so urgent to, you know, the success of peace and prosperity. As we think about remaking the institutions of global governments, I think having the transition be central will be a part of that. The downside of the glass half-full part of that question, I think, has a lot to do with the U.S. - China relationship. In my mind when I really think about a successful energy transition, it's hard to imagine that it can be done without U.S. - China cooperation. That U.S. - China cooperation you know, part of the success of Paris, I think, was really built on the back of a successful and an ambitious U.S. - China agreement that was made in 2015 between President Xi and President Obama. And that you know Glasgow was really apparent, that and it was really apparent that that relationship no longer existed. That kind of willingness to join, to link arms and march forward, and demonstrate global leadership in tandem for this issue, I think was apparent. And I think does kind of undermine the sense of how this might be a more globally orchestrated transition than it will be otherwise. Do you, in saying that do you discount the, you know, that joint declaration that was made just in the first couple of days of Glasgow between the U.S. and China? Or, how do you assess that?
Yeah no, thanks for bringing that in, Alex. I don't discount that. I see it as a positive development. But you know when you really compare it to the U.S. - China climate agreement of 2015 between Obama and Xi, it has far less meat in it. It's really largely aspirational. And the reality is, now that you know we learn more about the enormous efforts that went into getting what is a positive, but fairly meager in terms of substance, statement you know you could see how much harder it was to get something that was so much less. So, I think it's positive in the sense that both countries I think are eager to avoid you know there's a lot of talk about a new cold war here in the U.S. between the U.S. and China. And I think there's a lot of interest on both sides, in Beijing and in Washington, in avoiding that. And I think there is this hope and expectation that climate could be an area where we could at least carve out some amounts of cooperation. You know we saw after COP just in the last few days, a very long meeting, virtual meeting between President Xi and President Biden, and by all accounts it was a warm and friendly meeting. But there was no real deliverables, which as a former US policymaker, it's really striking that you would have a summit of these two leaders. And normally you would have a whole raft of things that would be announced and would be rolled out. And here, you know success is gauged simply as a lack of ranker, you know, and that just demonstrates how much this relationship has, the distance it has to travel in order for it to be a driver of the climate debate. On that question of deliverables. And of course, you're right because political leaders where there's international engagement, or indeed when there's engagement between political figures and policy makers at the domestic level, people look for deliverables, quote - unquote, that you know, what came out of the meeting? But is there a case I mean when you look at Glasgow, and you start to assess what happened in Glasgow, I mean there are different views anywhere between failure to disappointment, to a good start, to a great success if you're Boris Johnson? So, it's all somewhere, it's somewhere along that continuum. And doesn't it become harder in this whole discourse to look for big moments? I mean Paris is a big moment. There are other big moments. There's so much happening, so much that needs to happen, not necessarily slowly, but more and more is happening and therefore it's harder to put your finger on. It’s harder to have an expectation of a big moment. If you have lots of smaller moments, or lots of movement you’re still perhaps getting success.
Yeah, no. I think that's an interesting perspective Alex. And I think it is very hard, you know. We all knew that regardless of what happened in Glasgow, it would be touted as a success. And so, as an observer you're trying to figure out well, how much of it was a success, and how much of it was not? And you know I’d say on that that broad question in my mind, you know Glasgow exceeded the bar, that of expectations that had been set, but that bar was incredibly low. So, you know, if I were asked you know how much of the glass was full, I’d say it was about a quarter-full and three-quarters empty. But to your point, I do think that we are going to see progress more marked by a whole series of initiatives that may not have the stamp of every country in the global community. So, one of my concerns about Glasgow was, what if it was so unsuccessful that it kind of discredited the whole COP mechanism as a way for the world to come together to talk about and address climate change? Like that was I think a legitimate concern. And that certainly didn't happen. You know certainly I think we underscored the importance of these meetings. Now we're going to put more emphasis on them in an annual way and trying to spur countries to up their ambitions in an annual sense.
So, that's all good. But what I’m really struck by is that COP, because it is so difficult to do anything unanimously with countries with so many disparate interests, you know COP has become really useful for side agreements that actually matter a lot. So, when I think about the biggest, the things of greatest note coming out of COP they actually have to do with agreements that not everyone signed up to. And here I put the methane agreement on the table as something that is potentially very significant. A lot of countries signed up to it, not everybody, but if you know the world is able to bring down methane ambitions by 30 percent by 2030, that is going to be really beneficial to climate change. You know the deforestation side agreement, also something significant. We had a number of announcements on coal, I think none of them added up to what we were really looking for when it came to coal, but they are you know, they're notable. And hopefully they will be, and they will expand. So, to your point, I think there's going to be less of a moment where we actually think we're on track. And increasingly, again I like to think of myself as an optimist, but increasingly I find myself really hoping that technology is going to deliver us that “aha!” moment, not politics. That you know if we do find ourselves able to exceed the expectations and the pledges that have made thus far, I think it is much more likely going to be because of the technological advance than it is going to be because of a new-found political will. And certainly, if we look at the IIEA's predictions, and they talk about you know net zero 2050, they say, no a significant percentage, I think it may be half of the technologies that we need to get to net zero in 2050 are not commercial today. So, big role for technology.
Michael Connery has an interesting question. “You've touched on protectionism, and I suppose there are different layers of protectionism, and different kinds of protectionism.” He says, “To what extent do you believe we will see a continuation of the existing global patterns of wealth accumulation and resource transfer during and after an energy transition? And, in particular has Covid 19 and protectionist vaccine policy for example, provided a bell weather for this?” Yeah, so I think that's a very interesting question. I’m not sure exactly when he's sent it whether it's before or after I talked about the developing world? But of course this I think is one of my real concerns that the inequities in the global system are, that we have seen and that have been I think incredibly reinforced or exacerbated by covid, will be doubly reinforced by the energy transition. Now again, at the start of my talk I differentiated between that there's actually the net zero world which may be very beneficial for the developing world. You know the developing world has a number of assets and advantages that will be important and will be beneficial in a world of net zero emissions. You know they have potentially big areas where they can store carbon if carbon capture becomes, as is expected to be, an important part of getting to net zero. The developing world has a lot of landscape where it can be very competitive when it comes to renewable energy power. And that could give many countries a leg up on producing green hydrogen and ammonia, which is expected to be a very important part of the global energy mix. So, in the long term I think the developing world has a number of ways to really prosper from an energy transition. But in this interim period, where we're seeing the continued, the continued ravages on the developing world of the actual warming of the climate, and the continued shortages of the developed world in providing for the developing world, I think it's a real cause for concern. As probably many people on this call know in 2009 the developed world pledged that every year by 2020 it would be providing 100 billion dollars to the developing world to help with both mitigation and adaptation for climate change. Now we're 2021, everybody has a different measure, but nobody argues that the developed world is close to transferring that amount of money. And we now have an appreciation that actually 100 billion dollars a year is grossly insignificant in the face of what's actually going to be needed. Where estimates that say there's going to need to be 100 trillion dollars of investment between now and 2050 if the world is going to get there. And a lot of that will be in the developing world. So, I think there is a really very good reason for not just concern, but good reason for thinking about how some of those inequities can be headed off, can be addressed. And as much as I am on board with trying to phase out or phase down, whatever phrase you want to use, of coal. You know we also have to couple that with initiatives that don't only block off pathways of development for the developing world but open new avenues. So simply to say we're going to take away your most cost-effective way of getting energy that can actually drive economic growth, we also have to say we're going to help ensure that you do get alternative cleaner energies. And I think there the mechanisms are not as well developed yet.
Okay, thank you. I’m going to, I’m going to put two questions to you. A lot of people are asking about nuclear, interestingly enough. So one of the two questions I’m just going to ask you to consider is about nuclear. Alexander Conway who is the EU affairs researcher here at the IIEA, says that you didn't get a chance to mention nuclear, but you mentioned a lot of things. You can't, I suppose, cover everything, but I’m sure you have plenty to say on that topic as well. “Given the expansion of mini reactors in the United Kingdom and the inclusion of nuclear as a green quote-unquote energy source under the EU taxonomy rules, would you like to comment on the role of nuclear and its potential geopolitical implications as part of the green transition?” So that's nuclear, and if you don't mind, I’m going to pitch a second question to you as well. I was going to say it's related, it's not really, but everything's related. Peter O’Shea at the ESB, “President Biden is targeting a decarbonized electricity system by 2035. How bought in our society and the industry itself to the scale of investment and change required in order to achieve that? And how widely are the geopolitical aspects of the transition being considered, especially given the US current position as a net exporter of energy?” Sorry, there's a lot there the two questions but I’m sure you'll pick up on them no problem. Right, two questions and three minutes so let me let me do my best here. So, first on the first one having to do with nuclear power, and I certainly am aware that I didn't spend time on it, but it is a huge component of this conversation. And there are some people who are real advocates for climate in the environment to also put nuclear in there as something that needs to fade away in terms of our energy mix. I would be on the opposite side of the equation there. And that you know I almost feel you can't really consider yourself to be serious about the climate if you're against nuclear power, because if we look at the kinds of the energy sources that are going to be required, that are going to be zero or low carbon energy, we can't get there without, not just nuclear power as it exists today, but a pretty substantial ramp up in nuclear power going forward. So, I would say there is unquestionably an important role for nuclear power. And I think that this is an area where some new technologies could really be helpful. These small modular reactors actually being among them. You know any, I think modification, or technological advancement that diminishes concerns over waste and over proliferation, I think is going to be welcome. There's a huge geopolitical component here, which I won't go into in a lot of detail. But simply to say from an American perspective this used to be an area where America really was very dominant in terms of countries that wanted to build civilian nuclear power capacity. That America was very much on the forefront of that and that gave an American ability to really influence standards proliferation you know, considerations and safety measures. And now, America, because of our own industry and constraints on our own industry, has taken a bit of a back seat and we see Russia and China as really being very dominant global players. And seeing that the expansion of their ability to help countries build civilian nuclear reactors as being a real advantage to them not just economically but also politically and geopolitically. Just to leave some time for the last question about you know the questioner was right of course that President Biden, one of his very ambitious goals is to have an energy, an electricity sector in the U.S. that is 100 percent emissions free by 2035. And this will require massive changes in infrastructure and I would say, in attitudes in the United States. And the question I think was like, how bought in is the American political system and industry? And here I would distinguish between the two. Really I would say that industry is eager for very clear signals. They’re eager for certainty. They're eager for signals about where the future is going to go. Where the government is going to subsidize? Where the market is going to be buttressed by different kinds of policy signals so that they can set themselves up for success. And I think that we're talking about a very significant transformation of our electricity model. And our utilities and their business model will need to change significantly. But I think there is an awareness of this within the industry. I think politically this is still an issue that is very wrought here in the United States. As you see America is trying to get through an infrastructure bill that basically would provide a lot of money to bring about a more climate-friendly economy. Some of this has bipartisan support, but a lot of it doesn't. A lot of it is not seen as essential. And so, I think that this is you know very much a work in progress. There's certainly more bipartisan support for addressing climate in some respects than there was in the past. Nuclear energy, carbon removal, these are things that are bipartisan which wasn't true before. But I think we have a long way to go before we have the kind of political consensus that will be needed to drive the kinds of changes that will be required to get our economy anywhere close to net zero.
You've taken us directly to the top of the hour. I think you've got another commitment. And I’m sure many people on this call do. I’m headed to the airport of all places! Is that right? Well then, we're not going to delay you any further. But it's just been a fascinating 55 minutes, whatever we managed to do. Sorry about the delay at the outset. It's just been terrific. It's a conversation that I’m sure we'll continue. And I suppose it's a truism that the climate issue, no country's climate change problem can be solved by that country. So that the geopolitics of what is happening, what needs to happen, is just you know just self-evidently center stage. Last Saturday afternoon we were watching the tv, most of the time when people think of geopolitics they think if something happens over a period of time, happens behind closed doors. It's the sweep of history. You read books about it rather than see it in the newspaper every day. But last Saturday afternoon, I mean we just saw it play out on the floor of the exhibition center right there in Glasgow, where you had the intervention with Saudi Arabia and India, and so on. So, it's really brought, I think, brought it home to us how critically important your agenda, the agenda you've been speaking to, actually is in this entire debate. And you've opened I think, a number of different aspects of that for us in the last hour. So, I just want to thank you so much for joining us this afternoon, for being so free with your time, and being willing to address and field so many questions. There are so many more there on the chat, or on the Q and A we just don't have a chance to get to. Hopefully see you again sometime before too long. Professor Megan O’Sullivan thank you so much for being with us. Thank you, Alex. I want to just also extend my thanks again to the IIEA for hosting me. It's been a pleasure. I want to apologize to people who asked excellent questions in the chat we didn't get to. And I very much am interested in continuing the conversation and welcome the chance to interact in the future. Have a good afternoon and a good weekend.
[Music]
Required Reading
An excellent and recent paper written by GE very nicely discusses this issue of needing a multi-faceted and integrated approach to deal with energy demand and climate change. At a minimum, read the introduction and Executive Summary (pages 2-5) and the Conclusions and Recommendations Section (page 19) of the paper. Also review figures 7 and 8 which provide a graphical summary of the interplay between fuel sources and climate impacts. However, it is highly encouraged that you at least scan, if not the read the entire paper. You will gain much insight on some of the current and leading technology ideas regarding energy in the context of a climate-constrained world.
Renewables and Gas Power can Rapidly Change the Trajectory on Climate Change [106]
Questions to guide your reading:
- Do you see a role for natural gas vs. coal in terms of greenhouse gas emissions reductions?
- How are renewables helping with climate change?
- How would you relate the conclusions and recommendations on page 19 to energy accessibility, reliability, security, and sustainability?
- How do the conclusions and recommendations relate to the SDGs?
Climate Change in Energy Policy
Climate Change in Energy Policy
Let us go back to the previous two lessons where we learned about national energy policy development and revisit the information, but now through the lens of climate related implications. Review the summaries and scope of the energy deregulation and renewable policies at the state level, and the several national energy policy acts to find where the climate change issue is represented. Note that it may not be explicitly referred to as climate change; but instead, may appear as renewables, efficiency, and sustainable aspects. But we know that renewables, energy efficiency, and other sustainability related aspects more often than not actually refer to greenhouse gas emission reductions as the purpose.
Required Reading
In order to complete the lesson assignment, you will need to review the summaries of the policies discussed in the previous two lessons. But this time looking for connections to climate change aspects.Energy, Climate Change, and the SDGs
Energy, Climate Change, and the SDGs
Now let us go back to the early lessons where we learned about the Sustainable Development Goals (SDGs), especially Goal #7 on energy. But this time, also review Goal #13 Climate Action. Whereas Goal 7 has several reference and targets for clean and sustainable energy, Goal 13 is not explicit that sustainable energy is part of the climate solution.
Lesson 11 Assignment
Overview:
In this lesson we learned about the energy climate nexus. In this assignment, you will write a brief essay discussing important energy related policies and the four factors.
Purpose:
This assignment will help you practice synthesizing your knowledge through a written essay discussing the SDGs, global climate change policies, and the four factors.
Successful Completion:
For this lesson, you will prepare a 325 word (plus or minus 10%) essay that answers the following questions:
For us in the USA, do you feel that an SDGs and global climate change policy approach, or the current domestic approach in energy policies and legislation is better for energy accessibility, reliability, security, and sustainability? In other words, would an energy policy-focused approach, or one more driven by SDGs and climate change goals get us closer to having the energy we need and want, but also minimizing the climate related impacts associated with energy? What are some of the conflicting priorities?
For this lesson assignment, you will need to draw on what you learned in the lesson about the SDGs, and the lessons on U.S. energy approaches. Feel free to review the summaries of the energy policy acts, other legislative actions on energy regulation and renewable polices, and progress on SDG goal #7. You can revisit the energy outlooks to refresh your memory on trends and patterns.
12: Energy Food Water Nexus
Overview
Overview
Throughout the semester, we focused on energy in terms of fuel sources and electricity generation. We learned about the importance of energy accessibility, reliability, security, and sustainability. In a previous lesson, we focused on the relationship between energy and climate. In this lesson we will focus on the role of energy in regard to water and food. Why these two? While having electricity is necessary for advancement of societies and growing economies, having food and water is essential to life itself. Understanding the relationship between energy and water, and energy and food, is an important aspect of understanding the true impact of energy. But we will also realize that there are times when energy comes in competition with water and food. How then do you determine which gets priority? We will see that the answer is not always clear cut.
Learning Outcomes
Upon completion of this lesson, you will be able to:
- Relate the key aspects of the energy-water nexus and energy-food nexus
- Compare and contrast how the four attributes of energy (accessibility, reliability, security, and sustainability) relate to priorities around water and food
- Describe some of the efforts and innovations to address the nexuses
Lesson Roadmap
| Read | Lesson 12 content and all assigned readings |
|---|---|
| Participate | Graded Discussion |
| Complete | Infographic |
Questions?
If you have questions, please feel free to post them to the Questions about EGEE 401 Discussion forum in Canvas. While you are there, feel free to post your own responses if you, too, are able to help a classmate.
The Energy-Water Nexus
The Energy-Water Nexus
This nexus is rather straightforward, and we see this has two components- it takes energy to manage water, and it takes water to generate energy. Because with water, we have the same attributes to contend with- water accessibility, reliability, security, and sustainability. The difference is that for the most part, any lapses in these attributes, especially the first three, can mean life or death. One of the biggest reasons for deaths in developing countries is poor quality drinking water and access to sanitation.
Energy for water- We also need to recognize that when we talk about energy and water, we mean the energy needed to transport, collect, treat, and distribute water; as well as the energy needed to collect, treat, and discharge water. When there is a power outage, it is more than the lights going out. It means water supply and treatment plants cannot operate unless they have emergency power sources. To them, energy reliability is paramount.
Water for energy- From the other perspective, we know it takes much water to generate energy. Whether it is cooling water for power plants and solar farms, flowing water for hydropower, or water in the manufacturing process of renewable energy equipment, water is an integral part of power generation and energy supply. Interestingly, in terms of water use for power generation, a great amount of water is used, but very little is actually consumed. In other words, at a power plant, water is used to cool, but then is returned to the same local watershed. As we will see below in the food discussion, in agriculture much water is consumed- meaning it becomes part of the product and leaves the watershed.
A relatively new and contentious issue in the water-energy nexus is the concept of hydraulic fracturing for gas production. This is the practice of injecting water into a subsurface formation to force open fractures, or cracks, to allow the trapped natural gas to flow to the wellhead more freely. Ironically, this is not new technology and use of water for secondary fossil fuel recovery has been around for decades. But with the expansive growth of fracking, and the growing awareness of the sensitivity of water supplies, it is much more in the public eye than ever before.
Required Reading
Read the following pages in the Department of Energy’s report “The Water Energy Nexus- Challenges and Opportunities [109]”
Read pages 1, and 3 to 7. Pay special attention to figure 6. This is a complex, but important-to-understand figure because it gives a sense of proportionality- how energy, water, and food (represented by the agriculture sector) interact. The easiest way to follow this figure is to follow individual color paths from left to right.
Questions to guide your reading:
- In terms of freshwater use, proportionally how much goes to energy production and agriculture?
- How would the recommended integrated approach to water, energy, and food management help?
- Fracking uses water in the process, but also generates more water than it uses because of recovered formation water, how do you think these factors balance out?
Food Energy Nexus
Food Energy Nexus
This is a unique relationship. We can imagine that it takes energy to provide food. Whether it is fuel for farm equipment, electricity for food processing facilities or the transport, storage, and sale of food, energy is present in the entire life cycle of food production, as it is in nearly all other manufacturing sectors. Food also has additional nuances around energy needs, such as the nexus of water and energy in regard to irrigation. Agriculture consumes approximately 61% of freshwater used in the world, and much of this water use takes energy, such as for irrigation and treatment.
With the advent of biofuels as part of the renewable energy transition, energy and food come together again in a different way. The use of a traditional food source for fuel production is a key debate in regard to corn for ethanol. This competition for corn between the fuel sector and the food sector is one of the more contentious aspects of the food-energy nexus.
Required Reading
Visit the United Nations UN Water website tab [110] on the water-energy-food nexus. This is a short but insightful overview of the competing issues.
Questions to guide your reading:
- What are the changing conditions in the world that are affecting the food-energy-water nexus?
- What do you think the UN deems to be the important issue? Food, water, or energy?
- What kind of general suggestions do they propose to reconcile the competing priorities?
Lesson 12 Infographic
Lesson 12 Assignment
Purpose of this infographic:
To successfully complete this assignment, you will create an infographic that illustrates either how water and energy relate, or how food and energy relate.
Communicating Visually:
To pull together the concepts learned in this lesson, develop an infographic that illustrates either how water and energy relate, or how food and energy relate. In your illustration, show sources of energy, how it is used by the water or food sectors, and how those sectors in turn support energy generation. Include the results of your water footprint calculator. Illustrate or note how your footprint relates to the concepts in the Infographic. Note points where innovation can help address a conflict.
Successfully completing this assignment:
If you haven’t done so already, review the foundational information on creating infographics. You can view those resources through the links provided in the Orientation Module in Canvas. The rubric used for grading this assignment can be found on the Infographic Activity webpage as well as the Infographic Drop Box for Lesson 1 on Canvas.
Infographic Information Video
13: Climate and Water
Overview
Overview
In the previous lesson we explored the interconnected and interdependent nature of energy, water and food. We learned about how our lifestyle decisions regarding energy and food impact our overall water footprint. We also touched on how water is needed for energy production and energy is needed to extract, clean and distribute drinking water. In this lesson, we will explore in more detail how water-related impacts of climate change will affect the energy transition. As our freshwater resources face greater challenges as the result of climate change (not enough water when we need it, too much when we don’t, or water of poor quality), policy makers will need to balance the trade-offs between cleaner energy provision, expanding water services to the developing world, greenhouse gas emissions and sustainable supplies of freshwater. While the transition to EVs, in particular, will help address one aspect of our climate crisis, it may inadvertently place undue stress on our dwindling readily available freshwater supplies. Systems thinking is a concept that will help policy makers and other decision makers work through the complexities of these trade-offs in the face of climate change.
Learning Outcomes
Upon completion of this lesson, you will be able to:
- Identify the connection between climate change and increasing incidence of stress to global freshwater supplies
- Compare and contrast how the four attributes of energy provision (accessibility, reliability, security, and sustainability) relate to easy access to freshwater supplies
- Describe potential trade-offs between cleaner energy provision, provision of water and wastewater services and climate goals
Lesson Roadmap
| Read | Lesson 13 content and all assigned readings |
|---|---|
| Participate | Graded Discussion |
| Complete | Briefing Memo |
Questions?
If you have questions, please feel free to post them to the Questions about EGEE 401 Discussion forum in Canvas. While you are there, feel free to post your own responses if you, too, are able to help a classmate.
Climate Change and Water
It has been said that “if climate change is a shark, then water is its teeth.” In other words, how most of us will feel the impacts of a changing climate will occur through our relationship with water. Due to the warming of the atmosphere caused by manmade greenhouse gas (GHG) emissions since the industrial revolution, more water vapor is now held. According to NASA, that water vapor then amplifies the effects of climate change leading to more frequent and intense, water-related events such as floods, droughts and extreme storms.
Perhaps the most immediate threat to water availability from climate change is the impact of drought, both in areas historically prone to it and in new locations where extreme weather events are suddenly occurring with more frequency. According to the UN, approximately 2 billion people today do not have safe access to drinking water and by 2030 global freshwater demand will exceed supply by 40% (according to the World Economic Forum). Complicating the picture further is that studies estimate that nearly 80% of wastewater is returned to the environment untreated.
While we briefly touched on the energy-water nexus in the previous lesson, let’s now build on that initial understanding. When it comes to our drinking water, the monthly bill we pay is almost entirely a reflection of the amount of embedded energy per gallon of water. Extracting water from surface or groundwater supplies requires energy (pumps, wells, distribution system); cleaning water to potable standards requires energy (turbines for removing impurities, reverse osmosis); and then finally distributing clean drinking water to residents requires energy (pumping water through a municipal system).
On the wastewater side of the equation, significant energy resources are needed to clean wastewater before it is released into the environment; and wastewater utilities emit significant amounts of methane from anaerobic digesters that help breakdown organic matter in waste. In fact, the World Economic Forum estimates that water and wastewater utilities account for 5% of GHG emissions globally; but additional research estimates that could increase to 10% as the global gap on providing sanitation services narrows (World Economic Forum: How tackling wastewater can help corporations achieve climate goals [111]).
Thus, in order to meet the drinking water and wastewater demands of a growing population globally where freshwater resources are under greater stress (UN SDG 6), more water utilities will need to be built, requiring more energy resources and resulting in GHG emissions that could possibly work at odds with global efforts to reduce such emissions (UN SDG 7). From the water footprint exercise in Lesson 12, we learned first-hand how our lifestyle choices can impact our water footprint. As the availability of freshwater supplies is stressed, and in some cases locally threatened, this will place pressure in those regions or sectors that rely on water resources like the energy sector and the food and beverage sector.
Required Reading
This NASA article explains “Steamy Relationships: How Atmospheric Water Vapor Amplifies Earth's Greenhouse Effect [112].”
This United Nations site details the significance of “Water- at the center of the climate crisis. [113]”
This United Nations site focuses our attention on the 17 Sustainable Development Goals [2].
Reading Guiding Questions:
- Refamiliarize yourself with the SDGs. What other possible trade-offs do you see besides issues related to the energy-water nexus in the face of climate change?
- Are “win-win” strategies, policies, technologies available to help mitigate against trade-offs that disproportionately impact lesser developed countries?
Reference:
World Economic Forum. How tackling wastewater can help corporations achieve climate goals. Retrieved Dec. 8, 2023 from https://www.weforum.org/agenda/2022/10/wastewater-corporations-climate-g... [114]..
System Thinking and Climate Change
The energy transition within the overall context of sustainable development would benefit strategically if policy makers and other decision makers regularly employed systems thinking. The UN has defined systems thinking within the context of meeting the SDGs and is particularly instructive to our short discussion on potential energy transition water-related impacts:
System Thinking is a way of approaching complex issues by acknowledging them as an interlinked network of subsystems and elements…Taking a Systems Thinking approach in implementing the 2030 Agenda for Sustainable Development allows practitioners to visualize how improvement in one area of the system can either positively or adversely affect another area of the system, and how to turn trade-offs into opportunities for the benefit of the entire system while reducing the possibility of producing unintended responses and consequences. The systems framework allows policymakers and stakeholders to shift from a conventional, siloed and linear policy and decision-making approach towards integrated planning scenarios (UN ESCAP: System Thinking [115]).
Reducing GHG emissions and decarbonizing aspects of the global economy is a priority to ensure we meet global climate goals and reduce the negative climatic impacts on future generations and the environment. Applying systems thinking can help us understand how different policy outcomes we seek can impact other parts of the system (energy accessibility vs. sustainability), or how that system can then interact and change directions vis-à-vis other systems (energy provision vs. clean water). Before this gets too esoteric, let’s apply systems thinking to better understanding potential water-related impacts of the energy transition.
One aspect of the energy transition that could (and in some cases already is) have a negative impact on water outcomes and is still being studied and assessed, is the move to electric vehicles (EVs). As we learned from using Energy Outlooks earlier in the semester, ICE vehicles will still be dominant in the marketplace for some years to come. That being said, all US automotive manufacturers are producing EVs and several, including Ford and GM, have committed to moving toward an all EV fleet. That means the very nature of the automotive supply chain will change and adjust to source the materials that are unique to EV manufacture (i.e., the need for lithium ion batteries). For instance, as the automotive industry transitions to EV production, McKinsey & Co. predict a nearly 30% annual growth rate for lithium-ion batteries between now and 2030 (McKinsey & Company, Battery 2030: Resilient, sustainable, and circular [116]). Further, the IEA estimates that over 50% of lithium production is concentrated in areas of high water stress in countries like Argentina, Bolivia and Chile (IEA, Reducing the impact of extractive industries on groundwater resources [117]). With recent discoveries of extensive lithium reserves in the US, threats to groundwater and wetlands as a result of the extraction process could have significant negative impacts on local communities and drinking water sources. More study is needed on the water impacts within the EV metals supply chain (including nickel and cobalt). Similarly, assessing the renewable energy supply chain for water-related impacts is still in the earliest stages. And while moving away from fossil fuel extraction and use will certainly have an overall positive impact on water resources, metals and mineral extraction associated with components for wind and solar manufacturing may still have extreme local impacts in areas already facing water stress.
Required Reading
This IEA article focuses our attention on the need for “Reducing the impact of extractive industries on groundwater resources [117].”
This S&P article explains how “CO2 reduction meets water-use tension in (the) hunt for lithium [118].” Additionally it provides detailed, related maps depicting the conundrum we face.
A Nature Conservancy PDF titled “Lithium: a key element in the clean energy transition [119]” illustrates how lithium is extracted and suggestions for reducing environmental impacts from the extraction process.
Reading guiding questions:
- There will be water impacts from increased EV production. How can policy-makers mitigate these potential impacts?
- Given that localized negative water impacts will occur, is that an acceptable trade-off to achieve global improvements to reduce GHG emissions?
Lesson 13 assignment
Briefing Memo Exercise
Overview:
In this lesson we explored more deeply the energy-water nexus as well as water impacts from climate change and how that could play out during the energy transition. In this assignment, you will draft a briefing memo discussing possible trade-offs between water and climate goals as the energy transition progresses.
Purpose:
This assignment will help you apply systems thinking by practicing synthesizing your knowledge and presenting a concise written summary of key trade-offs and potential outcomes relating to the energy transition’s water-related impacts.
Successful Completion:
For this lesson’s assignment, imagine you are an expert providing direct consultation to the UN secretariat for the SDGs about potential negative impacts on freshwater resources as a result of some aspect of the energy transition covered in this lesson. In 250 words or less (plus or minus 10% on word count), you are to outline the issue (e.g., GHG emissions impacts from building new wastewater treatment plants); identify the relevant UN SDG goal(s) associated with the issue; and then describe in some detail using bulleted points as needed the potential pros and cons of your policy choice with regard to freshwater resources and on global GHG emissions trends (e.g., recommendation to build significantly more wastewater treatment facilities). When describing the water impacts be sure to reference at least two of the four factors of energy provision.
Creating Infographics
Some weeks, you will be expected to review the online content and create an infographic to synthesize your online readings and one external source of your choosing. But first, you should review the information on this page which will explain what infographics are, describe several designs that can be used, and list several technologies for creating them.
What Is An Infographic?
Infographics are an alternate way of communicating ideas, concepts, data, and more. By creating visually interesting images, you will be able to more effectively share and remember the information presented within the image. Please review the following video to learn more about the qualities commonly included in infographics.
What makes an effective infographic (2:13)
PRESENTER: Do you know what it takes to create a unique and engaging infographic? Striking colors? Neat typography? Sensational headlines?
There are so many roads that your infographic could go down. At its core, an infographic is supposed to be a quick and easy way of conveying information to your audience. It should visually appeal to the audience, convey essential data, build awareness, and maybe even generate leads if you're using infographics for business purposes.
So what makes an infographic effective? Number one, informational honesty. We live in an internet age where fact-checking is easier than ever, so be sure that all the information in your infographic is truthful and honest. If you provide figures from somewhere else, back up these figures by asterisking your sources.
Number two, legibility. Although it's tempting to whip out the calligraphy style fonts in an effort to look fancy, you should prioritize fonts which are simple and easy to read. Also, avoid making your infographic too busy, keeping the style on the minimalist side.
Number three, simple illustrations. Make your illustrations simple and ensure that they complement the data being conveyed in the infographic. Complex illustrations will distract your audience from what's important, your message. You're trying to communicate information, not replace Rembrandt.
Number four, limited colors. Limit your color palette if you're trying to create an infographic which is visually appealing. As a general rule of thumb, use three main colors with the lightest color forming the background and the darker two colors breaking up different sections. Too many clashing colors will give your audience a headache.
Number five, interactive elements. Although adding interactive elements to your infographic is appealing, consider whether it is relevant to what you're trying to achieve. If you need to convey a lot of information about different subjects, interactivity could be the easiest way to spread out this information without having to make your font tiny.
And there you have it. Go forth, and spread your message with your fancy new infographic.
Types of Infographics
As you can see, creating an effective infographic is a bit more complicated than simply putting facts and images together. The information must also be efficiently organized and will also demonstrate the connections between important concepts or ideas. There are several ways in which you can organize your content. Please watch the following video to learn several strategies for organizing and presenting your information.
Ten Types of Infographics (3:50)
PRESENTER: So you have your idea, you've done your research, and you've collected your data. Now you're probably wondering what type of infographic format would best represent and communicate your information effectively. There are many different types of infographics. And sometimes a combination of these types is used in a single infographic. So as you plan your infographic design, consider these 10 types of infographics.
Number one, a visual article infographic makes a piece of writing more visual. It is best used to cut down on text or make an article more interesting and enjoyable to consume. It also increases sharing potential through social networks.
Number two, the list-based infographic supports a claim through a series of steps. It is best used to support a specific claim or argument. Your list can go from top to bottom, left to right, or it can even move across your page.
Number three, a map infographic showcases data trends based on location. It is best used to compare places or cultures with setting-centric data or demographics.
Number four, the comparison, or versus infographic compares two things in a head-to-head study. It is best used to highlight differences between two similar things or highlight similarities between two unlike things. It can also be used to prove how one option is superior or inferior to the other option.
Number five, the flowchart infographic offers specific answers to a question via reader choices. It is best used to provide personalized solutions for readers or show how multiple situations can reach the same conclusion.
Number six, a data visualization infographic communicates complex data through charts and graphs. It can even showcase data through design. It is best used to make data driven arguments easier to understand and make facts or statistics more enjoyable to absorb.
Number seven, the timeline infographic tells a story through a chronological flow. It is best used to show how something has changed over time or make a long, complicated story easier to understand. It can also show how one thing leads to another.
Number eight, a visual resume turns text-based resumes into stunning visuals. It is best used to help job candidates get noticed during the recruitment process. It also helps candidates stand out in non-traditional industries or positions that are looking for creative and out-of-the-box thinking.
Number nine, a process infographic helps explain a series of steps or actions to complete a task. It is best used to simplify a complex process, or to break down each step with information that is easy to digest.
Number 10, an animated infographic adds motion to complex information and ideas. It is best used to capture and hold your viewer's attention. It can also direct the attention where you want it.
Now that you're familiar with these 10 types of infographics and when to use them, it's easy to choose a format that works for your content. So grab your information and data because you're ready to organize it visually.
Technologies for creating infographics:
Now that you know the core elements of infographics, you may be wondering how to actually get started. There are a number of software applications that will help you quickly and easily create an infographic. Many of them also have free tutorials available on youtube. You can start by looking at the applications listed below. Feel free to experiment and try different ones until you find one that works well for you. A personal favorite happens to be Canva. It offers predesigned templates that can quickly be customized with additional text, graphics, and more.
Adobe Spark [120] is part of Adobe's Creative Cloud Suite. It allows you to create a variety of graphic based resources. As a registered Penn State student, you have free access to this software.
Canva [121] also offers free accounts to help you quickly and easily create infographics, presentation slides, brochures, and many other items. It has a simple and easy-to-use interface and each item you create is downloadable to a PDF format. *Please note: Canva offers graphics and other elements for an additional fee. You are not expected to purchase anything in order to create your infographics. Doing so is at your own discretion.
Overview
Goal:
The goal of this assignment is to synthesize the required readings provided in Canvas with at least one external resource through the creation of an infographic. Doing so provides you with practice in synthesizing information and communicating it in a concise format.
Purpose:
The purpose of this assignment is to allow you to think critically about the key points from the online readings and how they apply or relate to how energy is used in our world today. By applying the course concepts to energy consumption, energy policy, or environmental considerations you will have a strengthened understanding of how our choices impact our world.
Enhanced Learning:
According to the research, we remember information in images rather than text. By creating an infographic based on the course readings, you are essentially creating visual organizers of course information in a format more easily remembered by your brain.
Creating Infographics
Step 1: Getting Started
The best way to begin working on your infographic is to start by reviewing the assigned online readings. As you work your way through the lesson, pause to write down key points you feel are especially important. (You may also find it beneficial to create a quick drawing or sketch to visually support your learning and retention of the information. This process is called sketchnoting. You can watch this Youtube video which provides a quick overview of sketchnoting if you would like to employ that method as part of your note-taking process.)
PRESENTER: Welcome to "Sketcho Frenzy." In this video, I'm going to talk about the basics of visual note-taking. So first things first, why visual note-taking? Well, it enhances your memory and retention of information mostly because you now have access to multiple cues, which will help you remember what you need to know.
Visual note-taking improves your understanding of the lessons you're supposed to learn because you're not just jotting down what the teacher or the books say, but you're exercising your brain by connecting the verbal material to the visual material. And of course, it's way more fun compared to boring old text-filled notebooks.
There are three things you need to remember when you're doing visual note-taking. There's text, images, and structure. Text and visual note-taking is important because it's not merely writing the usual way one does. It's writing while making use of one's knowledge and hierarchy and distinction.
This means that when you write or doodle the words, you highlight the more important terms, so it'll be easier for you to identify the main point from the supporting details. Text can also be used as a form of visual mnemonics, which is the treatment of words as images.
This helps you understand and remember difficult terms better. And it also helps you filter out the unimportant details and places more emphasis on the words you actually need to know. Plus, this translates everything into a language you actually speak, since you call the shots with how these terms will look on your notebook.
Images are important because turning words into pictures involves translating terms into recognizable forms, from purely linguistic concepts and descriptions to objects one can actually see. Think of it this way. A picture's worth a thousand words. And if you can save up on ink and paper by drawing just one doodle instead of writing a five-paragraph description, then why not stick to visual note-taking?
Structure gives your notes direction and organizes the flow and relationships of the concepts and lessons you're trying to learn. Structures can be in the form of charts, graphs, or maps. They don't just organize your thoughts, but they can also help you spot trends, illustrate patterns. And they let you see a natural picture of the data you need to examine.
But instead of doing the usual boring way of making them, you can also incorporate what's been said about images and texts. This doesn't just increase the visual appeal of your notes, but this process of relating words to images and pictures and words to an overall structure improves your understanding and knowledge of the lesson.
It makes things less complicated for you because you can do things your way and turn the teacher's and the textbook's words into structures and images that make much more sense to you. That's all for the basics. And I hope you learned something new in this video.
Step 2: Conducting Independent Research
Once you have completed the online chapter, you will need to conduct your own investigation on a topic relating to the information discussed within the online lesson. Use the online readings as a starting point. You may consider the following questions to help you begin your independent research:
- Is there something you found interesting in the assigned readings and want to learn more about?
- Is there a point on which you wish to gain further clarity?
- Are you interested in seeing how the statistics may have changed over your lifetime? (example: comparing the data from today to the year you were born?)
After you have found at least one suitable article, follow the same process of note-taking/documenting that you implemented when you reviewed the online readings. You may review as many articles as you wish to further your understanding of the topic, but you are required to submit an infographic that includes a reference to a minimum of one external source.
Step 3: Synthesize Key Points
In reviewing your notes/sketches, find the points you feel are the most important and want to ensure you remember beyond this semester. The infographics should be more than simply recapping the online readings. These points will likely be the most interesting or thought-provoking aspects of the various articles and readings you reviewed.
Distill those key points down to approximately 10 (plus or minus a few is perfectly acceptable). This will help you narrow your focus on the points you want to convey in your infographic. Following this strategy will also give you the ability to quickly identify connections between the course readings and other sources of information. Your submissions must include a connection between the course content and another source.
Step 4: Create your infographic
Review the page titled Creating Infographics to determine which layout, color scheme, and graphics are suitable for the information you wish to convey. All of these elements should work together to effectively communicate a message in a clear and concise manner.
*Please remember there are templates available in both Adobe Spark and in Canva.
A few additional considerations:
Getting Creative:
This assignment was designed to maximize your engagement with the materials in order to help facilitate long term retention. It offers a more creative option and greater value over a traditional multiple-choice quiz. With that in mind, you should explore your creative freedom while working on these infographics. All graphics included in the work should be original. In general, a maximum of one screenshot from an external source may be used (see 90/10 rule below), but the use of that image must adhere to the guidelines of academic integrity. (Meaning you must use a graphic that is in the public domain or be able to provide documentation indicating you have permission from the original creator to use the artwork.)
Academic Integrity:
As the infographic assignment is a creative project, your work should be a personalized reflection of your learning in this course. Since you are expected to be using information from other sources, you will need to cite these sources. Plagiarism (using someone else's ideas or words without giving them credit for their work) will not be tolerated in this course. There is a module in this course titled Academic Integrity. If you are unsure of how to cite works properly or even what it means to plagiarize someone else's work, you will find detailed information within that module.
*An additional note on plagiarism – Submitting a work that is comprised entirely of images, text, or other media which has been created by someone else is also considered plagiarism. In order for a submission to be considered an original work, it must follow a 90/10 rule. Meaning 90% of the work must be words and graphics of your own creation. 10% of the overall work may be a screenshot or quote from an external source.
| Criteria | Descriptors |
|---|---|
|
Accuracy & Communications |
|
| Reflection |
|
| Authenticity |
|
| Design |
|
| Citations |
|
Infographic Example
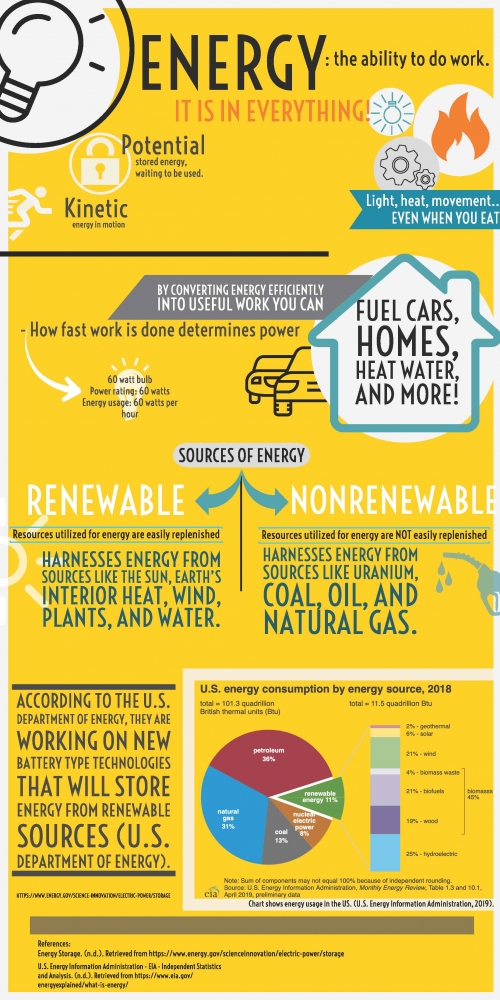
Energy: the ability to do work. It is in everything!
Potential: stored energy, waiting to be used.
Kinetic: energy in motion - light, heat, movement… even when you eat. How fast work is done determines power. By converting energy efficiently into useful work you can fuel cars, homes, heat water, and more!
- 60 watt bulb
- Power rating: 60 watts
- Energy usage: 60 watts per hour
Sources of Energy
Renewable: Resources utilized for energy are easily replenished Harnesses energy from sources like the sun, earth’s interior heat, wind, plants, and water.
Non-Renewable: Resources utilized for energy are NOT easily replenished. Harnesses energy from sources like uranium, coal, oil, and natural gas.
According to the U.S. Department of Energy, they are working on new battery type technologies that will store energy from renewable sources (U.S. Department of Energy). U.S. energy consumption by energy source, 2018.
Chart shows energy usage in the U.S. (U.S. Energy Information Administration, 2019).
Total = 101.3 quadrillion British thermal units (Btu)
- Petroleum 36%
- Natural gas 31%
- Coal 13%
- Nuclear electric power 8%
- Renewable energy 11%
Renewable energy total =11.5 quadrillion Btu
- Geothermal 2%
- Solar 6%
- Wind 21%
- Biomass waste 4% (biomasses total 45% - waste, biofuels, wood)
- Biofuels 21%
- Wood 19%
- Hydroelectric 25%
References:
Energy Storage, (n.d.). Retrieved from https://energy.gov/ [122] scienceinnovation/electric-power/storage
U.S. Energy Information Administration - EIA - Independent Statistics and Analysis (a.d.). Retrieved from https://www.eia.gov/energyexplained/what-is-energy/ [123]
...Infographic Example 2
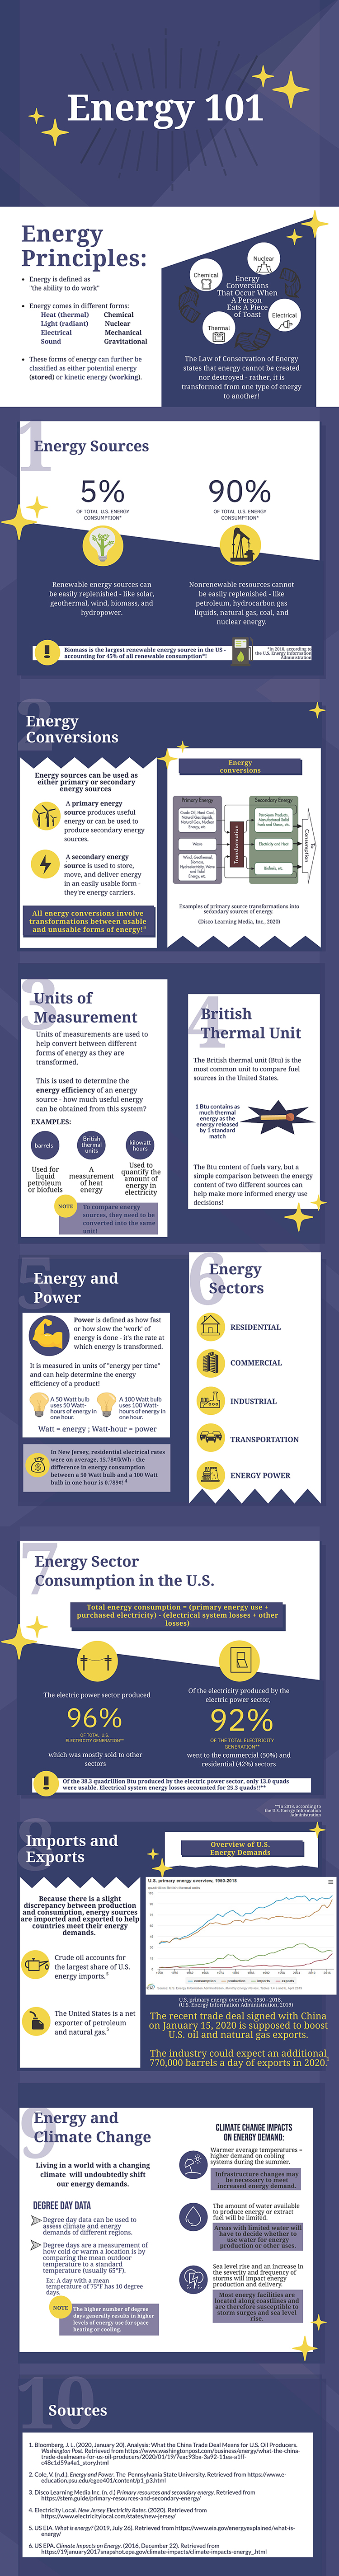
Energy 101
Energy Principles: Energy is defined as “the ability to do work”
Energy comes in different forms:
- Heat (thermal)
- Light (radiant)
- Electrical
- Sound
- Chemical
- Nuclear
- Mechanical
- Gravitational
These forms of energy can further be classified as either potential energy (stored) or kinetic energy (working).
Energy conversions that occur when a person eats a piece of toast.
- Chemical
- Nuclear
- Electrical
- Thermal
The law of Conservation of Energy states that energy cannot be created more destroyed - rather, it is transformed from one type of energy to another!
Energy Sources
5% of total U.S. energy consumption: renewable energy sources can be easily replenished - like solar, geothermal, wind, biomass, and hydropower.
90% of total U.S. energy consumption: Nonrenewable resources cannot be easily replenished - like petroleum, hydrocarbon gas liquids, natural gas, coal, and nuclear energy.
Biomass is the largest renewable energy source in the US - accounting for 45% of all renewable consumption! In 2018, according to the U.S. Energy Information Administration. Energy Conversions Energy sources can be used as either primary or secondary energy sources. A primary energy source produces useful energy or can be used to produce secondary energy sources. A secondary energy source is used to store, more, and deliver energy in an easily useable form - they are energy carriers. All energy conversions involve transformations between usable and unusable forms of energy!
Energy conversions...
Primary energy
- Crude Oil, hard coal, natural gas liquids, natural gas, nuclear energy, etc.
- Waste.
- Wind, geothermal, biomass, hydroelectricity, wave, and total energy, etc.
Transformation
Secondary Energy
- Petroleum projects, manufactured solid fuel and gases, etc.
- Electricity and heat.
- Biofuels, etc.
...To Consumptions
Examples of primary source transformation into secondary sources of energy (Disco Learning Media, Inc., 2020). Units of Measurement Units of measurements are used to help convert between different forms of energy as they are transformed. This is used to determine the energy efficiency of an energy source - how much useful energy can be obtained from this system? Examples: Barrels - used for liquid petroleum or biofuels British thermal units - a measurement of heat energy Kilowatt hours - used to quantify the amount of energy in electricity Note: To compare energy sources, they need to be converted into the same unit! British Thermal Unit The British thermal unit (Btu) is the most common unit to compare fuel sources in the United States. 1 Btu contains as much thermal energy as the energy released by 1 standard match. The Btu content of fuels vary, but a simple comparison between the energy content of two different sources can help make more informed energy use decisions!
Energy and Power Power is defined as how fast or how slow the ‘work’ of energy is done - it’s the rate at which energy is transformed. It is measured in units of “energy per time” and can help determine the energy efficiency of a product! A 50 Watt bulb uses 50 Watt-hours of energy in one hour. A 100 Watt bulb uses 100 Watt-hours of energy in one hour. Watt = energy; Watt-hour = power. In New Jersey, residential electrical rates were on average, 15.78 cents/kWh - the difference in energy consumption between a 50 Watt bulb and a 100 Watt bulb in one hour is 0.789 cents!
Energy Sectors
- Residential
- Commercial
- Industrial
- Transportation
- Energy Power
Energy Sector Consumption in the U.S. Total energy consumption - (primary energy use + purchased electricity) - (electrical system losses + other losses) The electric power sector produced 96% of total U.S. electricity generation**, which was mostly sold to other sectors. Of the electricity produced by the electric power sector, 92% of the total electricity generation** went to the commercial (50%) and residential (42%) sectors. Of the 38.3 quadrillion Btu produced by the electric power sector, only 13.0 quads were useable. Electrical system energy losses accounted for 25.3 quads!! **(In 2018, according to the U.S. Energy Information Administration).
Overview of U.S. Energy Demands Imports and Exports
Because there is a slight discrepancy between production and consumption, energy sources are imported and exported to help countries meet their energy demands. Crude oil accounts for the largest share of U.S. energy imports. The United States is a net exported of petroleum and natural gas. The recent trade deal signed with China on January 15, 2020 is supposed to boost U.S. oil and natural gas exports. The industry could expect an additional 770,000 barrels a day of exports in 2020.
Energy and Climate Change
Living in a world with a changing climate will undoubtedly shift our energy demands.
Degree Day Data
Degree day data can be used to assess climate and energy demands of different regions. Degree days are a measurement of how cold or warm a location is by comparing the mean outdoor temperature to a standard temperature (usually 65 degree F). Ex: A day with a mean temperature of 75 degree F has 10 degree days. Note: The higher number of degree days generally results in higher levels of energy use for space heating or cooling.
Climate Change Impacts on Energy Demand:
Warmer average temperatures = higher demand on cooling systems during the summer. Infrastructure changes may be necessary to meet increased energy of demand. The amount of water available to produce energy or extract fuel will be limited. Areas with limited water will have to decide whether to use water for energy production or other uses. Sea level rise and an increase in the severity and frequency of storms will impact energy production and delivery. Most energy facilities are located along coastlines and are therefore susceptible to storm surges and sea level rise.
Sources:
Bloomberg, J.L. (2020, January 20). Analysis: What the China Trade Deal Means for U.S. Oil Producers, Washington Post. Retrieved from https://www.washingtonpost.com/business/energy/what-the-china-trade-deal... [124]
Cole, V. (n.d.). Energy and Power. The Pennsylvania State University. Disco Learning Media Inc. (n.d.) Primary resources and secondary energy. Retrieved from https://www.electricitylocal.com/states/new-jersey/ [125] US EIA.
What is energy? (2019, July 26). Retrieved from https://www.eia.gov/energy [126] explained/what-is-energy/ US EPA.
Climate Impacts on Energy. (2016, December 22). Retrieved from https://19january2017snapshot.epa.gov/climate-impacts/climate-impacts-en... [127]