Creating Infographics
Some weeks, you will be expected to review the online content and create an infographic to synthesize your online readings and one external source of your choosing. But first, you should review the information on this page which will explain what infographics are, describe several designs that can be used, and list several technologies for creating them.
What Is An Infographic?
Infographics are an alternate way of communicating ideas, concepts, data, and more. By creating visually interesting images, you will be able to more effectively share and remember the information presented within the image. Please review the following video to learn more about the qualities commonly included in infographics.
What makes an effective infographic (2:13)
PRESENTER: Do you know what it takes to create a unique and engaging infographic? Striking colors? Neat typography? Sensational headlines?
There are so many roads that your infographic could go down. At its core, an infographic is supposed to be a quick and easy way of conveying information to your audience. It should visually appeal to the audience, convey essential data, build awareness, and maybe even generate leads if you're using infographics for business purposes.
So what makes an infographic effective? Number one, informational honesty. We live in an internet age where fact-checking is easier than ever, so be sure that all the information in your infographic is truthful and honest. If you provide figures from somewhere else, back up these figures by asterisking your sources.
Number two, legibility. Although it's tempting to whip out the calligraphy style fonts in an effort to look fancy, you should prioritize fonts which are simple and easy to read. Also, avoid making your infographic too busy, keeping the style on the minimalist side.
Number three, simple illustrations. Make your illustrations simple and ensure that they complement the data being conveyed in the infographic. Complex illustrations will distract your audience from what's important, your message. You're trying to communicate information, not replace Rembrandt.
Number four, limited colors. Limit your color palette if you're trying to create an infographic which is visually appealing. As a general rule of thumb, use three main colors with the lightest color forming the background and the darker two colors breaking up different sections. Too many clashing colors will give your audience a headache.
Number five, interactive elements. Although adding interactive elements to your infographic is appealing, consider whether it is relevant to what you're trying to achieve. If you need to convey a lot of information about different subjects, interactivity could be the easiest way to spread out this information without having to make your font tiny.
And there you have it. Go forth, and spread your message with your fancy new infographic.
Types of Infographics
As you can see, creating an effective infographic is a bit more complicated than simply putting facts and images together. The information must also be efficiently organized and will also demonstrate the connections between important concepts or ideas. There are several ways in which you can organize your content. Please watch the following video to learn several strategies for organizing and presenting your information.
Ten Types of Infographics (3:50)
PRESENTER: So you have your idea, you've done your research, and you've collected your data. Now you're probably wondering what type of infographic format would best represent and communicate your information effectively. There are many different types of infographics. And sometimes a combination of these types is used in a single infographic. So as you plan your infographic design, consider these 10 types of infographics.
Number one, a visual article infographic makes a piece of writing more visual. It is best used to cut down on text or make an article more interesting and enjoyable to consume. It also increases sharing potential through social networks.
Number two, the list-based infographic supports a claim through a series of steps. It is best used to support a specific claim or argument. Your list can go from top to bottom, left to right, or it can even move across your page.
Number three, a map infographic showcases data trends based on location. It is best used to compare places or cultures with setting-centric data or demographics.
Number four, the comparison, or versus infographic compares two things in a head-to-head study. It is best used to highlight differences between two similar things or highlight similarities between two unlike things. It can also be used to prove how one option is superior or inferior to the other option.
Number five, the flowchart infographic offers specific answers to a question via reader choices. It is best used to provide personalized solutions for readers or show how multiple situations can reach the same conclusion.
Number six, a data visualization infographic communicates complex data through charts and graphs. It can even showcase data through design. It is best used to make data driven arguments easier to understand and make facts or statistics more enjoyable to absorb.
Number seven, the timeline infographic tells a story through a chronological flow. It is best used to show how something has changed over time or make a long, complicated story easier to understand. It can also show how one thing leads to another.
Number eight, a visual resume turns text-based resumes into stunning visuals. It is best used to help job candidates get noticed during the recruitment process. It also helps candidates stand out in non-traditional industries or positions that are looking for creative and out-of-the-box thinking.
Number nine, a process infographic helps explain a series of steps or actions to complete a task. It is best used to simplify a complex process, or to break down each step with information that is easy to digest.
Number 10, an animated infographic adds motion to complex information and ideas. It is best used to capture and hold your viewer's attention. It can also direct the attention where you want it.
Now that you're familiar with these 10 types of infographics and when to use them, it's easy to choose a format that works for your content. So grab your information and data because you're ready to organize it visually.
Technologies for creating infographics:
Now that you know the core elements of infographics, you may be wondering how to actually get started. There are a number of software applications that will help you quickly and easily create an infographic. Many of them also have free tutorials available on youtube. You can start by looking at the applications listed below. Feel free to experiment and try different ones until you find one that works well for you. A personal favorite happens to be Canva. It offers predesigned templates that can quickly be customized with additional text, graphics, and more.
Adobe Spark [1] is part of Adobe's Creative Cloud Suite. It allows you to create a variety of graphic based resources. As a registered Penn State student, you have free access to this software.
Canva [2] also offers free accounts to help you quickly and easily create infographics, presentation slides, brochures, and many other items. It has a simple and easy-to-use interface and each item you create is downloadable to a PDF format. *Please note: Canva offers graphics and other elements for an additional fee. You are not expected to purchase anything in order to create your infographics. Doing so is at your own discretion.
Overview
Goal:
The goal of this assignment is to synthesize the required readings provided in Canvas with at least one external resource through the creation of an infographic. Doing so provides you with practice in synthesizing information and communicating it in a concise format.
Purpose:
The purpose of this assignment is to allow you to think critically about the key points from the online readings and how they apply or relate to how energy is used in our world today. By applying the course concepts to energy consumption, energy policy, or environmental considerations you will have a strengthened understanding of how our choices impact our world.
Enhanced Learning:
According to the research, we remember information in images rather than text. By creating an infographic based on the course readings, you are essentially creating visual organizers of course information in a format more easily remembered by your brain.
Creating Infographics
Step 1: Getting Started
The best way to begin working on your infographic is to start by reviewing the assigned online readings. As you work your way through the lesson, pause to write down key points you feel are especially important. (You may also find it beneficial to create a quick drawing or sketch to visually support your learning and retention of the information. This process is called sketchnoting. You can watch this Youtube video which provides a quick overview of sketchnoting if you would like to employ that method as part of your note-taking process.)
PRESENTER: Welcome to "Sketcho Frenzy." In this video, I'm going to talk about the basics of visual note-taking. So first things first, why visual note-taking? Well, it enhances your memory and retention of information mostly because you now have access to multiple cues, which will help you remember what you need to know.
Visual note-taking improves your understanding of the lessons you're supposed to learn because you're not just jotting down what the teacher or the books say, but you're exercising your brain by connecting the verbal material to the visual material. And of course, it's way more fun compared to boring old text-filled notebooks.
There are three things you need to remember when you're doing visual note-taking. There's text, images, and structure. Text and visual note-taking is important because it's not merely writing the usual way one does. It's writing while making use of one's knowledge and hierarchy and distinction.
This means that when you write or doodle the words, you highlight the more important terms, so it'll be easier for you to identify the main point from the supporting details. Text can also be used as a form of visual mnemonics, which is the treatment of words as images.
This helps you understand and remember difficult terms better. And it also helps you filter out the unimportant details and places more emphasis on the words you actually need to know. Plus, this translates everything into a language you actually speak, since you call the shots with how these terms will look on your notebook.
Images are important because turning words into pictures involves translating terms into recognizable forms, from purely linguistic concepts and descriptions to objects one can actually see. Think of it this way. A picture's worth a thousand words. And if you can save up on ink and paper by drawing just one doodle instead of writing a five-paragraph description, then why not stick to visual note-taking?
Structure gives your notes direction and organizes the flow and relationships of the concepts and lessons you're trying to learn. Structures can be in the form of charts, graphs, or maps. They don't just organize your thoughts, but they can also help you spot trends, illustrate patterns. And they let you see a natural picture of the data you need to examine.
But instead of doing the usual boring way of making them, you can also incorporate what's been said about images and texts. This doesn't just increase the visual appeal of your notes, but this process of relating words to images and pictures and words to an overall structure improves your understanding and knowledge of the lesson.
It makes things less complicated for you because you can do things your way and turn the teacher's and the textbook's words into structures and images that make much more sense to you. That's all for the basics. And I hope you learned something new in this video.
Step 2: Conducting Independent Research
Once you have completed the online chapter, you will need to conduct your own investigation on a topic relating to the information discussed within the online lesson. Use the online readings as a starting point. You may consider the following questions to help you begin your independent research:
- Is there something you found interesting in the assigned readings and want to learn more about?
- Is there a point on which you wish to gain further clarity?
- Are you interested in seeing how the statistics may have changed over your lifetime? (example: comparing the data from today to the year you were born?)
After you have found at least one suitable article, follow the same process of note-taking/documenting that you implemented when you reviewed the online readings. You may review as many articles as you wish to further your understanding of the topic, but you are required to submit an infographic that includes a reference to a minimum of one external source.
Step 3: Synthesize Key Points
In reviewing your notes/sketches, find the points you feel are the most important and want to ensure you remember beyond this semester. The infographics should be more than simply recapping the online readings. These points will likely be the most interesting or thought-provoking aspects of the various articles and readings you reviewed.
Distill those key points down to approximately 10 (plus or minus a few is perfectly acceptable). This will help you narrow your focus on the points you want to convey in your infographic. Following this strategy will also give you the ability to quickly identify connections between the course readings and other sources of information. Your submissions must include a connection between the course content and another source.
Step 4: Create your infographic
Review the page titled Creating Infographics to determine which layout, color scheme, and graphics are suitable for the information you wish to convey. All of these elements should work together to effectively communicate a message in a clear and concise manner.
*Please remember there are templates available in both Adobe Spark and in Canva.
A few additional considerations:
Getting Creative:
This assignment was designed to maximize your engagement with the materials in order to help facilitate long term retention. It offers a more creative option and greater value over a traditional multiple-choice quiz. With that in mind, you should explore your creative freedom while working on these infographics. All graphics included in the work should be original. In general, a maximum of one screenshot from an external source may be used (see 90/10 rule below), but the use of that image must adhere to the guidelines of academic integrity. (Meaning you must use a graphic that is in the public domain or be able to provide documentation indicating you have permission from the original creator to use the artwork.)
Academic Integrity:
As the infographic assignment is a creative project, your work should be a personalized reflection of your learning in this course. Since you are expected to be using information from other sources, you will need to cite these sources. Plagiarism (using someone else's ideas or words without giving them credit for their work) will not be tolerated in this course. There is a module in this course titled Academic Integrity. If you are unsure of how to cite works properly or even what it means to plagiarize someone else's work, you will find detailed information within that module.
*An additional note on plagiarism – Submitting a work that is comprised entirely of images, text, or other media which has been created by someone else is also considered plagiarism. In order for a submission to be considered an original work, it must follow a 90/10 rule. Meaning 90% of the work must be words and graphics of your own creation. 10% of the overall work may be a screenshot or quote from an external source.
| Criteria | Descriptors |
|---|---|
|
Accuracy & Communications |
|
| Reflection |
|
| Authenticity |
|
| Design |
|
| Citations |
|
Infographic Example
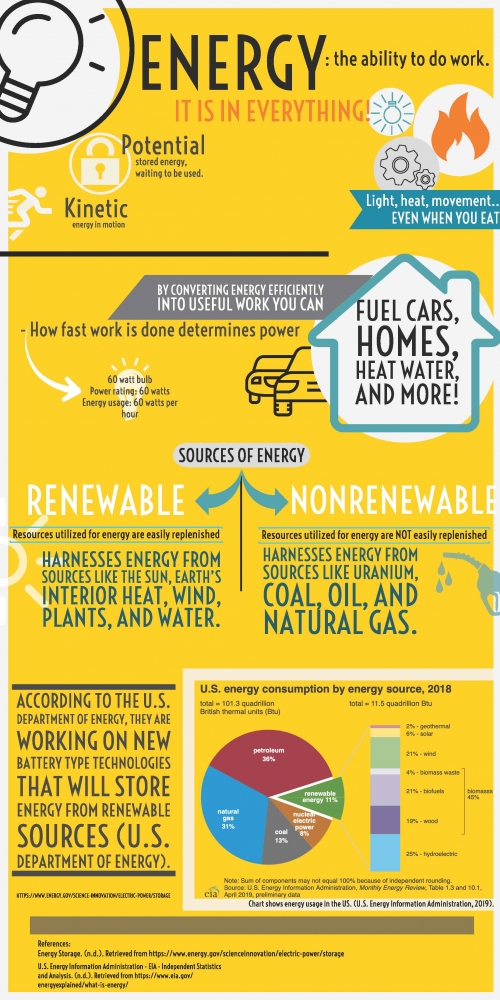
Energy: the ability to do work. It is in everything!
Potential: stored energy, waiting to be used.
Kinetic: energy in motion - light, heat, movement… even when you eat. How fast work is done determines power. By converting energy efficiently into useful work you can fuel cars, homes, heat water, and more!
- 60 watt bulb
- Power rating: 60 watts
- Energy usage: 60 watts per hour
Sources of Energy
Renewable: Resources utilized for energy are easily replenished Harnesses energy from sources like the sun, earth’s interior heat, wind, plants, and water.
Non-Renewable: Resources utilized for energy are NOT easily replenished. Harnesses energy from sources like uranium, coal, oil, and natural gas.
According to the U.S. Department of Energy, they are working on new battery type technologies that will store energy from renewable sources (U.S. Department of Energy). U.S. energy consumption by energy source, 2018.
Chart shows energy usage in the U.S. (U.S. Energy Information Administration, 2019).
Total = 101.3 quadrillion British thermal units (Btu)
- Petroleum 36%
- Natural gas 31%
- Coal 13%
- Nuclear electric power 8%
- Renewable energy 11%
Renewable energy total =11.5 quadrillion Btu
- Geothermal 2%
- Solar 6%
- Wind 21%
- Biomass waste 4% (biomasses total 45% - waste, biofuels, wood)
- Biofuels 21%
- Wood 19%
- Hydroelectric 25%
References:
Energy Storage, (n.d.). Retrieved from https://energy.gov/ [3] scienceinnovation/electric-power/storage
U.S. Energy Information Administration - EIA - Independent Statistics and Analysis (a.d.). Retrieved from https://www.eia.gov/energyexplained/what-is-energy/ [4]
...Infographic Example 2
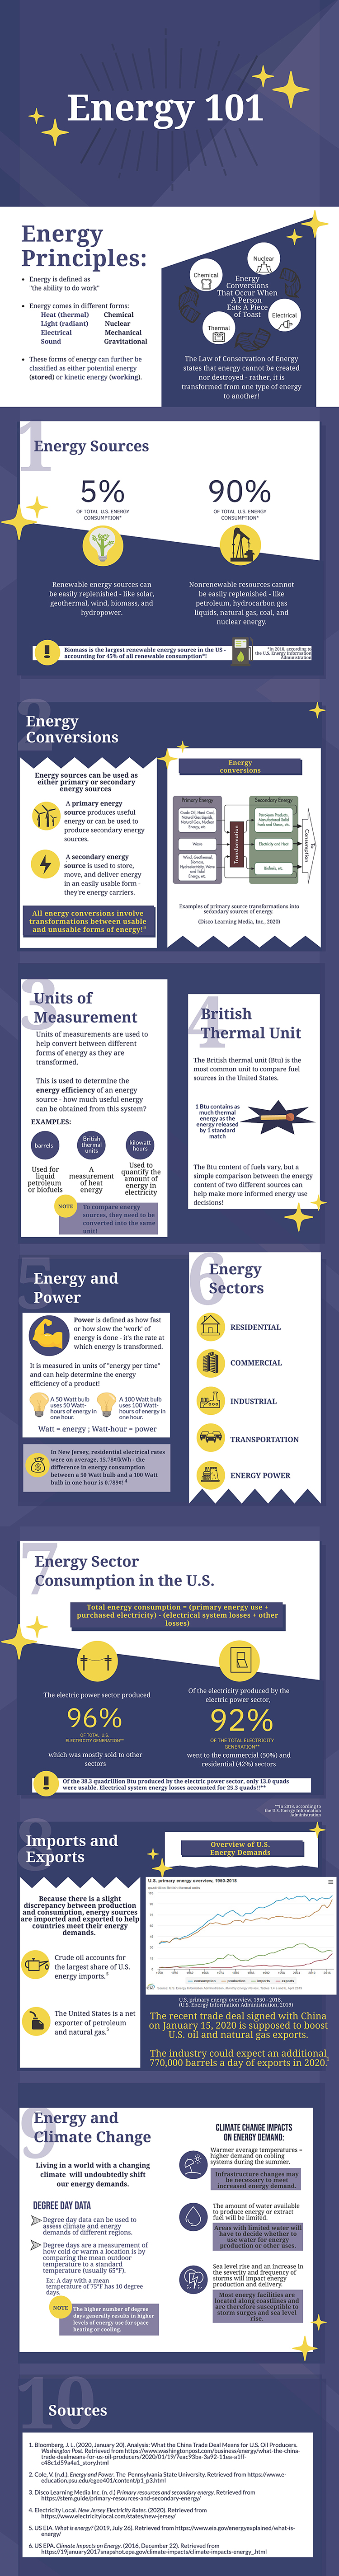
Energy 101
Energy Principles: Energy is defined as “the ability to do work”
Energy comes in different forms:
- Heat (thermal)
- Light (radiant)
- Electrical
- Sound
- Chemical
- Nuclear
- Mechanical
- Gravitational
These forms of energy can further be classified as either potential energy (stored) or kinetic energy (working).
Energy conversions that occur when a person eats a piece of toast.
- Chemical
- Nuclear
- Electrical
- Thermal
The law of Conservation of Energy states that energy cannot be created more destroyed - rather, it is transformed from one type of energy to another!
Energy Sources
5% of total U.S. energy consumption: renewable energy sources can be easily replenished - like solar, geothermal, wind, biomass, and hydropower.
90% of total U.S. energy consumption: Nonrenewable resources cannot be easily replenished - like petroleum, hydrocarbon gas liquids, natural gas, coal, and nuclear energy.
Biomass is the largest renewable energy source in the US - accounting for 45% of all renewable consumption! In 2018, according to the U.S. Energy Information Administration. Energy Conversions Energy sources can be used as either primary or secondary energy sources. A primary energy source produces useful energy or can be used to produce secondary energy sources. A secondary energy source is used to store, more, and deliver energy in an easily useable form - they are energy carriers. All energy conversions involve transformations between usable and unusable forms of energy!
Energy conversions...
Primary energy
- Crude Oil, hard coal, natural gas liquids, natural gas, nuclear energy, etc.
- Waste.
- Wind, geothermal, biomass, hydroelectricity, wave, and total energy, etc.
Transformation
Secondary Energy
- Petroleum projects, manufactured solid fuel and gases, etc.
- Electricity and heat.
- Biofuels, etc.
...To Consumptions
Examples of primary source transformation into secondary sources of energy (Disco Learning Media, Inc., 2020). Units of Measurement Units of measurements are used to help convert between different forms of energy as they are transformed. This is used to determine the energy efficiency of an energy source - how much useful energy can be obtained from this system? Examples: Barrels - used for liquid petroleum or biofuels British thermal units - a measurement of heat energy Kilowatt hours - used to quantify the amount of energy in electricity Note: To compare energy sources, they need to be converted into the same unit! British Thermal Unit The British thermal unit (Btu) is the most common unit to compare fuel sources in the United States. 1 Btu contains as much thermal energy as the energy released by 1 standard match. The Btu content of fuels vary, but a simple comparison between the energy content of two different sources can help make more informed energy use decisions!
Energy and Power Power is defined as how fast or how slow the ‘work’ of energy is done - it’s the rate at which energy is transformed. It is measured in units of “energy per time” and can help determine the energy efficiency of a product! A 50 Watt bulb uses 50 Watt-hours of energy in one hour. A 100 Watt bulb uses 100 Watt-hours of energy in one hour. Watt = energy; Watt-hour = power. In New Jersey, residential electrical rates were on average, 15.78 cents/kWh - the difference in energy consumption between a 50 Watt bulb and a 100 Watt bulb in one hour is 0.789 cents!
Energy Sectors
- Residential
- Commercial
- Industrial
- Transportation
- Energy Power
Energy Sector Consumption in the U.S. Total energy consumption - (primary energy use + purchased electricity) - (electrical system losses + other losses) The electric power sector produced 96% of total U.S. electricity generation**, which was mostly sold to other sectors. Of the electricity produced by the electric power sector, 92% of the total electricity generation** went to the commercial (50%) and residential (42%) sectors. Of the 38.3 quadrillion Btu produced by the electric power sector, only 13.0 quads were useable. Electrical system energy losses accounted for 25.3 quads!! **(In 2018, according to the U.S. Energy Information Administration).
Overview of U.S. Energy Demands Imports and Exports
Because there is a slight discrepancy between production and consumption, energy sources are imported and exported to help countries meet their energy demands. Crude oil accounts for the largest share of U.S. energy imports. The United States is a net exported of petroleum and natural gas. The recent trade deal signed with China on January 15, 2020 is supposed to boost U.S. oil and natural gas exports. The industry could expect an additional 770,000 barrels a day of exports in 2020.
Energy and Climate Change
Living in a world with a changing climate will undoubtedly shift our energy demands.
Degree Day Data
Degree day data can be used to assess climate and energy demands of different regions. Degree days are a measurement of how cold or warm a location is by comparing the mean outdoor temperature to a standard temperature (usually 65 degree F). Ex: A day with a mean temperature of 75 degree F has 10 degree days. Note: The higher number of degree days generally results in higher levels of energy use for space heating or cooling.
Climate Change Impacts on Energy Demand:
Warmer average temperatures = higher demand on cooling systems during the summer. Infrastructure changes may be necessary to meet increased energy of demand. The amount of water available to produce energy or extract fuel will be limited. Areas with limited water will have to decide whether to use water for energy production or other uses. Sea level rise and an increase in the severity and frequency of storms will impact energy production and delivery. Most energy facilities are located along coastlines and are therefore susceptible to storm surges and sea level rise.
Sources:
Bloomberg, J.L. (2020, January 20). Analysis: What the China Trade Deal Means for U.S. Oil Producers, Washington Post. Retrieved from https://www.washingtonpost.com/business/energy/what-the-china-trade-deal... [5]
Cole, V. (n.d.). Energy and Power. The Pennsylvania State University. Disco Learning Media Inc. (n.d.) Primary resources and secondary energy. Retrieved from https://www.electricitylocal.com/states/new-jersey/ [6] US EIA.
What is energy? (2019, July 26). Retrieved from https://www.eia.gov/energy [7] explained/what-is-energy/ US EPA.
Climate Impacts on Energy. (2016, December 22). Retrieved from https://19january2017snapshot.epa.gov/climate-impacts/climate-impacts-en... [8]