
This sounds like an interesting page, right? Really, it is! Read on...
Assumption: Diminishing Marginal Utility from Consumption
Background
Conventional economic models assume that successive units of consumption of the same good or service will provide the consumer with a particular pattern of additions to their utility. Specifically, these models assume that consumers derive more benefit from earlier units of consumption of a good than they derive from later units of consumption. For example, we may enjoy an apple, but we probably won't enjoy the second apple as much as the first. And by the time we're eating the 10th apple, we might not enjoy it at all.
Marginal utility is the utility (benefit, satisfaction) consumers derive from each additional unit of a good or service. Diminishing marginal utility is the assumption that marginal utility declines with each additional unit that is consumed. As we enjoy each apple less, we are experiencing diminishing marginal utility.
The price of a good or service reflects opportunity cost, the cost of giving up other opportunities in order to enjoy this one. For example, when I spend my money to purchase an apple, I give up the opportunity to spend that money to purchase a banana. At a given price, consumers will purchase a unit of a good or service if the utility they derive from consumption of that unit is greater than the utility they could have achieved from any alternative consumption opportunity.
And, if the utility derived from the next unit of the good or service is still greater than the price, the consumer will purchase and consume that unit as well. In fact, consumers will continue to purchase successive units of a good or service as long as the benefit of consuming each marginal unit of the good exceeds its price. As long as apples give me more satisfaction for my money than other available options, I will continue buying apples.
Our economic model assumes that the marginal utility of consumption is declining. Eventually, a consumer in this model will have acquired so many units of a good that the price exceeds the consumption benefit of the marginal unit. At this point, the consumer, having purchased all previous units, will not purchase the next unit.
I enjoy each apple a little less than the one before (diminishing utility). For a while I continue to buy and eat apples, but eventually I will decide that the satisfaction I will get from the next apple (the marginal utility) is not worth the money I have to give up to get it (the opportunity cost). At this point, I will stop buying apples.
Analysis, Demand Curves
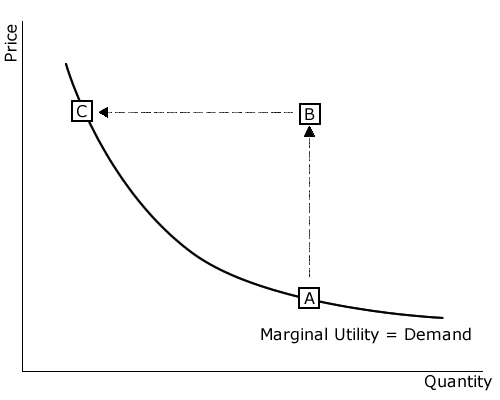
Diminishing marginal utility of consumption results in a negative relationship between the price of a good and the total quantity of that good demanded from the marketplace. Graphically, we call this relationship a demand curve. Consider the good or service depicted in the demand curve here. When the price is PA, the total number of units desired for consumption is QA. The combination of price and quantity is depicted by point "A" on the demand curve. If apples are priced at PA, then I will purchase some apples, and so will other consumers. And the total number that we will buy and eat is QA.. For each of us consumers in the marketplace, the satisfaction that we get from any more apples (marginal utility) is not worth the price..
If the price of the good is suddenly increased to PC while we consumers are consuming QA (depicted by point "B"), then we will conclude that the benefit of the marginal units consumed no longer exceeds the cost of those units. I will no longer demand my marginal units. And because I assume the other consumers are rational like I am, total units demanded in the marketplace will decline. Consumers will continue to reduce total units demanded until they reach a level at which utility from the marginal units demanded are not exceed the higher price PC. The new price-quantity combination depicted by point "C" represents another point on the demand curve. If the price of apples suddenly goes up to PC, the price (opportunity cost) will outweigh the benefits at a lower quantity of total consumption. Together, we consumers will now buy only QC apples. For any more apples than that, the satisfaction we get (marginal utility) is not worth the price..
Similarly, as the price of a good is decreased, consumers will find that the marginal benefit of additional units of consumption exceeds their opportunity cost. They will consume those additional units, and total units demanded in the marketplace will increase. If the price of apples goes down, it will take longer for the price to outweigh the satisfaction each consumer receives from their next apple. I will buy more apples, and so will everyone else.
Shifts in the Demand Curve
Factors other than price can also increase the quantity of a good demanded in the marketplace. They can cause the whole demand curve to shift, to the right or left. For example, if consumer incomes increase, then consumers will desire more of all goods at each given price. This can be illustrated as an outward (rightward) shift in the demand curve.
 Similarly, changes in the prices of related goods can also shift the demand curve. A substitute good or service is one that can be used in place of another. For example, economizing agents can drive their own car or take the bus. An increase in the price of fuel will lead some consumers to take the bus. An increase in the price of a substitute good will make the subject good more attractive to consumers. Thus, the demand curve would shift rightward. A complementary good or service is one that is associated or paired with another. For example, DVD players and DVDs. An increase in the price of complementary goods would make the subject good less desirable, resulting in an inward (leftward) shift in demand.
Finally, a fundamental change in preferences can also shift a demand curve. For example, demand for tobacco products declined at all prices levels as consumers became increasingly aware of links between smoking and lung cancer. And this occurred regardless of changes in consumer incomes, and regardless of the prices of cigars (substitutes) and scotch (complements.)