
Nuclear Generation
Click Here to expand for a text description of Figure 5.4
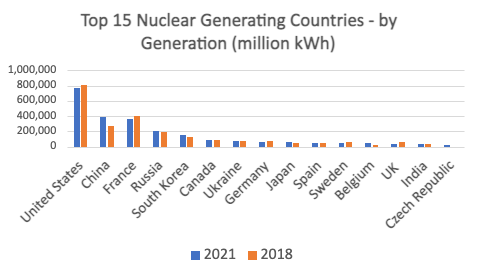
| Country | million kWh (2021) | million kWh (2018) | percent change |
|---|---|---|---|
| U.S. | 771,638 | 807,078.0 | -4.4% |
| China | 383,205 | 277,056.0 | 38.3% |
| France | 363,394 | 395,908.0 | -8.2% |
| Russia | 208,443 | 191,340.0 | 8.9% |
| South Korea | 150,456 | 127,077.0 | 18.4% |
| Canada | 86,780 | 94,450.0 | -8.1% |
| Ukraine | 81,126 | 79,532.0 | 2.0% |
| Germany | 65,444 | 71,866.0% | -8.9% |
| Japan | 61,304 | 49,330.0 | 24.3% |
| Spain | 54,218 | 53,364.0 | 1.6% |
| Sweden | 51,426 | 65,868.0 | -21.9 |
| Belgium | 47,962 | 27,251.0 | 76.0% |
| United Kingdom | 41,789 | 59,112.0 | -29.3% |
| India | 39,758 | 35,389.0 | 12.3% |
| Czech Republic | 29,044 | DNQ | -- |
Check it out!
Nuclear as share of total electricity production by country, 1965 - 2021. Note that you can change the data displayed (remove/add countries, change time span [up to 2021], view a map instead of a chart).
Source: Our World in Data, CC BY 4.0.
As you can see, some of the top countries have decreased their overall generation, largely due to Covid. China increased its meteoric rise, increasing over 38%, this was after an increase of 30% from 2017 to 2018! Germany has continued to wind down its nuclear program after Fukishima, going from 80,100 million kWh in 2017 to 65,444 million kWh in 2021, and that was a drop from about 91,800 in 2017.
According to the World Nuclear Association, as of September 2022, there were about 467 nuclear power reactors operating throughout the world. 440 reactors provide about 10% of the world's electricity. Fifteen countries relied on nuclear energy to supply at least 20% of their electricity in 2021. France leading the way at (69%), Ukraine (55%), Slovakia (52%), and Belgium (50%) all derive 50% or more of their electricity from nuclear sources (source Nuclear Energy Institute).
To Read Now
Visit the World Nuclear Association and explore Nuclear Power in the World Today
Visit the World Nuclear Associations and explore Plans For New Reactors Worldwide
Visit the U.S. Energy Information Administration and read about the U.S. Nuclear Industry
Nuclear Fuel Supply
In Supply of Uranium, the World Nuclear Association describes the challenges and subjectivity of estimating uranium reserves. Following are some selected passages from this discussion.
Uranium is a relatively common element in the crust of the Earth (very much more in the mantle). It is a metal approximately as common as tin or zinc, and it is a constituent of most rocks and even of the sea...
Total world resources of uranium, as with any other mineral or metal, are not known exactly. The only meaningful measure of long-term security of supply is the known reserves in the ground capable of being mined.
An orebody is, by definition, an occurrence of mineralisation from which the metal is economically recoverable. Orebodies, and thus measured resources – the amount known to be economically recoverable from orebodies – are therefore relative to both costs of extraction and market prices. For example, at present neither the oceans nor any granites are orebodies, but conceivably either could become so if prices were to rise sufficiently. At ten times the current price, seawater, for example, might become a potential source of vast amounts of uranium. Thus, any prediction of the future availability of any mineral, including uranium, which are based on current cost and price data, as well as current geological knowledge, are likely to prove extremely conservative...
The question of uranium supply clearly does not have a simple answer! One could say, that how much we "have" depends on how badly we want it--how much we are willing to pay. (This is true for estimating other types of reserves as well, or as WNA states, "any other mineral.")
With these caveats in mind, the WNA provides the table below (as of May 2023).
| Country | tonnes U | Percentage of World |
|---|---|---|
| Australia | 1,684,100 | 28% |
| Kazakhstan | 815,200 | 13% |
| Canada | 588,500 | 10% |
| Russia | 480,900 | 8% |
| Namibia | 470,100 | 8% |
| South Africa | 320,900 | 5% |
| Niger | 311,100 | 5% |
| Brazil | 276,800 | 5% |
| China | 223,900 | 4% |
| Mongolia | 144,600 | 2% |
| Uzbekistan | 131,300 | 2% |
| Ukraine | 107,200 | 2% |
| Botswana | 87,200 | 1% |
| USA | 59,400 | 1% |
| Tanzania | 58,200 | 1% |
| Jordan | 42,500 | 1% |
| Other | 266,600 | 5% |
| World Total | 6,078,500 | 100% |
The Council on Foreign Relations, Global Uranium Supply and Demand (2010) adds more perspective to our understanding of uranium reserve estimates (FYI, "grade of uranium ore" is the percent of ore that is actually uranium)
Still, the overall amount of uranium is less important than the grade of uranium ore, according to a 2006 background paper by the German research organization Energy Watch Group. The less uranium in the ore, the higher the overall processing costs will be for the amount obtained. The group contends that worldwide rankings mean little, then, when one considers that only Canada has a significant amount of ore above 1 percent--up to about 20 percent of the country's total reserves. In Australia, on the other hand, some 90 percent of uranium has a grade of less than 0.06 percent. Much of Kazakhstan's ore is less than 0.1 percent.
Toni Johnson. (2010). Global Uranium Supply and Demand. Retrieved November 2022.
As of December 2020, the World Nuclear Association offered this conclusion about supply and demand:
The world's present measured resources of uranium (6.1 Mt) in the cost category less than three times present spot prices and used only in conventional reactors, are enough to last for about 90 years. This represents a higher level of assured resources than is normal for most minerals. Further exploration and higher prices will certainly, on the basis of present geological knowledge, yield further resources as present ones are used up.
However, they provide the following insight at a subsequent point in the same article (emphasis added):
This focus on rates of depletion suggests that one of the dimensions of economic sustainability of metals has to do with their relative rates of depletion. Specifically, it suggests that economic sustainability will hold indefinitely as long as the rate of depletion of mineral resources is slower than the rate at which it is offset. This offsetting force will be the sum of individual factors that work against depletion, and include cost-reducing technology and knowledge, lower cost resources through exploration advances, and demand shifting through substitution of materials.
Estimating the amount of nuclear fuel left is complicated! How long nuclear energy is used for will certainly depend on a variety of economic, technological, societal, and political factors, all of which will occur on a global scale. Much of it will likely depend on some of the issues addressed on the following page.