
To Read Now
- Go to the Energy Information Administration's (EIA's) International Energy Outlook 2019 (IEO 2019). Read through the entire natural gas section. (Note that new versions of the IEO use the same model, so none of the projections have changed substantially.)
- (OPTIONAL) The EIA produces an IEO every year. The 2016 IEO (as I noted previously) provides more comprehensive information. Visit the IEO 2016 and navigate to the "Natural Gas" section. Read or browse as much as you like.
This document includes the following chart, which provides a snapshot of projected natural gas consumption through 2040:
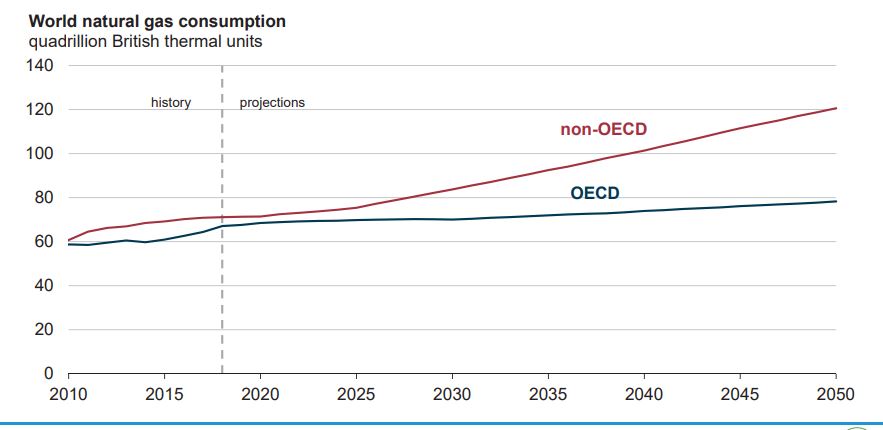
| Year | OECD | Non-OECD |
|---|---|---|
| 2015 | 59.0 | 65.1 |
| 2020 | 59.9 | 66.9 |
| 2025 | 62.0 | 76.0 |
| 2030 | 64.8 | 83.7 |
| 2035 | 69.1 | 93.2 |
| 2040 | 73.5 | 103.5 |
In the opening section, the 2016 Outlook report contains this statement, which emphasizes the role of unconventional natural gas reserves.
Although there is more to learn about the extent of the world's tight gas, shale gas, and coalbed methane resource base, the IEO2016 Reference case projects a substantial increase in those supplies—especially in the United States and also in Canada and China...The application of horizontal drilling and hydraulic fracturing technologies has made it possible to develop the U.S. shale gas resource, contributing to a near doubling of estimates for total U.S. technically recoverable natural gas resources over the past decade. Shale gas accounts for more than half of U.S. natural gas production in the IEO2016 Reference case, and tight gas, shale gas, and coalbed methane resources in Canada and China account for about 80% of total production in 2040 in those countries.
Things had not changed by the time the 2017 report was published.
- In the United States and China, increases in natural gas production between 2016 and 2040 are projected to mainly come from the development of shale resources...
- Shale resource development accounts for 50% of U.S. natural gas production in 2015, increasing to nearly 70% in 2040, as the country leverages advances in horizontal drilling and hydraulic fracturing techniques and taps into newly discovered technically recoverable reserves.
- Shale resource developments are projected to account for nearly 50% of China’s natural gas production by 2040, making the country the world’s largest shale gas producer after the United States.
- In Canada, future natural gas production is expected to come mainly from tight resources, from several regions in British Columbia and Alberta.
Remember, the IEO "Reference" case refers to IEO projections about the future that are based on the assumption that legislation and policy related to energy stays the same as when the report was generated. The Reference case "does not incorporate prospective legislation or policies that might affect energy markets."
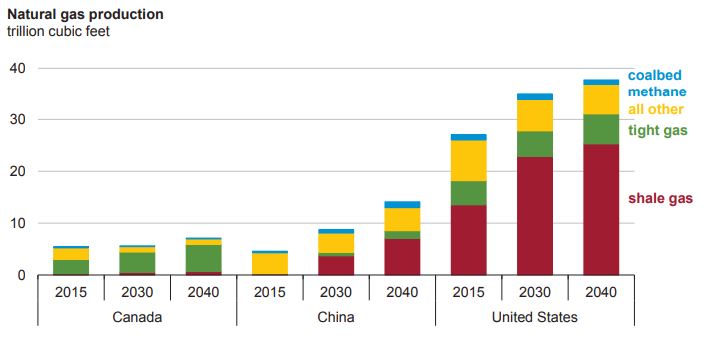
| gas type | 2015 | 2030 | 2040 |
|---|---|---|---|
| tight gas, shale gas, and coalbed methane | 19.2 | 28.8 | 31.9 |
| other gas | 7.8 | 6.1 | 5.8 |
| total gas | 27.0 | 34.9 | 37.7 |
| gas type | 2015 | 2030 | 2040 |
|---|---|---|---|
| tight gas, shale gas, and coalbed methane | 3.2 | 4.4 | 5.9 |
| other gas | 2.2 | 1.3 | 1.2 |
| total gas | 5.5 | 5.6 | 7.1 |
| gas type | 2015 | 2030 | 2040 |
|---|---|---|---|
| tight gas, shale gas, and coalbed methane | 0.6 | 5.0 | 9.7 |
| other gas | 4.1 | 3.7 | 4.5 |
| total gas | 4.6 | 8.7 | 14.1 |
Clearly, shale gas, and to a lesser extent, tight gas and coal bed methane, are to play an increasingly important role in global natural gas production!
The 2016 IEO provides the following chart for natural gas proved reserves (this information is not available in the 2017 or 2019 reports).
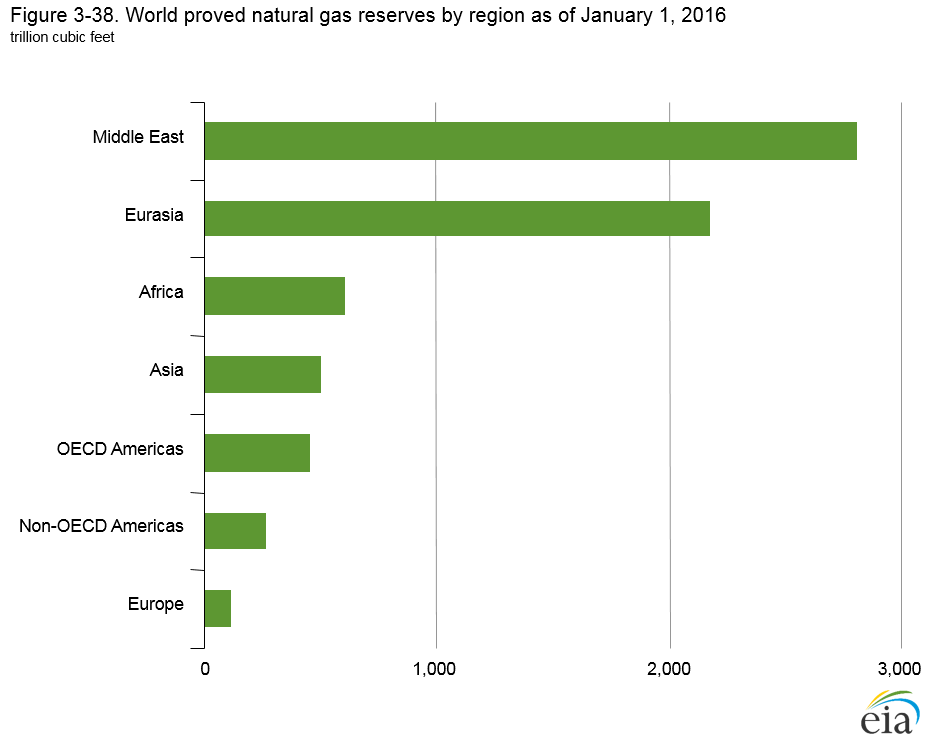
| Country | Trillion Cubic Feet |
|---|---|
| Middle East | 2,810.23 |
| Eurasia | 2,184.56 |
| Africa | 605.27 |
| Asia | 502.12 |
| OECD Americas | 457.27 |
| Non-OECD Americas | 271.62 |
| Europe | 118.71 |
The data in the second chart represents proved reserves. The Outlook study says, "the world's proved natural gas reserves have grown by about 40% over the past 20 years, to a total of 6,950 Tcf as of January 1, 2016."
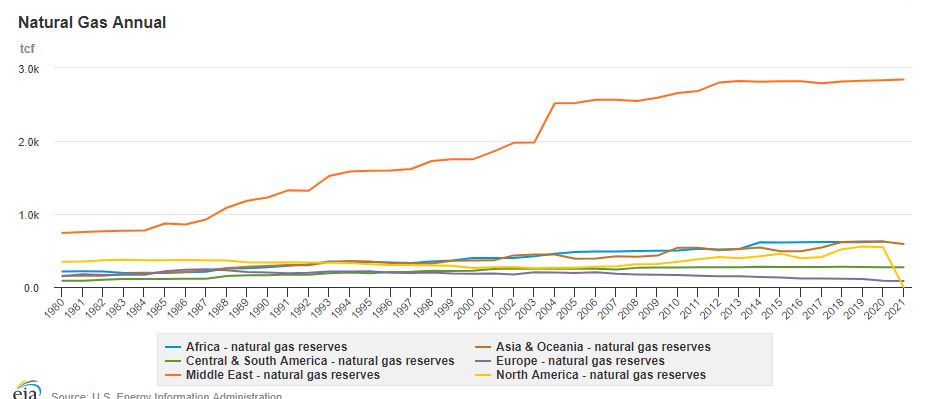
As with coal, "proved reserves" means the natural gas that has been discovered and defined at a significant level of certainty and that can be economically recovered. "Technically recoverable" resources are estimates of the amount of gas that can be recovered, using current technology, without regard to cost. The chart below demonstrates that even as natural gas use increases, proved reserves continue to (paradoxically) increase. This is the result of improved extraction technology rendering natural gas increasingly economic, particularly with regard to unconventional sources. (For example, the 2013 International Energy Outlook stated that reserves had grown by 39 percent over the past 20 years, and that the total reserves were 6,793 Tcf, both of which are smaller than the 2016 numbers.) The chart below indicates the proved reserves of various regions since 1960. The exact numbers in the chart are not important, but it should give you a feel for the general trend over time. (In case you have trouble seeing it, the top line is the Middle East, the blue line is Africa, the brown line is Asia & Oceana, the black line is North America, the green line is Central & South America, and Europe is in yellow.)
The nuances of resource estimates for non-renewable energy sources are rather complex. (For those who are interested, here is a full explanation of natural gas resource classifications.) The larger point is the importance of being fully aware of these concepts and qualifiers whenever you are working with or analyzing data related to reserves of non-renewable energy sources.
Shale Gas, the Play
Contributing mightily to the interest in natural gas, are new extraction techniques that make it economical to recover gas from "unconventional" sources, which (as defined by the EIA) include tight gas, shale gas, and coalbed methane.
Coalbed methane we understand from our previous lesson. "Tight gas" refers to natural gas that is locked in extraordinarily impermeable hard rock or that is trapped in sandstone or limestone formations that are impermeable or nonporous ("tight sand"). "Shale gas" refers to natural gas that is trapped within shale, a formation of fine-grained sedimentary rocks.
In the International Energy Outlook 2013, the EIA reports, "In the United States, one of the keys to increasing natural gas production has been advances in the application of horizontal drilling and hydraulic fracturing technologies, which have made it possible to develop the country's vast shale gas resources and have contributed to a near doubling of estimates for total U.S. technically recoverable natural gas resources over the past decade" (p. 41). This trend, as clearly indicated above, continues today.
To Read Now
From the Department of Energy's Energy in Brief series, read "What is shale gas and why is it important?" (the statistics are outdated, but the descriptions are concise and valid) and "Natural Gas and the Environment" from the U.S. EIA.
| air pollutant | natural gas | oil | coal |
|---|---|---|---|
| Carbon dioxide | 117,000 | 164,000 | 208,000 |
| carbon monoxide | 40 | 33 | 208 |
| nitrogen oxides | 92 | 448 | 457 |
| sulfur dioxide | 0.6 | 1,122 | 2,591 |
| particulates | 7.0 | 84 | 2,744 |
| formaldehyde | 0.750 | 0.220 | 0.221 |
| mercury | 0.000 | 0.007 | 0.016 |