
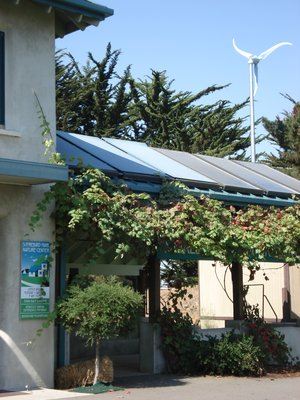
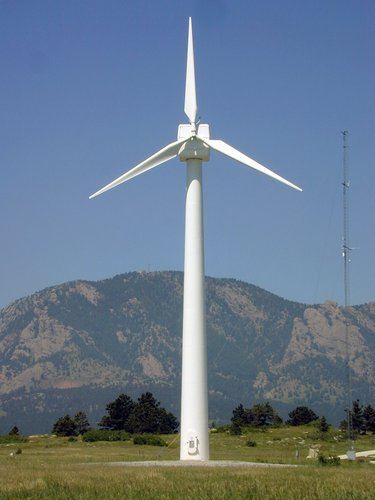
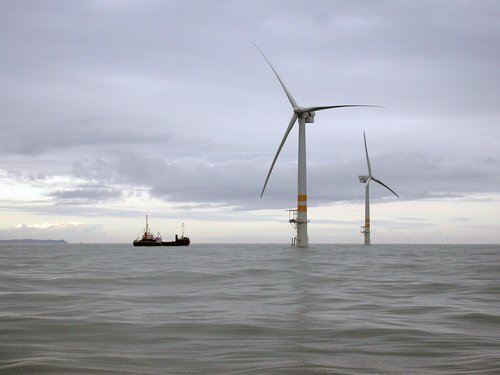
A picture is worth a thousand words! Below are three examples of wind turbine of varying scales. The world's largest installed turbine is the 12 MW Haliade-X from GE, which has 107 meter (!) blades and a hub height of 150 meters. See this page for some videos and details, if you are so inclined. (Side note: The size of this machine is - to put it in scientific terms - insane.) Bigger turbines are always being developed; read here for more info.
To Read and View Now
- Read "Wind 101: The Basics of Wind Energy" and watch the (3:16) embedded video from the Department of Energy titled "Energy 101: Wind Turbines." If the video does not work, try it here.
- Read through How a Wind Turbine Works and click through the animation from U.S. DOE.
To View Now
Please watch the following (4:18) video from First Wind, Where does Wind Power come from? Climbing Inside a Wind Turbine.
LIZ WEIR: Hey, I'm Liz from First Wind. Today, we're going to be doing something that anyone who's ever seen a wind farm is dying to do-- climb one of these bad boys. Let's go.
RYAN FONBUENA: Just hand over hand, and easy as she goes.
LIZ WEIR: All right, sounds good. See you guys up there.
RYAN FONBUENA: Right now, we are at the base unit section. This is at the top of the base section-- the midsection of the tower's bolted up. We're about 85 feet up in the air right now, and only 180 to go.
LIZ WEIR: Sounds good. Now, you're so much faster than the rest of us. About how often do you climb this thing?
RYAN FONBUENA: I try and climb a couple times a week. Not as much as I used to, but with practice, about a six-minute climb is average, for average technicians.
LIZ WEIR: Six minutes, all the way up?
RYAN FONBUENA: All the way up.
LIZ WEIR: Oh, my gosh.
All right, so Ryan, tell us where we are now.
RYAN FONBUENA: Well, where we are now, we're at the yaw deck of the turbine. This is just below the nacelle at the very top of the top tower section. What we have here, these are all the cables that allow the turbine to not only operate, but to communicate with the master control system in the bottom of the tower.
What we also have here are the power cables that delivers energy from the generator back to the grid.
LIZ WEIR: These guys are pretty smart.
RYAN FONBUENA: Yes, they are very intelligent machines. They're constantly tracking wind speed, wind direction, temperatures. They are very intelligent machines.
LIZ WEIR: All right, now we're heading up to the last leg of the trip, up to the nacelle.
RYAN FONBUENA: Yeah, I'll grab the ladder to get us up there, and we'll get the full tour.
LIZ WEIR: Sounds good. I’m smacking my head-- OK. Here we go. All right. Where to?
RYAN FONBUENA: So here we are at the nacelle.
LIZ WEIR: Now, exactly how many feet are we up in the air right now?
RYAN FONBUENA: We're proximately 270 feet in the air right now. So the wind is obviously going to be a lot stronger up here than it is on the ground.
LIZ WEIR: Can you tell us what we're looking at, in front of us?
RYAN FONBUENA: Yes, what's in front of us now is the main shaft. And this is what the rotor, or the hub, and all three blades are bolted to. The main shaft is running to our gear box here. And what the gear box does is take that low speed rotation, transmits it into a high speed rotation into the generator.
LIZ WEIR: So all the power that's coming from here goes right down through the cables we just saw, on a level before us?
RYAN FONBUENA: Yes, that's correct.
LIZ WEIR: All right, well I think what we're all looking forward to doing is heading up top. Think we can go?
RYAN FONBUENA: Yeah, we'll get up on top.
LIZ WEIR: All right, sounds good.
Oh, my god!
All right, so it's pretty cloudy up here today. But in actuality, how high up are we?
RYAN FONBUENA: We're about 275 feet off the ground now, being on top of the nacelle.
LIZ WEIR: Straight up in the air.
RYAN FONBUENA: Yes.
LIZ WEIR: And behind us, you see a weather station. Can you tell us a bit about what that measures?
RYAN FONBUENA: Yes, the met stations that's behind us measures not only the wind speed, but also the wind direction. So the turbine constantly knows where to point itself into the wind. And with the wind speed, to know when to pitch the blades to start capturing the wind, and when to pitch them out when the wind speeds either get too high, or too low.
LIZ WEIR: To learn more about wind power, please come and visit us at firstwind.com. I'm Liz, I'll see you next time.
To View Now
Please watch the following (2:38) video from Puget Sound Energy.
PRESENTER: We're going to go ahead and climb a C3 wind turbine today. We're going up over 200 feet wind turbine mace wave because of the wind outside. You will be in the close proximity of high voltage cables. 34,500 volts.
PRESENTER 2: So we're set to go ahead and climb up the turbines. So there's a base section, a mid section, and a top section to each turbine. Right now we're in the yaw deck.
This is where the cell’s going to pivot. The gearbox weighs around 20 tons. The generator and air cooler are just less than 10 tons.
Wind Turbine Output
As described in the videos above, wind turbines convert the kinetic energy of the wind into mechanical energy that rotates a rotor, which then spins a generator, which generates electricity. This process (from wind to electricity) has a theoretical maximum efficiency of 59.3% (this is called the Betz Limit), but in practice, turbines operate a significantly lower efficiency.
So where does the energy in the wind come from, and how much is there? Wind is caused by differences in pressure - air from high-pressure areas will naturally move toward areas of lower pressure. Pressure differences are caused by differential heating of the surface of the earth. All else being equal, cold air has a higher pressure than warmer air. There are many localized wind sources, but global wind circulation is caused by cold air from polar regions (relatively high pressure) moving toward warm air (relatively low pressure) toward the equator.
The power in the wind is given by the following equation:
Power (W) = 1/2 x ρ x A x v3
- Power = Watts
- ρ (rho, a Greek letter) = density of the air in kg/m3
- A = cross-sectional area of the wind in m2
- v = velocity of the wind in m/s
Thus, the power available to a wind turbine is based on the density of the air (usually about 1.2 kg/m3), the swept area of the turbine blades (picture a big circle being made by the spinning blades), and the velocity of the wind. Of these, clearly the most variable input is wind speed. However, wind speed is also the most impactful variable because it is cubed, whereas the other inputs are not.
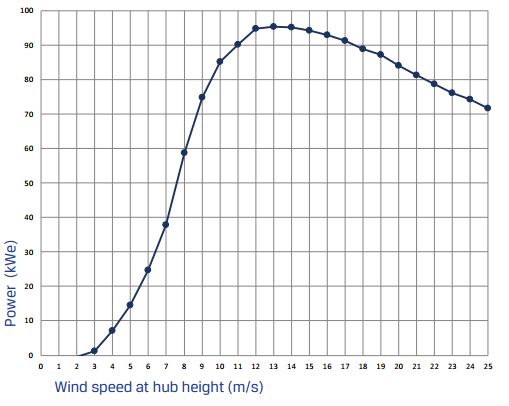
Turbines are rated in terms of capacity, usually in kW or MW. As with other energy sources, this is not the amount of power that a turbine generates at all times - it is the peak output. At peak output, a 100 kW wind turbine will generate 100 kWh of energy over 1 hour (100 kW x 1 h = 100 kWh). To determine the output at different speeds, you need to look at the power curve. The power curve for the 95 kW Northern Power turbine (similar to the turbine in the picture above) is below. As you can see, the turbine will only generate its rated 95 kW with a very limited range of wind speeds. Note also that the turbine has a startup speed of 2 m/s.
Distributed Wind Generation
Energy.gov's Wind Program gives this description of distributed wind generation:
The Wind Program defines distributed wind in terms of technology application, based on a wind plant's location relative to end-use and power distribution infrastructure, rather than size. The following wind system attributes are used by the Wind Program to characterize them as distributed:
- Proximity to End-Use: Wind turbines that are installed at or near the point of end-use for the purposes of meeting onsite energy demand or supporting the operation of the existing distribution grid.
- Point of Interconnection: Wind turbines that are connected on the customer side of the meter, directly to the distribution grid, or are off-grid in a remote location.
Distributed wind energy systems are commonly installed on, but are not limited to, residential, agricultural, commercial, industrial, and community sites, and can range in size from a 5 kilowatt turbine at a home to a multi-megawatt turbine at a manufacturing facility. Small wind turbine technology, which includes turbines that have a rated capacity of less than or equal to 100 kilowatts, is the primary technology type used in distributed wind energy applications and is the focus of the Wind Program's technology R&D efforts for distributed applications.
Not required, but for more information on distributed wind generation see Distributed wind energy systems.
IEA Wind is the International Energy Agency's (IEA) Implementing Agreement for Co-operation in the Research, Development, and Deployment of Wind Energy Systems. "Founded in 1974, the IEA Wind Agreement sponsors cooperative research tasks and provides a forum for international discussion of research and development issues" (IEA Wind).
Visit International Energy Agency (IEA) Wind and open the IEA Wind 2019 Annual Report.
- Read pp. 4 - 13.
OPTIONAL: The most up to date version (2020) of this report can be found here.
Wind Resources in the U.S.
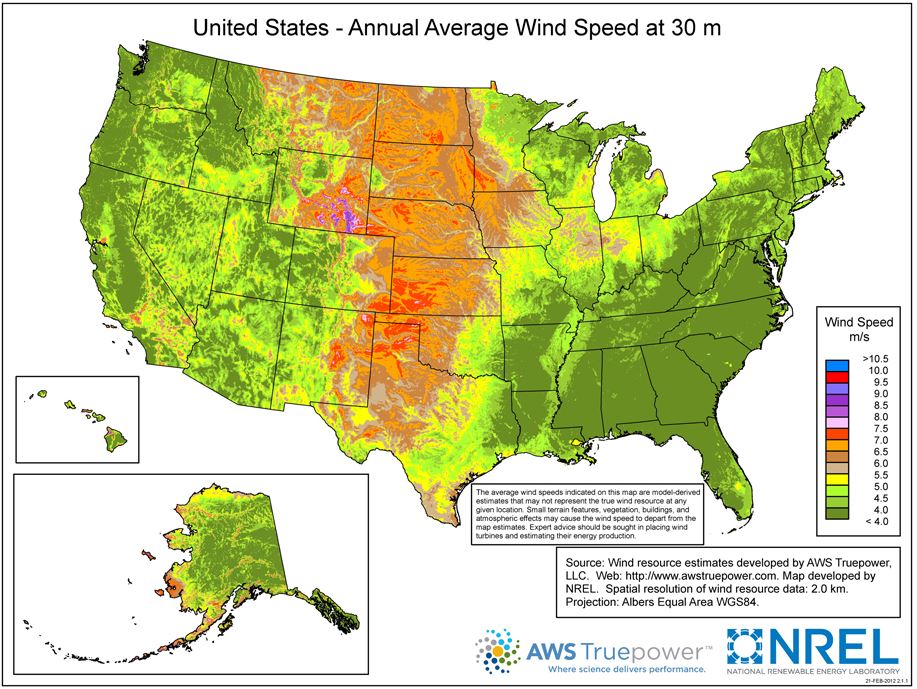
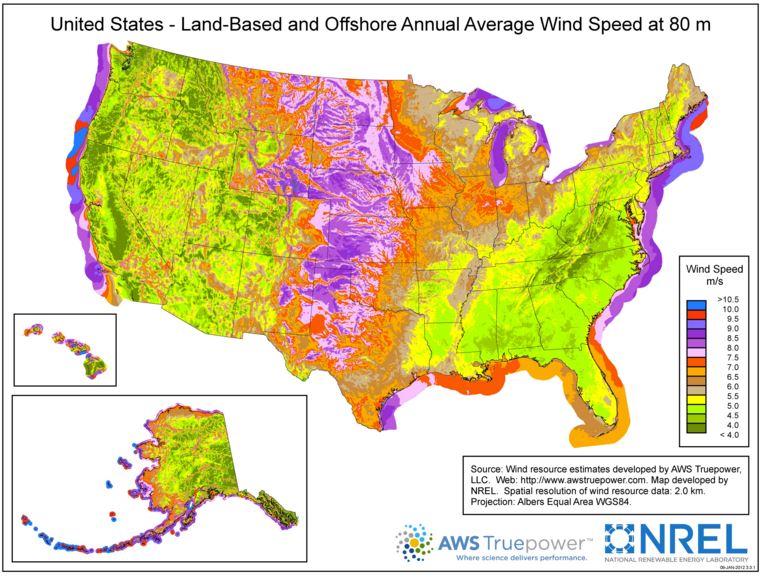
Average wind speeds vary widely by geographical location. Take a few minutes to inspect the wind speed charts from the National Renewable Energy Laboratory below. Note the location of the greatest and smallest wind speeds, and think about the physical characteristics of those areas (e.g. flat, mountainous, on-shore, off-shore, etc.). Click here for a larger version of the 30m wind speed image and click here for the 80 m image. Note that the average wind speed is higher at 80m at the same location. Wind speed generally increases with height due to the decreasing influence of friction from the earth's surface and things on it.
In addition to variability being a barrier to wind deployment, the location of wind resources is as well. In general - and certainly, in the U.S. - the best onshore wind resources are not located near major population centers. Approximately 50% of the U.S. population lives within 50 miles of the coast, but as you can see in the maps below, this is generally not where the greatest onshore wind is located. This is a problem because transporting electricity over power lines results in energy loss (as heat) due to electrical resistance in wires. The longer the electricity has to travel, the more energy is lost. To minimize this loss, large (and very expensive) power lines must be built. As you can imagine, this type of infrastructure is lacking in areas of the country that do not have large populations.
To Read Now
For an idea of how expensive building high voltage lines can be ($560 million to $720 million for 224 miles!) and to gain some insight on some interesting issues related to wind, hydro, and international energy issues, read the summary below.
- "Presidential Permit Paves Way for Minnesota Power's Great Northern Transmission Line to Deliver Canadian Hydropower to Customers." Business Wire, November 16, 2016.
- Also read a brief update on this project. The lines are energized and the project started on time! "Minnesota Power energizes Great Northern Transmission Line to move company closer to 50 percent renewable energy by 2021," Minneota Power News, June 2020.