
Both wind and solar require substantial initial capital outlay relative to the long run operating cost. These systems have no fuel costs. Once built, the operating costs are generally low. Solar photovoltaics (PV, aka solar panels), in particular, have a low operating cost. In addition to components having long rated lives (solar panels are usually warrantied for at least 25 years), there are no moving parts (except in cases where mechanical trackers are used). Under normal conditions, wind turbines will last at least 25 - 30 years, though they require more maintenance than solar PV.
States and countries have implemented a variety of policies meant to incentivize or encourage private investment in clean, renewable energies. The most common of these policies are tax credits, grants/rebates, and performance-based incentives (PBI), including feed-in tariffs (FIT) and renewable portfolio standards (RPS).
A tax credit is just that, a credit. When an individual or business investor earns a tax credit, it means that the amount of the credit will be subtracted from a future tax bill. For example, in the United States, we have a Federal Residential Renewable Energy Tax Credit available to the residential (not commercial or industrial) sector which provides a tax credit covering 26% of the cost of an installation (for 2020 and 2021). It will go to 30% for installations in 2022 through 2032. You can read more about that here. For example, in the past, if you put a photovoltaic system in your yard at a cost of $30,000, you would earn a $7,800 tax credit. The government doesn’t mail you a check for this amount. It means you get to deduct that amount from your next tax payment. To realize this money, you will need to have paid at least $7,800 in taxes, but excess credits can "generally" be carried over to future tax years. Note that even if you were owed a refund, this tax credit can be used to increase your refund, as long as you paid at least $7,800 in federal income tax throughout the year.
A rebate means that a government agency or other group (sometimes utility companies) will refund some of the investment. Pennsylvania used to provide a solar rebate program that provided rebates to investors based on the power rating of the system, $1.75/Watt, for example. The rebate was a check mailed directly to the investor (or their designate). Many states still have such programs such this solar PV rebate program in Oregon (description from DSIRE of course!). Different states often have different program specifics. See DSIRE for more examples of programs. Specifics vary within states as well. The program in Oregon, for example, has different rebate levels for different utilities and for different sectors (residential, agricultural, industrial, non-profit, government).
Performance-based incentives (PBIs), also known as production incentives, provide cash payments based on the actual output of the system. For wind and solar electric, this is the number of kilowatt-hours (kWh) generated.
The case study for this course illustrates in detail how a renewable portfolio standard (RPS) policy works. To summarize, an RPS requires utilities to use renewable energy or renewable energy credits (RECs) to account for a certain percentage of their retail electricity sales. A REC is earned by a qualified grid-tied facility for every 1,000 kWh (i.e., 1 MWh) of electricity that is generated using a renewable energy resource. The RECs are then bought and sold through a market. The settlement price varies depending on REC supply and demand at any point in time, though special auctions with guaranteed pricing and incentives are sometimes used.
Another type of production-based incentive, a feed-in-tariff (FIT) pays grid-tied renewable energy generators a specified price for the electricity they generate and guarantees them this price for a specified amount of time. This type of policy is widely used in Europe, most notably in Germany, but less so in the USA. This may be changing.
Balance Please
Renewables are not the only energy source receiving government subsidies to keep costs down and encourage consumption. The International Energy Agency (IEA) provides this global assessment in this December 2017 commentary:
"Getting energy prices right is critical for sound policymaking. But because of government energy subsidies prices that consumers pay in many countries are often well below their real market value, let alone the price that would reflect energy’s full environmental and social cost.
The estimated value of global fossil-fuel consumption subsidies decreased by 15% to $260 billion in 2016, the lowest level since the International Energy Agency started tracking these subsidies in the World Energy Outlook (WEO) ten years ago. Analysis in the new WEO-2017 showed that for the first time the largest share of global subsidies that benefit fossil fuel consumption went to keep electricity prices artificially low (41% of the global total), ahead of oil (40%) and natural gas.
But while the figure for fossil-fuel consumption subsidies may be coming down, it remains much higher than estimated government support to renewable energy: subsidies for renewables in power generation amounted to $140 billion in 2016.
There can be good reasons for governments to make energy more affordable, particularly for the poorest and most vulnerable groups. But many subsidies are poorly targeted, disproportionally benefiting wealthier segments of the population that use much more of the subsidised fuel. In practice, the effect of most subsidies is to encourage consumers to waste energy, putting added pressure on energy systems and the environment, and often straining government budgets.
Such subsidies are a roadblock on the way to a cleaner and more efficient energy future; that is why the IEA continues to be a strong supporter of international efforts to get them removed and why the WEO has consistently been shining a spotlight on this issue."
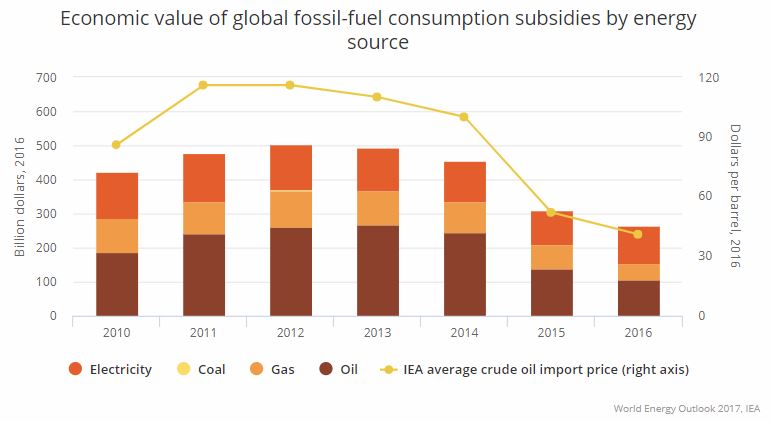
Text version of the fossil fuel subsidies chart
The chart illustrates the total global fossil fuel subsidies each year from 2010 through 2016, broken down by energy source.
| year | electricity subsidy | coal subsidy | gas subsidy | oil subsidy | crude oil price |
| 2010 | $134b | $2b | $99b | $187b | $86/bbl |
| 2011 | $139b | $3b | $92b | $242b | $116/bbl |
| 2012 | $134b | $3b | $107b | $260b | $116/bbl |
| 2013 | $125b | <$1b | $100b | $267b | $110/bbl |
| 2014 | $118b | $1b | $91b | $245b | $100/bbl |
| 2015 | $99b | <$1b | $70b | $139b | $52/bbl |
| 2016 | $107b | $2b | $49b | $105b | $41/bbl |
In their 2016 World Energy Outlook report the IEA addresses market distortion and their projection of the continued need for subsidies. (The New Policies Scenario is the IEA's baseline scenario, and assumes that countries will comply with policy commitments and plans. There is also a description of other IEA scenarios)
"In the case of subsidies to renewables (examined in detail in Chapter 11), these continue to be necessary to incentivize investment in renewables over fossil-fuel alternatives, for as long as markets fail to reflect the environmental and health costs associated with the emissions of CO2 and other pollutants. But as technology costs come down and electricity and CO2 prices increase in several markets, more and more new renewable energy projects become economically competitive without any state support: in India, solar PV is competitive without subsidies well before 2030; for the world as a whole, most new renewables-based generation in 2040 does not require subsidies. The value of the subsidies paid to all forms of renewable energy peaks at $240 billion in 2030 in the New Policies Scenario and then falls back to $200 billion by 2040, remaining well below the today’s value for fossil-fuel consumption subsidies. The subsidy per unit of renewables-based electricity generation falls dramatically: subsidies to renewable-based generation rise by some 30% over the period to 2040, yet the electricity generated by non-hydro renewables increases by a factor of five over the same period."
International Energy Agency, World Energy Outlook 2016, p. 100.
It is difficult to put an objective number on the amount and distribution of energy subsidies in the United States, due to the complexity of the inner workings of our tax code. As one Forbes article put it, "Just how taxpayer money gets doled out is mired in so much intricacy that is difficult to follow." (And that's from Forbes, "among the most trusted resources for the world's business and investment leaders!")
One can easily find news from credible sources saying that both in the United States and globally, fossil-fuels are subsidized more than renewables, and vice versa, depending on how you scope which subsidies and tax breaks to include and how you measure the amount (total $ or total $/BTU produced, for example). Regardless of the relative subsidy, a strong case can be made for reducing fossil-fuel subsidies, especially with regard to climate change. For example, in 2015, a coalition of eight governments (Costa Rica, Denmark, Ethiopia, Finland, New Zealand, Norway, Sweden, and Switzerland) calling themselves the Friends of Fossil Fuel Subsidy Reform submitted a communiqué "encouraging governments to prioritize the reform of fossil fuel subsidies," mostly in an effort to influence the recent Paris Climate Talks.
To Read Now
Via the International Institute for Sustainable Development, read "Fossil Fuel Subsidy Reform Communiqué".
As technology and economies of scale improves, the cost of renewables has gone down significantly, to the point that some properly sited renewables are cost competitive with fossil fuel and other "conventional" sources.
- Browse through "Lazard's Levelized Cost of Energy Analysis" from Lazard, in particular pp. 1 - 3 and p. 7. Lazard's annual levellized cost of energy (LCOE) reports are well-regarded in the industry.