1 Economic Markets and Market Imperfections
Did you complete the course orientation?
Before you begin this course, make sure you have completed the Course Orientation (see the Start Here! menu at left).

Overview of Lesson 1
Did you ever wonder how we make choices? How do people decide to split their time between work and play? How do companies decide to split their expenditures between workers and equipment? How do advocacy groups decide what to be an advocate for? And how do these decisions result in the diversity of activity we see around us every day?
When the topic is energy, all of these individual choices come together to create the complex and interconnected systems we refer to as global energy enterprise. In order to understand the big questions related to global energy eneterprise, we need a shared framework for thinking about choices. Economics provides such a framework. In this lesson, we will review the workings of a conventional economic model and consider the imperfections, or limits, of this model that create opportunity for nonmarket activities. We will begin to apply this theory to energy-related issues and data.
What will we learn?
By the end of this lesson, you should be able to...
- describe the welfare properties of a conventional economic model;
- list and describe the one critical assumption in the conventional economic model that gives rise to the conventional economic model's welfare properties;
- explain and demonstrate, with examples, the three implications of this assumption;
- explore rational decision making that involves mulit-dimensional objectives (materialistic and principled);
- provide and explain projections for global energy demand and sources.
What is due for Lesson 1?
The table below provides an overview of the requirements for Lesson 1. For details, please see individual assignments.
Please refer to the Calendar in Canvas for specific time frames and due dates.
REQUIREMENT |
SUBMITTING YOUR WORK |
|---|---|
| Read Lesson 1 content. | Not submitted. |
| Content Activity 1: Complete quiz | Yes—Complete quiz located in the Modules Tab in Canvas. |
| Feature Activity 1: Participate in discussion as directed in assignment. | Yes—see "Feature Activity 1" Discussion Forum under Lessons Tab in Canvas. |
What is economics?
Economics is the study of allocation of scarce resources.
Resources yield benefits through their use in consumption or production. And resources are scarce when making use of them in one way removes the opportunity to make use of them in another.
For example, we use our time for play or work. And the organizations where we work ask us to perform different tasks in order to fulfill their objectives. For example, a corporation’s objective is to earn profits for its owners by creating a product valued by their customers. Advocacy groups may have some objective other than profitability. But in a way similar to corporations, they serve their objective by providing a service valued by their constituents. These organizations receive payments--revenues or donations--that they use to invest in equipment and to pay workers. And workers use the income derived from work to buy a house, or heat a house, or buy a car, or put gasoline in the tank. And then we decide where to go, to play or to work.
All of these decisions require tradeoffs. How much equipment will an organization forgo in order to hire another worker? How much income will we forego in order to play? How much heat will we forgo in order to travel? Economics provides a framework for thinking about these choices.
Economics and Energy
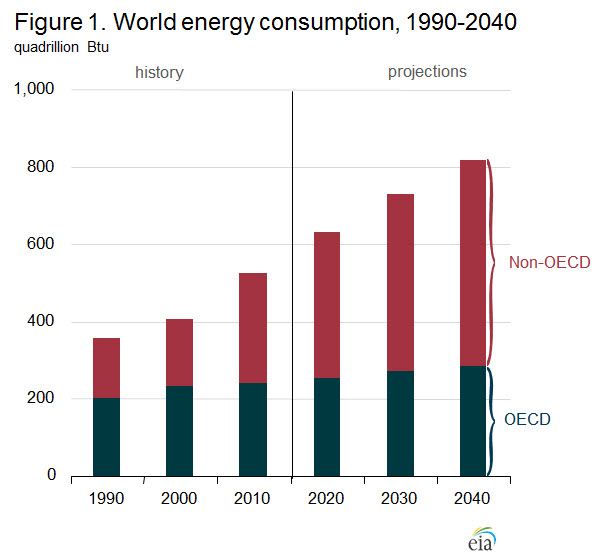
Worldwide demand for “energy” is growing rapidly. In the International Energy Outlook 2013 [3], the U.S. Energy Information Administration (EIA) projects that, in 2040, world marketed energy consumption will have increased by 56% from 2010 levels. See Figure 1. Most of this increase will occur in non-OECD countries. Remember who they are? See the Organisation for Economic Co-operation and Development (OECD) [4].
This energy is going to come from a wide and changing mix of fuel types, see Figure 2. In general economic terms, Figure 1 is the demand forecast and Figure 2 is the supply forecast.
In the wild scramble to meet soaring demand with limited resources (ah ha, “scarce resources”!), the situation is made far more complicated by volatile external issues such as those involving the environment (from emissions and climate change to land use and biodiversity), security (energy independence) and local health and economies.
Economics provides the framework for studying global energy markets and the effect of external forces. How will these resources be allocated? What are the forces that could, or should, drive this process? How do non-market factors, such as environmental impact and national security, affect this process?

How do we decide?
First, the "Ideal" World

Sometimes we can realize the value of a decision all on our own, without involving others. If we enjoy staring at the clouds, all we need to do is decide to lie down and stare, and we can do so. (Go ahead, try it!) But most of the time, we need to exchange with others in order to realize the value of our decisions.
For example, once we've decided to work and an employer has decided to hire us, we need to agree on the terms of exchange. How much labor does the employer need? How much do we want to offer? And at what price are both parties willing to make the exchange? And once we have income, we'll need to determine the terms of exchange for the goods we desire--food, gasoline, movie tickets, phone...a place to live. What will we buy? What are we willing to pay? To whom?
The arenas in which these exchanges take place are referred to as markets.
Formal economic models give us the tools we need to study the process of market exchange between economizing agents (buyers and sellers). The economic models provide a logical set of relationships between economizing agents. Much of our conventional wisdom about the benefits of markets is derived from these models.
We will first visit three basic assumptions underlying conventional economic models:
- Rationality
- Diminishing Marginal Utility from Consumption
- Increasing Marginal Cost of Production
Assumption: Rationality
Conventional economic models assume that people make rational choices. Rational choices are choices that result in the optimal level of benefit or satisfaction for the individual.
We assume that the consumption of a good or service confers some value to the consumer. Rational consumers are those who make choices that maximize the total satisfaction they derive from available consumption options. In economics, the concept of satisfaction (benefit) received from consuming a good or service is called utility. Rational consumers make choices to maximize their utility from consumption.
Similarly, we assume that producing organizations (businesses, firms) desire to return value to their owners. Rational producers are those who make choices that maximize the total value of their production, net of the costs of creating that value. Rational firms make choices to maximize their profits from production.
And, in this fabulous dance, the business owners who desire to increase their income do so in order to increase their own consumption!
Importantly, just to be clear...
Assuming that agents are rational does not imply they are necessarily materialistic. Individuals and organizations may expend their time and financial resources to obtain material comforts. But, they may also expend those resource to achieve principled objectives that depend upon moral considerations. All that rationality requires is that agents economize. By assuming rationality we are simply assuming that agents will pursue their objectives, their utility or profitability, at the lowest cost possible. Those objectives may be materialistic or principled or a little of both - for example, the person who pays extra for coffee that tastes the same but comes from a farm that is certified as sustainable [6].
Marginal Utility
This sounds like an interesting page, right? Really, it is! Read on...
Assumption: Diminishing Marginal Utility from Consumption
Background
Conventional economic models assume that successive units of consumption of the same good or service will provide the consumer with a particular pattern of additions to their utility. Specifically, these models assume that consumers derive more benefit from earlier units of consumption of a good than they derive from later units of consumption. For example, we may enjoy an apple, but we probably won't enjoy the second apple as much as the first. And by the time we're eating the 10th apple, we might not enjoy it at all.
Marginal utility is the utility (benefit, satisfaction) consumers derive from each additional unit of a good or service. Diminishing marginal utility is the assumption that marginal utility declines with each additional unit that is consumed. As we enjoy each apple less, we are experiencing diminishing marginal utility.
The price of a good or service reflects opportunity cost, the cost of giving up other opportunities in order to enjoy this one. For example, when I spend my money to purchase an apple, I give up the opportunity to spend that money to purchase a banana. At a given price, consumers will purchase a unit of a good or service if the utility they derive from consumption of that unit is greater than the utility they could have achieved from any alternative consumption opportunity.
And, if the utility derived from the next unit of the good or service is still greater than the price, the consumer will purchase and consume that unit as well. In fact, consumers will continue to purchase successive units of a good or service as long as the benefit of consuming each marginal unit of the good exceeds its price. As long as apples give me more satisfaction for my money than other available options, I will continue buying apples.
Our economic model assumes that the marginal utility of consumption is declining. Eventually, a consumer in this model will have acquired so many units of a good that the price exceeds the consumption benefit of the marginal unit. At this point, the consumer, having purchased all previous units, will not purchase the next unit.
I enjoy each apple a little less than the one before (diminishing utility). For a while I continue to buy and eat apples, but eventually I will decide that the satisfaction I will get from the next apple (the marginal utility) is not worth the money I have to give up to get it (the opportunity cost). At this point, I will stop buying apples.
Analysis, Demand Curves
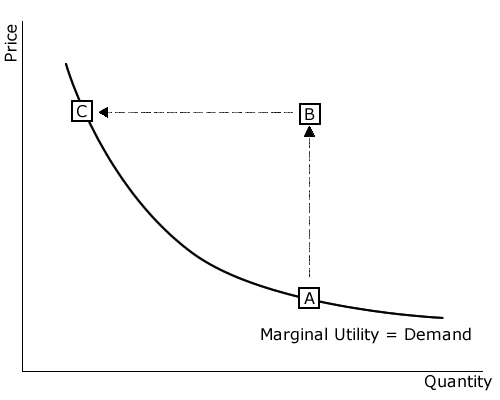
Diminishing marginal utility of consumption results in a negative relationship between the price of a good and the total quantity of that good demanded from the marketplace. Graphically, we call this relationship a demand curve. Consider the good or service depicted in the demand curve here. When the price is PA, the total number of units desired for consumption is QA. The combination of price and quantity is depicted by point "A" on the demand curve. If apples are priced at PA, then I will purchase some apples, and so will other consumers. And the total number that we will buy and eat is QA.. For each of us consumers in the marketplace, the satisfaction that we get from any more apples (marginal utility) is not worth the price..
If the price of the good is suddenly increased to PC while we consumers are consuming QA (depicted by point "B"), then we will conclude that the benefit of the marginal units consumed no longer exceeds the cost of those units. I will no longer demand my marginal units. And because I assume the other consumers are rational like I am, total units demanded in the marketplace will decline. Consumers will continue to reduce total units demanded until they reach a level at which utility from the marginal units demanded are not exceed the higher price PC. The new price-quantity combination depicted by point "C" represents another point on the demand curve. If the price of apples suddenly goes up to PC, the price (opportunity cost) will outweigh the benefits at a lower quantity of total consumption. Together, we consumers will now buy only QC apples. For any more apples than that, the satisfaction we get (marginal utility) is not worth the price..
Similarly, as the price of a good is decreased, consumers will find that the marginal benefit of additional units of consumption exceeds their opportunity cost. They will consume those additional units, and total units demanded in the marketplace will increase. If the price of apples goes down, it will take longer for the price to outweigh the satisfaction each consumer receives from their next apple. I will buy more apples, and so will everyone else.
Shifts in the Demand Curve
Factors other than price can also increase the quantity of a good demanded in the marketplace. They can cause the whole demand curve to shift, to the right or left. For example, if consumer incomes increase, then consumers will desire more of all goods at each given price. This can be illustrated as an outward (rightward) shift in the demand curve.
 Similarly, changes in the prices of related goods can also shift the demand curve. A substitute good or service is one that can be used in place of another. For example, economizing agents can drive their own car or take the bus. An increase in the price of fuel will lead some consumers to take the bus. An increase in the price of a substitute good will make the subject good more attractive to consumers. Thus, the demand curve would shift rightward. A complementary good or service is one that is associated or paired with another. For example, DVD players and DVDs. An increase in the price of complementary goods would make the subject good less desirable, resulting in an inward (leftward) shift in demand.
Finally, a fundamental change in preferences can also shift a demand curve. For example, demand for tobacco products declined at all prices levels as consumers became increasingly aware of links between smoking and lung cancer. And this occurred regardless of changes in consumer incomes, and regardless of the prices of cigars (substitutes) and scotch (complements.)
Marginal Cost
Assumption: Increasing Marginal Cost of Production
Background
Economic models also assume increasing marginal costs of production. Marginal costs are the costs of each additional unit of output. For example, if a factory is running at full capacity, producing additional units may require paying overtime. In some cases, marginal costs are small. For example, the music and software businesses. And sometimes marginal costs will initially drop due to economies of scale but eventually rise again as quantities get higher and higher. But, in general, economic models assume that marginal costs increase as quantity goes up.
Similar to the way consumers experience diminishing marginal utility, output producing firms derive more productive benefit from their first input units to production. And successive inputs to production yield smaller marginal additions to output. For example, an apple farmer may increase production by investing in a pound of fertilizer. (Let’s assume it is organic!) But the second pound of fertilizer will increase apple production to a lesser degree. Consequently, equivalent incremental increases in apple production will require successively increasing expenditures on fertilizer.
For the producer, the price paid by the consumer for each unit of good or service is the marginal revenue of output. As long as this revenue exceeds the costs of inputs required in production, the producer will continue to produce.
Our model assumes that marginal costs are increasing. Eventually, if prices remain constant, the cost of producing the next unit will outweigh the marginal revenue (benefit) of the next unit. Firms will increase production until they achieve this level of output.
Analysis, Supply Curve
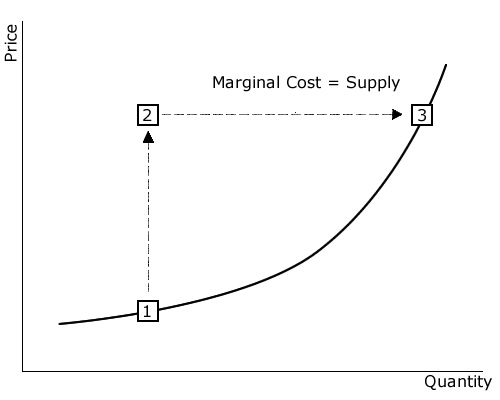
Increasing marginal costs of production result in a positive relationship between the price of a good and the total quantity of that good supplied to the marketplace. Graphically, we call this relationship a supply curve. As the price of a produced good is increased, from point 1 to point 2, for example, firms will find that the point at which marginal costs exceed marginal revenue occurs at a higher total production quantity. Firms will increase production to this level of output, and total units supplied to the marketplace will increase, to point 3 in the figure above. Similarly, as the price of a produced good is decreased, firms will find that marginal costs exceed marginal revenues at a lower number of output units, firms will decrease output to this level, and the total number of units supplied to the marketplace will decrease.
Shifts in Supply Curve
The quantity of a good supplied in the marketplace is dependent upon other factors in addition to price. These factors can cause the supply curve to shift to the left or right. For example, if the costs of inputs decline, then suppliers can afford to supply a larger quantity of a good at any given price level. And technological advances can shift a supply curve. For example, technological improvements in computing processor design and manufacturing had a profound impact on the markets for computers, cellphones, and other ‘smart’ consumer electronic devices. These technological innovations increased the supply of products that manufacturers were capable of producing at any given price level, leading to a significant reduction in prices to consumers.
Real World Example
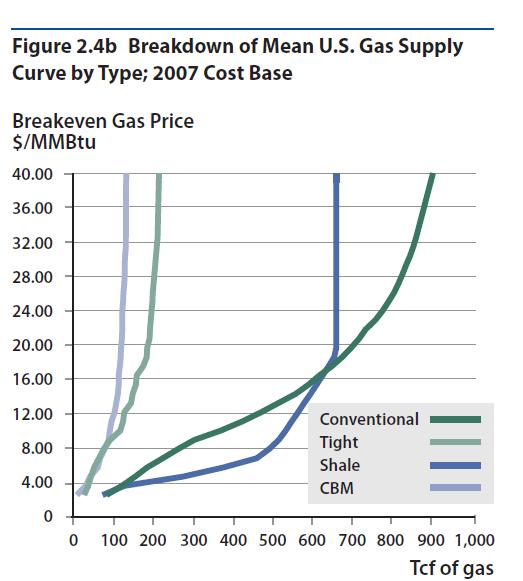
A 2011 report, The Future of Natural Gas [7], includes the supply curves shown below. The marginal costs increase differently depending on the source of the natural gas. We’ll discuss these details in a later lesson!
Market Equilibrium
How quantity and price are determined through market exchange
These three assumptions--rationality, diminishing marginal utility from consumption, and increasing marginal cost of production--are all that is required to understand market exchange in an ideal-world model.
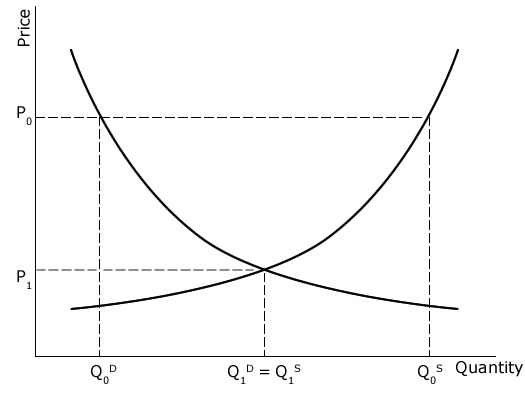
Consider first a simple world with consumers who desire to purchase a good and firms with the ability to produce a good for sale. If markets are free to set prices, then prices will adjust to equate demand and supply.
If price is such that quantity demanded is less than quantity supplied, as depicted by P0, for example, then some producing firms will not find willing buyers for their products. Those firms will reduce their price in order to entice buyers to purchase their goods instead of competing products. Falling prices will encourage demand, but will also discourage supply. (Remember, producers will continue to produce only as long as the marginal revenue exceeds the marginal cost of production.) Price adjustments will continue until a market equilibrium is reached, in which all produced goods find willing buyers and producers no longer face incentives to reduce prices, as depicted by P1 and Q1.
Similarly, if price is such that quantity demanded is greater than quantity supplied, then the market can allocate product to only some consumers. Some prospective consumers who did not receive any goods will increase the price they're willing to pay. After all, consumers receive a relatively high marginal utility from the first unit of good consumed, so we know they're willing to pay more for that unit. Consumer demand will be discouraged as the price they must pay rises above the utility (satisfaction) derived from the marginal good. And production will be encouraged as the price received for goods rises above the cost of producing the marginal good. Price adjustments will continue until a market equilibrium is reached, in which all produced goods find willing buyers and consumers no longer face incentives to increase prices.
This same story can be told simultaneously, to represent the multiple markets within an economy: markets for labor and homes and fuel oil and cars and gasoline and apples and... Economizing agents will simultaneously engage in multiple markets, supplying labor and consuming goods. And those same agents may organize firms, demanding labor and input goods in order to produce output goods. But even in this more complicated sounding case, the dynamics are the same. Market participants will adjust prices until the quantity supplied is equivalent to the quantity demanded in each market. And at this point, market participants have no incentives to continue to adjust their resource allocations. They will have acquired a magnitude of goods for which their marginal utility exceeds marginal cost. And they will have supplied a magnitude of goods for which their marginal revenue exceeds marginal cost.
For a quick demonstration of these concepts, visit Exploring Supply and Demand [8] from the University of Nebraska, and watch the supply and demand curves shift. It's a great way to see how well you understand this!
Transaction Costs
Assumptions of Frictionless Exchange
The welfare properties of free exchange
Free exchange among market participants achieves the most-desired allocation of resources from the set of all possible allocations of resources. At the set of prices equating demand and supply in each market, there are no additional exchanges that can increase any one agent's utility without reducing some other agent's utility. The price of apples will settle at the point where I have bought and the orchard has sold exactly the number of apples we want. At that price, I don’t want to buy more, and at that price the orchard does not want to sell more.
In this simplified model, the process of free and voluntary exchange maximizes total social well being, or social welfare. In this context, social welfare does not mean state-funded programs and services to assist disadvantaged groups. In economics, social welfare is simply the well-being of the entire society.
The implicit assumptions
But this welfare result is based on an important, oftentimes implicit, assumption. The model we've described assumes frictionless exchange. To simplify the study of mechanical principles and to make calculations manageable, problems presented to students often begin with “Assume no friction.” Of course, in the real world, we can’t get away with this! Nonetheless, in engineering, this simplifying assumption does allow for a clear and useful study of the underlying principles. In economics, frictionless exchange is the same idea—it is a simplifying assumption that, though useful, leaves out some unavoidable real world forces. Frictionless exchange assumes a market place with no transaction costs.
Examples of transaction costs (exchange frictions, friction costs) are considerations such as fees paid to lawyers and accountants and the time and effort spent shopping and comparing prices -- these are resources that do not provide utility. Nor do they produce other goods that produce utility. Transactions costs refers to resources that are destroyed through the process of exchange. They are the costs incurred in overcoming market imperfections. (In another use, the term “transaction cost” simply means the fee paid to a banker or broker to execute a transaction. This narrower interpretation is not our intended meaning here.)
Transaction costs are a broad group of incurred costs, which can be generally summarized into three groups:
Search and information costs: the costs (resources expended) to determine information about available goods and services. Information such as product availability, price, quality, features and performance, etc.
Bargaining costs: the costs required to reach an agreement with the other party, such as negotiations, documentation and drawing up a contract.
Policing and enforcement costs: the costs of the activities necessary to make sure the other party adheres to the terms of the contract, including legal action (or the threat thereof) when necessary.
We have Ronald Coase to thank for this added complication to our simple economic models! In fact, transaction costs and all that they imply are so important to economic theory that Professor Coase was awarded the 1991 Nobel Prize in Economics Sciences for this work. For more about the man and his work, including on-going research, visit The Ronald Coase Institute [11]. In his Prize Lecture [12], Professor Coases talks about making the “essentials of the argument” in a college lecture he gave in 1932 and then goes on to say, “I was then twenty-one years of age and the sun never ceased to shine. I could never have imagined that these ideas would become some 60 years later a major justification for the award of a Nobel Prize. And it is a strange experience to be praised in my eighties for work I did in my twenties.” I love the humanity of his words and the subtle power of his ideas. Thought you’d enjoy them too.
Implications
When we assume no transaction costs, what are we implying?
Okay, back to business! In our simplified model, we assumed no transaction costs. By doing this, what were we leaving out? Remember, transaction costs are the costs incurred to overcome market imperfections. By assuming no transaction costs, we implied the following:
Potential buyers do not waste resources on information discovery and verification. For example, suppose you are shopping for a car and you know that you can purchase one of two types; fuel efficient or fuel inefficient. If all other attributes of the cars are identical, the fuel efficient car should be more valuable because it is relatively inexpensive to operate. In a world without transactions costs, you costlessly distinguish between these two cars.
 Firms can costlessly and effectively provide employees the incentives necessary to maximize firm value/profits. For example, suppose you own a full-service gas station. In order to maximize the profitability of your business, you've determined the optimal amount of effort to expend on various tasks - sweeping floors, washing windshields, and assuring customers get the gas they want, regular when they pay for regular and premium when they pay for premium. In a world without transacitions costs, you can costlessly create the employment contracts and monitoring and enforcement mechanisms necessary to elicit this optimal level of effort from your employees.
All parties affected by an exchange can costlessly participate in the exchange. The “affected parties” include parties that are external to the transaction itself (parties other than the producer and consumer). Consider our gas station example. But now, you are a bystander experiencing the external (to the gasoline sale/purchase) cost of breathing pollution emitted by the driver's exhaust. Your displeasure provides an incentive to mitigate the consequences of the exhaust. You could pay the driver to take a route outside your neighborhood. If the driver's cost of the detour is lower than your displeasure from the exhaust, then there is a transfer payment that makes you better off without making the driver worse off. And because contacting and enforcement is costless, you will establish property rights to clean air in your neighborhood. Alternatively, if the driver's cost of the detour is greater than your displeasure, the driver can compensate you for tolerating the dirty air. In this case, the driver will have established property rights to foul the air, again, because contracting and enforcement is costless. In either case, the parties can effectively exchange through markets to optimize the resource allocation (i.e., gasoline, money, air quality, time spent driving).
Of course, in the real world, parties to an exchange (producers, consumers and external parties) do incur transaction costs. Parties external to the transaction may be affected. These nonmarket "externalities" will be the subject of our next lesson.
Assignments
Content Assignment 1
Complete the quiz "Content Activity 1," located in the Quizzes folder under the Modules tab in Canvas. The quiz consists of 10 short "essay" questions (will be graded by instructor). The quiz is not timed, but does close at midnight on the due date as shown in Canvas. If you have questions, please post in "Questions about EME 444?".
You will be graded on the correctness and quality of your answers. Thinking is good! Make your answers as orderly and clear as possible. (Be sure to select "HTML Editor," as instructed in quiz.) Help me understand what you are thinking and include data where relevant. Numbers should ALWAYS be accompanied by units of measure (not "300" but "300 kW"). Proofread and spell check your work. Thank you!Feature Assignment 1
Participate as described in the Discussion Forum "Feature Assignment 1: Fuel Economy Labels." Access this Discussion Forum under "Discussion" in the Modules tab in Canvas. Any questions, let me know!
Summary and Final Tasks
In this lesson, we introduced the concepts of rational decision making, market exchange and equilibrium, transactions costs and externalities. You learned:
- in a conventional economic model, free markets maximize welfare. Rational buyers facing diminishing marginal utility of consumption, and rational sellers facing increasing marginal costs of production will exhaust all opportunities for beneficial exchange when they are permitted to freely trade their resources.
- in a conventional economic model, buyers and sellers incur no costs to transact with one another. Such 'frictionless exchange' makes irrelevant any externalities that may be associated with the exchange. But importantly, the conventional economic model's welfare properties depend critically upon the absence of these imperfections which would otherwise arise from exchange frictions.
- introducing transactions costs results in externalities that cannot be resolved through market exchange. These market imperfections create incentives for stakeholders to expend resources affecting an exchange to which they are not party.
Have you completed everything?
You have reached the end of Lesson 1! Double-check the list of requirements on the first page of this lesson to make sure you have completed all of the activities listed there.