1 Nonmarket Analysis
Introduction
Did you complete the course orientation?
Before you begin this course, make sure you have completed the Course Orientation.

Overview of Lesson 1
Effective analysis of non-market issues requires a framework for evaluating those issues. This lesson provides a systematic set of considerations that are useful for characterizing and analyzing issues that may result in non-market activity.
Lesson 1 also introduces a Case Study that will carry over for several lessons. The Case Study demonstrates nonmarket analysis related to legislation regarding Renewable Portfolio Standards (RPS) policy. RPS programs are widely used to promote the use of renewable energy. This case study will help you understand and master both the structure and mechanics of RPS programs and the step-by-step analysis of nonmarket issues. In this lesson, we will learn the fundamentals of nonmarket analysis and delve in to the details of how RPS programs work.
What will we learn?
By the end of this lesson, you should be able to:
- clearly explain nonmarket environments and the lifecycle of nonmarket issues;
- identify nonmarket issues, stakeholders, and initial policy positions;
- know how to acquire and/or generate the information necessary for non-market issue analysis;
- assess demand for nonmarket action (per capita benefits, aggregate benefits, substitutes);
- assess supply of nonmarket action (cost of organizing, number of members, coverage, resources);
- understand fully renewable portfolio standard (RPS) structure, terminology and mechanisms.
By the end of this lesson, you should have an initial understanding of how to:
- organize and tabulate information to facilitate drawing conclusions from your analysis;
- predict a stakeholder's likelihood of taking nonmarket action;
- be able to state and defend a prediction from your analysis (how the issue is likely to turn out) and identify key stakeholders (the stakeholders most important for driving the issue to its predicted resolution).
What is due for Lesson 1?
The table below provides an overview of the requirements for Lesson 1. For details, please see individual assignments.
Please refer to the Calendar in Canvas for specific time frames and due dates.
| REQUIREMENT | SUBMITTING YOUR WORK |
|---|---|
| Read Lesson 1 content and any additional assigned material | Not submitted. |
| Weekly Activity 1 | Yes—Complete Activity located in the Modules Tab in Canvas. |
Introduction to Nonmarket Analysis
What is Economics?
Economics is the study of the allocation of scarce resources.
Resources yield benefits through their use in consumption or production. And resources are scarce when making use of them in one way removes the opportunity to make use of them in another.
For example, we use our time for play or work. And the organizations where we work ask us to perform different tasks in order to fulfill their objectives. A corporation’s primary objective is to earn profits for its owners by creating a product valued by its customers. These organizations receive payments--revenues (or donations if the organization is not a business) --that they use to invest in equipment and to pay workers. And workers use the income derived from work to buy a house, heat a house, or buy a car, or put gasoline in the tank. And then we decide where to go, to play or to work.
All of these decisions require tradeoffs. How much equipment will an organization forgo in order to hire another worker? How much income will we forgo in order to play? How much heat will we forgo in order to travel? Economics provides a framework for thinking about these choices.
Economics and Energy
Worldwide demand for energy is growing rapidly. The U.S. Energy Information Administration (EIA) projects in the 2021 IEO that world-marketed energy consumption will continue to increase. See Figure 1.1. Most of this increase will occur in non-OECD countries. Remember from previous courses who they are? See the Organization for Economic Co-operation and Development (OECD) [3]. This energy is going to come from a wide and changing mix of fuel types and end-use sectors (see Figure 1.2.)
In general economic terms, Figure 1.1 is the demand forecast and Figure 1.2 is the supply forecast.
Finally, to provide some important perspective, keep in mind that there is an important difference between total energy use and per capita (per person) energy use. The chart at the bottom of the page demonstrates this, especially when compared to Figure 1.1. Data from I [4]nternational Energy Outlook 2021 [5].
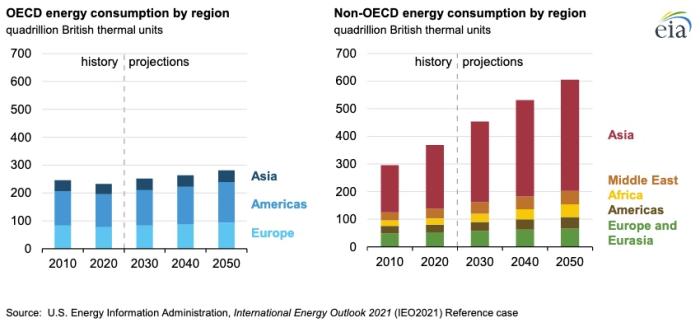
| Year | OECD energy consumption | Non-OECD energy consumption |
|---|---|---|
| 2010 | 243 | 297 |
| 2020 | 230 | 371 |
| 2030 | 248 | 459 |
| 2040 | 261 | 537 |
| 2050 | 279 | 611 |
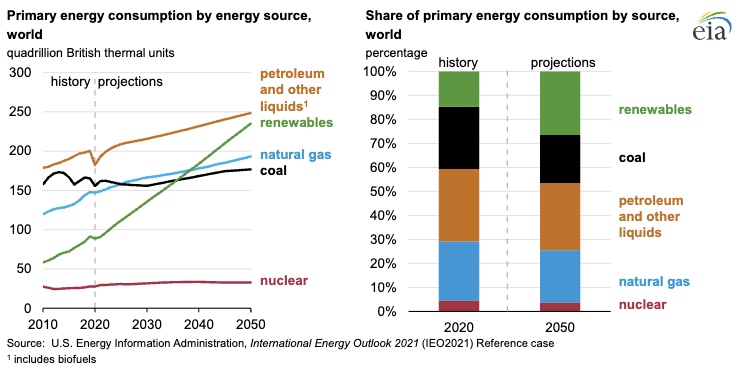
- Reference case data shows decline in coal use through 2030 but that use of all major fuels (petroleum and other liquids, renewables, natural gas, and nuclear) will grow from 2030 to 2050.
- Reference case data also shows that expected changes in government policies and falling technology costs will allow a rise in the use of renewable energies, which will limit the share of global energy use fueled by natural gas.
- In absolute terms, use of coal is expected to decline steadily through 2050 but will remain in the mix due to heavy industrial use in India, local supplies in certain areas, and an increase in coal-fired generating plants in certain parts of Asia.
- A constant pace of growth is projected for liquid fuels consumption through 2050 due to world-wide travel, use of internal combustion engines, and industrial use of petroleum and other liquids.
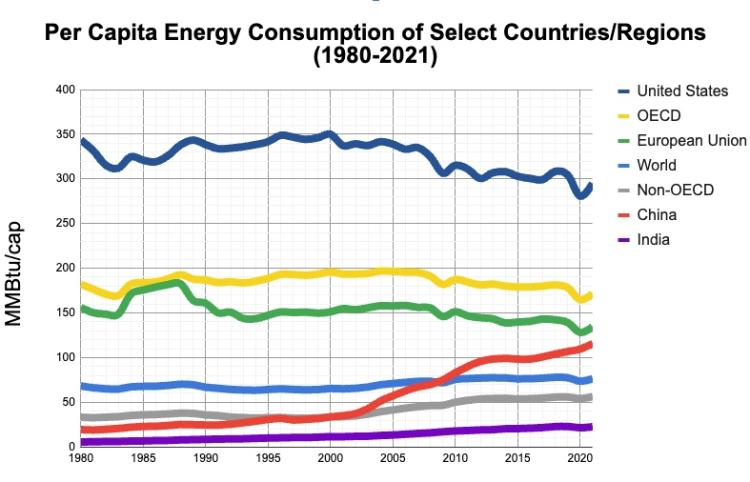
This is a line chart that has seven lines with the date in years across on the X-axis (1980 through 2021) and million Btu’s per person on the Y-axis. The lines on the chart represent the per capita energy consumption of the following geographic areas: the world, OECD nations, non-OECD nations, the EU-27, the United States, China, and India. Numbers below are approximate.
- Until about 2010, the U.S. maintained an emission rate of between 300 and 350 million BTUs per person since 1980, with a drop from around 340 in 2008 to around 290 in 2015. This went back up before 2015 and hovered around the 300 mark, but since in 2020 dived to around 280 before rebounding in 2021.
- OECD nations maintained an emission rate of approximately 200 million BTUs per person since 1980, with a slight downward trend since 2008 and a 2021 number of around 275 million.
- The European Union has maintained an emission rate of approximately 150 million BTUs per person since 1980, with a slight downward trend since 2008.
- World averages have maintained a relatively steady 60 million BTUs per person from 1980 through the early 1990's, but have been slowly moving upward to nearly 80 MMBtu/cap in 2015 and beyond.
- Non-OECD nations averaged approximately 25 million BTUs per person from 1980 through 2002, then slowly increased to a little over 50 million BTUs per person in 2016 and have continued to hover just above the 50 million mark.
- China slowly increased from around 20 million BTUs per person in 1980 to about 40 million BTUs per person in 2002, then had a sharp increase to nearly 100 million BTUs per person in 2016. That trajectory has continued so that in 2021, the mark is approaching 125 million. This is by far the most dramatic increase over a short period of time in this chart.
- India has increased at a very gradual rate from approximately 5 million BTUs per person in 1980 to around 22 million BTUs per person in 2021.
In the wild scramble to meet soaring demand with limited resources (ah ha, “scarce resources”!), the situation is made far more complicated by volatile external issues such as those involving the environment (from emissions and climate change to land use and biodiversity), security (energy independence) and local health and economies. Issues such as these, which are addressed outside of normal market transactions ("external to the market"), are called externalities or nonmarket factors and are the subject of this course.
A Note on Decoupling and Emissions Goals
The IEO 2020 notes that despite energy use growing at around 1% per year through 2050, global GDP is expected to grow between 2.4% and 3.7% per year. While GDP is increasingly regarded as an inadequate way to measure the health of an economy and the people in it (see e.g. Lesson 2 [8] from Energy and Sustainability in Contemporary Culture for some insight), it does provide a reasonably good snapshot of total economic activity. Energy use increasing at a lower rate than economic growth represents a partial decoupling of energy and economic growth. There is some debate on whether total economic growth is needed or not (redistribution would likely do the trick), but the global economy is likely to keep growing regardless. Assuming that, it would be ideal if energy use becomes entirely decoupled from economic growth. Greenhouse gas emissions must not only be decoupled from economic growth but there is wide agreement that net emissions must be zero in the next 30 - 40 years [9]. There is some indication [10] that we may have decoupled emissions from growth, but that is not enough.
To Read Now
At this point, please complete Reading Assignment 1-- Market and Non-Market Environments. This is located under the Lesson 01 subheading in the Modules tab in Canvas. (Read everything through "Change in the Nonmarket Environment.")
Nonmarket Environment
The market environment includes interactions between firms, suppliers, and customers, where the interactions are voluntary economic transactions, governed by markets and contracts.
The nonmarket environment, on the other hand, refers to the domain of concerns that cannot be controlled or managed through an individual's or organization's market-based interactions. These are social, political, regulatory, and legal considerations that affect an organization’s and/or individual's fortunes but occur outside the market environment.
It is very important to note, as the reading makes clear, that market and nonmarket environments can and often do impact each other. In particular, market activity often precipitates nonmarket action, and nonmarket action often impacts the market environment. As Baron notes in the reading: "The problems encountered by Nike, Wal-Mart, BP, Microsoft, and Citigroup originated in their market environments, but the challenges to their operations came from the nonmarket environment."


The Life Cycle of Nonmarket Issues
To Read Now
At this point, please complete Reading Assignment 2-The Nonmarket Issue Life Cycle.
Nonmarket issues have the potential to evolve through various stages, which can be understood as a life cycle. Once an issue is identified, interest groups often form based upon their interests in potential outcomes. Sometimes (as in the greeting card example in the reading), the issue is addressed by a firm as a response to actions taken by interest groups. Some issues will evolve to a legislative stage, where lawmakers are lobbied to address the issue. Issues resulting in legislation will eventually be administered through a regulatory framework. And finally, in cases where there are disputes over the application of that regulatory framework, interested parties may seek enforcement through the regulatory framework and the court system.
Note that this lifecycle does not explain why issues progress as such, only that it is common for them to do so. Also keep in mind that nonmarket issues can end up having impacts without reaching the legislative stage, e.g. public perception.
Introduction to Nonmarket Analysis
Nonmarket environments refer to the domain of concerns that cannot be controlled or managed exclusively through an individual’s or organization’s market-based interactions. For example, many of us are concerned with climate change, environmental damage from energy resource extraction, electric power reliability, worker safety and fair wages, and energy affordability, to name a few! These are concerns we cannot always effectively address with conventional transactions or contracts.
Our nonmarket concerns are associated with a set of issues which can be resolved in a number of ways. Based upon our beliefs, we develop expectations about how our nonmarket concerns are affected by these alternative resolutions. And based on our individual and/or organizational objectives, we have preferences over the set of possible outcomes for each issue. For example, a particular carbon cap-and-trade proposal is an issue associated with at least two nonmarket concerns: climate change and energy affordability. Any individual or organization concerned with climate change or energy affordability will likely have preferences for or against a particular carbon cap-and-trade proposal.
Take a Look!
For those of you have taken EGEE 401, this may look familiar (it should!). Either way, spend four minutes to take a look. This is an entertaining and very good explanation of the principles of cap and trade. Please watch the following (3:29) video:
HANK GREEN: I just ran across a rather disturbing statistic. Apparently, Americans have no idea what cap and trade is. When Rasmussen asked Americans what cap and trade was, most of them had no idea, and 29% of them said that it had something to do with regulatory reform on Wall Street. Only 24% said that it had anything to do with environmental issues. I thought maybe this EcoGeek could be of some service. Now you probably know what cap and trade is, but maybe you need a refresher course. And maybe you just want to share it with your friends and family, so they too can have some idea about the most important environmental legislation ever.
So cap and trade, in its simplest form-- basically, the government says to all of the companies in the country, we can only have this much of a certain pollutant. That's the cap. We simply cannot have more than that much pollution. And if we do, we're going to fine the crap out of all of you.
Then the government distributes credits for the release of those pollutants to all of the companies that produce those pollutants. Ideally, they give the companies credits for less pollution than they're already polluting with, so then the companies either have to reduce their pollution or buy credits from someone else. If the company is able to reduce its pollution below its current credit level, then it can sell or "trade away" those credits to companies that are having a harder time.
So basically, the government creates an artificial economic market in pollution. So then the amount of money that the companies are willing to spend decreasing their pollution is directly proportional to the amount of money it would cost them to buy the credits if they weren't able to reduce their pollution. Success! We have a new economic market, and everyone wants to reduce their pollution!
But wait. There are problems. We run into the first problem when we say that the credits are "distributed." How are they distributed? There are two ways. Basically, there's grandfathering, in which you get credit based on the amount of pollution you're already producing-- which seems kind of lame to me. I mean, it's like, oh, you're the biggest polluter! Here, have the largest number of credits!
Or two, they can be auctioned off. That's the way that the Obama administration is looking at doing it. They're actually hoping to have huge amounts of money generated by the auctioning off of these carbon credits. But economists are kind of like, wait a second. So you created an artificial market, and you're selling nothing for billions of dollars? Also, the polluting corporations don't like it at all. But to me, it seems like a fairly fair way to do things.
The second problem with cap and trade is that, yes, the money has to come from somewhere. So whatever sectors of the economy are doing all that pollution, the prices of their services are going to go up. So yes, gasoline prices and energy prices would increase. And if gasoline and energy prices are increasing, what we have is not a cap and trade system. It's a tax. It's a tax! Boo, taxes! Rah, rah, rah! I like my money. Don't take my money away!
But it's certainly more popular than a straight carbon tax, and with good reason. First, we don't have to call it a "tax," and people like that. Second, say there's one coal power plant that can reduce its emissions relatively easily, and there's another in which it would be extremely expensive to reduce its emissions. The coal plant that has an easy time can reduce its emissions twice over, and the coal plant that's having a hard time doesn't have to do it. So you get the same amount of reduction in the end, but the costs are much lower.
Cap and trade systems have actually been used in America for a long time, mostly on sulfur dioxide, which is the stuff that causes acid rain. And since cap and trade legislation went into place on sulfur dioxide, energy prices have not increased substantially, but the emission of sulfur dioxide has gone down like 50% despite huge increases in power generation. So yes, it works!
Well, it works for sulfur dioxide, anyway. The question is, will it work for greenhouse gases? Hopefully, we will find out soon. The Obama administration hopes to have cap and trade legislation on the books by 2012. And from then on, the government can continually lower the cap, and that strong market in carbon credits should spur innovation in wind power, carbon sequestration, solar power, electric cars, and who knows what else.
And that, my friends, is why I as an EcoGeek am excited about cap and trade, and why America should, yeah, have some idea what I'm talking about. This is Hank Green from ecogeek.org.
Any issue will involve a set of stakeholders' concerns that are sufficient to justify expending resources to influence the ultimate outcome. In the case of carbon cap-and-trade, stakeholders primarily concerned with energy affordability and believing that such a policy would increase energy costs will likely prefer that a cap-and-trade scheme not be implemented. In contrast, stakeholders primarily concerned with climate change, and who believe that such a policy will mitigate climate change will likely prefer that the cap-and-trade scheme succeed. Keep in mind that it is usually not so cut-and-dry. As you will see moving forward, most stakeholders have a range of nonmarket concerns with varying degrees of intensity and priority, and so deciding which side of an issue one is on can be complicated. You didn't think this would be easy, did you?
Nonmarket analysis summarizes the set of stakeholders in a way that facilitates evaluating the range of potential outcomes for each issue.
Information Collection
Nonmarket analysis requires a limited but particular set of information about each issue. The issue is specified uni-dimensionally (more on this below). The analysis identifies the stakeholders who have preferences that vary among the potential outcomes. The stakeholders are characterized according to attributes that determine their (potential) influence on the issue outcome.
In this course, we will use the words issue, stakeholders, and effectiveness as defined below. These concepts, however, are often expressed in other ways, depending on the author and context. For example, Baron in Business and the Environment (the source of earlier assigned readings), refers to our "stakeholders" as "interests."
Issue
An issue is the basic unit of consideration for nonmarket analysis. Issues arise when stakeholders have preferences that vary over alternative methods for achieving a business or policy objective. Through these issues, stakeholders affect the likelihood of achieving their organizational objectives. For purposes of analysis, an issue is defined as a specific policy question with a uni-dimensional set of possible policy alternatives (outcomes).
Issue: a specific policy question with a uni-dimensional set of possible policy alternatives (outcomes)
Examples of issues include: What should be allowable concentrations for particulate emissions? At what legal age should we be able to vote? At what levels shall we set climate change agreement emissions targets? How often should we report on progress in meeting climate change emissions targets?
Bueno de Mesquita provides a useful definition:
An issue is any specific policy question for which different individuals, organized groups, or informal, interested parties i.e., stakeholders, have preferences regarding [an] outcome. The range of preferred outcomes on an issue must be capable of being represented along a single line or continuum. Be sure to define carefully the precise policy question you want to analyze. The … ends of [a] policy continuum should specify the most extreme outcomes actually supported by any [particular stakeholder]. Of course, these extreme outcomes need not refer to a resolution that anybody believes will be achieved, but refer only to the fact that there is at least one stakeholder that currently seems to support such an outcome.
de Mesquita, B. (n.d.) The Predictioneer's Game. Retrieved March 17, 2010 from Predictioners Game [18]
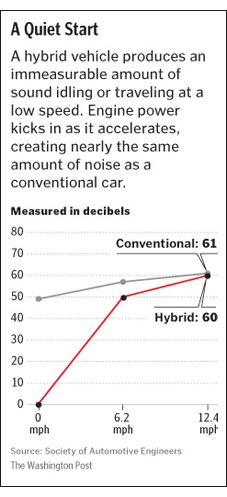
Click here for text description of Figure 1.4
This following text precedes a graph. A hybrid vehicle produces an immeasurable amount of sound idling or traveling at a low speed. Engine power kicks in as it accelerates, creating nearly the same amount of noise as a conventional car.
The graph has mph on the x axis and decibels on the y axis.The hybrid car starts at zero decibels while it idles and goes to 50 decibels by the time it hits 6.2 mph. From 6.2 mph to 12.4 mph it rises from 50 - 60 decibels.
The conventional car idles at 50 decibels, moves to about 58 decibels at 6.2 mph and then rises to 61 decibels by the time it reaches 12.4 mph.
Consider the case of hybrid cars. Better for the environment and pocketbook (in many cases), what's not to love? Of all things, they may be too quiet. In fact, in the eyes (well, ears) of many, these cars are so quiet they are unsafe--a danger to pedestrians. Nearly 10 years after the first release of production hybrids in the USA, a study showed that hybrid-electric vehicles were 50% more likely than cars with noisy combustion engines to be involved in an accident during certain low-speed maneuvers. We have an issue, folks: Should manufacturers be required to add noise to these otherwise quiet vehicles? (For source of this info and more background see The Deadly Silence of the Electric Car [19].)
By the way, this is still an issue! Though very few people are aware of it (I counted myself among them until I researched it), the NHTSA propagated a rule that electric and hybrid vehicles were required to add artificial noise if they are traveling up to 18.6 mph or reverse starting in September of 2020 (source: The Verge [20], 2019). In September 2020, the NHTSA, responding to lobbying from automakers, delayed the implementation of this so-called "Quiet Car Rule" by 6 months (source: GMA Authority [21], September 2020). I could not figure out whether or not this rule was implemented in March of 2021. Perhaps someone who is more plugged in (no pun intended) to this issue could update the class in the Coffee Shop.
A Note on Uni-Dimensionality
You probably have a general idea what uni-dimensionality means, but just to clarify in case it is needed: "Uni-dimensional" is what Mesquita referred to when he notes that issues "must be capable of being represented along a single line or continuum" (emphasis added). In other words, the choice(s) presented in an issue must be a matter of degrees. The easiest example is a simple "yes or no" question, e.g.: "If a presidential election were held today, would you vote for Donald Trump to be President or not?" The two extremes of this choice are "yes" and "no". A related continuum-based question would be: "If the election were today, how likely would you be to vote for Donald Trump on a scale of 1-10, with 1 meaning 'extremely unlikely' and 10 meaning 'extremely likely?'" This time, the extremes of the choice are 1 and 10. Each of these questions can be visually represented on a single line (a continuum), and the latter question presents choices that are varying degrees of the same option. A multi-dimensional question cannot be represented on a single line. For example: "If the election were held today, would you most likely vote for Joe Biden, Donald Trump, Kanye West, or none of the above?" No matter how many candidates are listed, even though there are a discrete number of choices, they are not a varying degree of a single choice, and thus do not represent a single issue as we define it.
The issue above has a simple "yes/no" continuum, but once different types of noises are being proposed (e.g. a "whir" or a some other noise, as the article describes), then it becomes multidimensional and thus not an "issue" as we define it.
Stakeholders
Stakeholders are the individuals or groups that act to influence the ultimate resolution of a particular issue.
Bueno de Mesquita again provides a useful definition:
A stakeholder … is any individual or group with an interest in trying to influence the outcome on the issue being analyzed. … [T]he list of [stakeholders should not be limited] to those who will ultimately make the decision. ... [Stakeholders also include those who will] weigh in, trying to influence the decision makers. All who try to influence the outcome should be represented in the stakeholder list.
de Mesquita, B. (n.d.) The Predictioneer's Game. Retrieved March 17, 2010 from Predictioners Game [18].
In the case of the too-quiet electric vehicles (EVs), numerous stakeholders emerge: EV manufacturers (e.g., Toyota, Tesla, Nissan, GM, Ford), Alliance of Automobile Manufacturers, and the National Federation of the Blind, among others. Please note that the terms "stakeholders," "stakeholder groups," and "interest groups" are often used interchangeably.
When performing non-market analysis, be careful to distinguish between those that try to influence the decision and those who simply make the decision based on objectively analyzing the issue. The NHTSA, a federal administration under the Department of Transportation, is tasked with rule making based on the Pedestrian Safety Enhancement Act of 2010 (PSEA, full text available here [22]). Essentially, they were tasked with determining how to interpret and enforce the PSEA, which like many laws, is sufficiently vague to the point that it can be interpreted in a variety of ways. Here is one of the key aspects of the Act: The NHTSA must "determine the minimum level of sound emitted from a motor vehicle that is necessary to provide blind and other pedestrians with the information needed to reasonably detect a nearby electric or hybrid vehicle operating at or below the cross-over speed, if any..." (Source: US. Government Printing Office [22]) (So yeah, not so specific.) After the issue completed the legislative stage, the NHTSA issued a proposed rule that detailed how to adhere to the Act based on their nominally objective interpretation of it. They then allowed public comment, as required by law, then issued a final ruling after considering the comments. They then allowed some time for formal petitions. In this process, they did not seek to influence the outcome, and thus would not be considered a stakeholder. They made a decision based on the letter of the law and comments from stakeholders. Stakeholders were involved in all stages of the issue formation, from interest group formation to legislation to administration. If you are interested in seeing the final ruling and the petitions filed, you can view it here [23]in the Federal Register.
Initial Policy Position
Each stakeholder can be associated with an initial policy position. An initial policy position refers to the policy preference that a stakeholder is willing to proclaim at the outset of bargaining with other stakeholders. This preference must fall somewhere along the issue continuum.
The initial policy position is the "position the stakeholder favors or advocates within the context of the situation. When a [stakeholder's] position has not been articulated, it is best thought of as the answer to the following mind experiment: If the stakeholder were asked to write down his or her position, without [necessarily] knowing the values being written down by other stakeholders, what would he or she write down as the position he or she prefers on the issue continuum?”
de Mesquita, B. (n.d.) The Predictioneer's Game. Retrieved March 17, 2010 from Predictioners Game [18]
In our example, EV manufacturers, at least initially, were described as a "nascent industry divided over whether safety sounds should be added to the quiet cars and, if so, what those noises should be." Whereas some manufacturers began to experiment with adding sound, and testing for customer preference, others were less enthusiastic. Officials at Tesla are quoted as saying they had "no intention of implementing 'fake noises.'" Other stakeholders, such as the National Federation of the Blind were clearly in favor of a mandate. The NHTSA was ready to act, given sufficient data. Each stakeholder had an initial position on a policy that would require adding "noise."
Determining Stakeholder Groups
It can be difficult to determine the boundaries of a stakeholder when it is a group of people or organizations. For example, "EV manufacturers" could possibly be considered a single stakeholder, but only if they are likely to take unified action. What if Tesla and GM have different perspectives on the issue of artificial noise and thus would not act in a unified manner? You would have to treat them as separate stakeholders. Even if they did have the same perspective and/or initial policy position, they are not likely to take action together, thus should be treated as separate stakeholders regardless.
A group can be considered a stakeholder if they are seen as likely to take unified nonmarket action. For example, there may be some individuals that belong to the National Federation for the Blind (NFB) that would prefer to not have artificial noise, but the NFB will act as a single, unified group, so the NFB is considered a single stakeholder. The approximate percentage of individuals within a group that support a position or course of action can affect the strength of a position and likelihood of a stakeholder taking action. This will become clearer when we go over supply of and demand for nonmarket action later in this lesson, but this should make intuitive sense. For example, the likelihood of the NFB taking action is higher if nearly all of its members are in favor of artificial noise than if barely a majority are. Of course there are a near infinite number of degrees in-between these positions.
When performing nonmarket analysis, you must take into consideration the (dis)unity of stakeholders within a group. Be warned that this often involves well-informed, but imperfect calculations and considerations. Reality can be a messy place, especially when human behavior is involved!
Demand for Nonmarket Action
So now we have an issue, and we have stakeholders, and each of those stakeholders has a position on the issue. What is the likelihood of these stakeholders taking nonmarket action? That is, of participating in activities such as "lobbying, grassroots and other forms of constituent activity, research and testimony, electoral support and public advocacy?" (Baron, 2010, p. 155).
To understand the likelihood of a stakeholder participating in nonmarket activities, we use the concepts of supply and demand. Baron (2010) describes it well:
The extent of these [nonmarket] activities is a function of their costs and benefits, and the optimal amount of nonmarket action maximizes the excess of benefits over costs for the interest [stakeholder].
To assess the nonmarket actions of interests [stakeholders], the supply-and-demand framework from economics can be used. The demand side pertains to the benefits associated with nonmarket action on an issue, and the supply side pertains to the cost of taking, or supplying, nonmarket action. An increase in the benefits results in more nonmarket action, and an increase in the costs results in less nonmarket action (Baron, 2010, p. 155).
The Demand for Nonmarket Action
The demand for nonmarket action comes from the consequences of the issue outcome on the various stakeholders. "For firms, those consequences are reflected in sales, profits, and market value. Employee interests are measured in terms of jobs and wages. For consumers, the consequences are measured in terms of the price, qualities, and availability of goods and services" (Baron, 2010, p. 155).
Demand for nonmarket action can be understood in terms of three factors:
- Per capita benefits are benefits to an individual stakeholder (a person or firm). For example, benefit of changes in tax code to an individual taxpayer.
- Aggregate benefits are the total, or sum, of the per capita benefits across a stakeholder group. For example, benefits to all "taxpayers" from a change in tax code. When "aggregate benefits are widely distributed, per capita benefits can be small, providing little incentive for market action" (Baron, 2010, p. 156). Per capita and aggregate benefits are usually correlated (high per capita benefits often have high aggregate benefits, and vice versa), but not always. (See below for an example of this.)
- For some issues, "the benefits of nonmarket action can be obtained through other means, referred to as substitutes. The benefits from nonmarket action are lower when there are other means of generating them, and the closer these substitutes come to replicating the benefits, the smaller are the incentives to act. Substitutes may be available in the market environment or nonmarket environment" (Baron, 2010, p. 156). For example, voters in favor of a carbon cap-and-trade policy may instead accept a carbon tax policy. The latter policy could be seen as a substitute means of accomplishing the same (or nearly the same) benefits as the original issue (cap-and-trade). Note that cap-and-trade has its own issue. A carbon tax represents a separate issue, but can affect the strength of a stakeholder's demand for cap-and-trade. Regarding the hybrid car issue, a substitute for artificial noise could be automatic braking, which could avoid pedestrian accidents. Interestingly, back when the aforementioned study was done (2009) this was not a viable option, but as of 2019 it is a very strong substitute and would likely limit the demand for action on the issue. All else being equal, as the viability and number of potential substitutes increases, the demand for the nonmarket action decreases.
Note that per capita and aggregate benefits can be related to the (dis)unity of the group noted in the previous page. Some members within a group may not receive any benefits, or a lot, and all points between. This may be a cause or effect of disunity, but either way should be taken into consideration. As more members receive more benefits, the per capita and aggregate benefits increase. Aggregate and per capita benefits usually operate in lock-step, but they may have different impacts on the demand for an action. For example, if all taxpayers in the U.S. were to receive a very small tax break - let's say $25/year for argument's sake - then the per capita benefits would not be very large and thus demand not likely significant. However, the aggregate benefits would be substantial, since there are over 140,000,000 taxpayers [24] in the U.S. and thus would indicate a relatively high demand. Overall, as per capita and/or aggregate benefits increase, likelihood of nonmarket action increases.
In sum, demand for nonmarket action--the benefits motivating a stakeholder to take action--are a result of the individual (per capita) benefits, the aggregate benefits, and the presence (or lack of presence) of substitute ways to achieve the same benefits.
Supply of Nonmarket Action

The supply of nonmarket action depends on the cost of taking the action and the ability of the stakeholder to be effective in taking action. To make a difference on an issue, a stakeholder needs to have the resources necessary to execute and have enough influence to be effective.
The cost of organizing includes those costs "associated with identifying, contacting, organizing, motivating and organizing those with aligned interests. If the number of affected individuals or groups is small, the costs of organizing are likely to be low. When the number is large, those costs can be high. Taxpayers are costly to organize because they are numerous and widely dispersed, whereas pharmaceutical companies are relatively easy to organize. The costs of organization can be reduced by associations and standing organizations. Labor unions, the Sierra Club and business groups such as [Chambers of Commerce] reduce the cost of organizing for nonmarket action." (Baron, 2010, p. 156)
I would like to take a moment to stress the above points, since it has been a point of confusion in past sections of this course. First, remember that the intent of analyzing supply and demand in this context is to evaluate the likelihood of taking action on an issue. Just "caring about" or "considering" an issue is not the same as taking action. Second, generally speaking, the larger the group the higher the cost to organize, which in turn reduces the potential action or "supply" side of the nonmarket framework. As indicated above, U.S. taxpayers are incredibly difficult to organize into action. However, organizing a small stakeholder group such as a local libertarian organization with a few dozen members to act on tax law should be very easy, and thus would have a very low cost. However, the impact may not be as great with a smaller number of people. The other extreme of this is if a stakeholder is an individual person. It hopefully goes without saying that it should be easy for a single person to "organize" themselves into taking action. Finally, groups that are already very well-organized may have low organizing costs, regardless of size. As noted above, labor unions are a good example of this. This is because one of their primary functions is to try to influence issues on behalf of their members. It usually does not take a lot of effort to get their members to take action and therefore, they have a ready "supply" in a nonmarket framework.
Effectiveness is the impact a stakeholder's nonmarket action will have on the outcome of an issue. Nonmarket action is more effective when a stakeholder group has more members, their resources are greater and when the group has extensive coverage of legislative districts.
Effectiveness can be understood in terms of three factors:
- The greater the number of members in a stakeholder group, the greater its potential effectiveness for action. For example, the potential impact of an individual person on a federal tax law is almost immesurably small under most circumstances. This reduces the "supply" side of the framework and reduces the likelihood of action being taken. Compare this to an organization with millions of members, which is more likely to impact a federal tax law if they act in a unified manner. Their "supply" side of the framework (or potential for action) would be much greater than the individual.
- Coverage is a measure of the geographic location of stakeholder group members relative to the scale of the issue. For example, if the issue is national in scale, then having most stakeholders in one or two states means that coverage is minimal. If the issue will be decided on a state level, then you should consider how much of the state has interest group members. Particularly for issues addressed in legislative arenas, the effectiveness of nonmarket action depends on the geographic location of interest group members. "Nonmarket strategies based on the constituency connection between voters and their representatives are more effective the greater the number of political jurisdictions covered by the group. Although small businesses do not have the resources of large businesses, they are politically effective because they are numerous and located in every political jurisdiction" (Baron, 2010, p. 157).
- And finally, effective nonmarket action requires resources to fund and execute research, lobbying, legal services, grassroots campaigns and the group's administrative staff. Resources can be financial, or power-/knowledge-/skill-based. A poorly funded organization that has powerful, highly skilled, and/or politically connected members still has a significant resource base despite not having finanical resources. The greater a group's stake in an issue (the more it stands to win or lose), the greater are the resources that potentially would be contributed to a nonmarket strategy. Let's go back to the hypothetical tax law example. If an individual is a billionaire with high-powered political connections (e.g. one of the Koch brothers or Michael Bloomburg), then even though they have a minimal number of members (one each), the amount of resources they have indicated that they are very likely to take action on a nonmarket issue of concern to them. Notably, if the tax in question would have a large impact on their business (e.g. a carbon tax, which would significantly impact the Koch's petroleum interests), they are more likely to use their resources to influence the issue because this would increase their demand for the issue.
Importance of Coverage in Nonmarket Action
Automobile assembly plants are concentrated in a relatively small number of congressional districts, but the coverage of the auto companies' dealer and supplier networks is extensive. General Motors CEO Rick Wagoner attended the national auto dealers convention in 2008 to deliver a message and generate coverage of state political jurisdiction. The issue of concern to Wagoner was the possibility that states would enact their own regulations on greenhouse gas emissions to force large increases in automobile and truck fuel economy. Wagoner's message was, "We need to work together to educate policymakers at the state and local levels on the importance of tough but national standards." Wagoner explained why dealers were important in implementing General Motor's strategy at the state level, "Dealers are very effective in the political process because we don't have a plant in every state. We have dealers in every state." (San Jose Mercury News, February 10, 2008) The greater the coverage by members of an interest group, the greater the supply and the more effective is its nonmarket action. (Baron, 2010, p. 157)
A stakeholder's effectiveness--ability to impact the outcome of an issue and thus likelihood to take action to influence the use--depends on the number of members, their geographic location and resources available to support nonmarket activities.
Nonmarket Analysis
Nonmarket analysis refers to how we organize and draw inferences from the information we’ve assembled about the issue and for each stakeholder. Working in a structured manner, this analysis involves five fundamental steps. (You will address each of these step in your Case Study project throughout the semester)
- Define the issue. Remember from a previous page that "an issue is defined as a specific policy question with a uni-dimensional set of possible policy alternatives (outcomes)." Please keep this in the back of your mind, as you will be asked at various points in this course to identify issues. (For issue examples, see the Case Study options.)
- Collect background on issue. Document key terms and concepts, historical context, status and timeline.
- Identify and profile stakeholders. Name of stakeholder (firm, association, group or individual), type of organization and mission. Establish an initial position on the issue and explain benefits the stakeholder expects to realize from taking this position on this issue.
- Assess demand for and supply of non-market action across stakeholders. For each stakeholder, evaluate demand for nonmarket action (available substitutes, aggregate benefits, per capita benefits) and supply for nonmarket activities (effectiveness and cost of organizing).
- Predict the amount of nonmarket action that a stakeholder can be expected to take. This is established by weighing the demand (benefits) of taking action with the supply (resources required) to take action. The greater the benefits, the more likelihood of taking action. The greater the cost (and considering available resources), the less likelihood of taking action.
In the following lessons and accompanying case study, we will work through each step of nonmarket analysis and demonstrate a framework for organizing and presenting a nonmarket analysis summary.
RPS Case Study, Part 1
The framework of this Case Study reflects actual Pennsylvania policy and data. All information about stakeholders, especially assessments related to the likelihood of participation in nonmarket action and the strategy that may or may not be evoked is the author's opinion and presented in a manner to best demonstrate the lesson content of this course. This Case Study does not necessarily represent the actual position or strategy held or planned by any named stakeholder.
ISSUE
Do you support or oppose [28]Senate Bill 300 [29]?
Background
In 2004, Pennsylvania enacted the Alternative Energy Portfolio Standards (AEPS) Act [30] ("Act 213 [31]"), which provides “for the sale of electric energy generated from renewable and environmentally beneficial sources, for the acquisition of electric energy generated from renewable and environmentally beneficial sources by electric distribution and supply companies and for the powers and duties of the Pennsylvania Public Utility Commission.” Here [32]is the full text of the Public Utility Commission's Implementation Order, if you are inclined.
The type of policy covered by the AEPS Act exists in other states where it is most often called “Renewable Portfolio Standards" (RPS). For a full description of RPS programs across the country, including definitions, data and summary maps, see the Database of State Incentives for Renewable and Efficiency (DSIRE) website [33](You can search for Renewables Portfolio Standard under "program type." [34]). DSIRE is well-known, and dare I say the "go to" website for information about national and state-by-state energy policies in the U.S. The most current AEPS data available for Pennsylvania is 2021, as shown in the graphs and tables below.
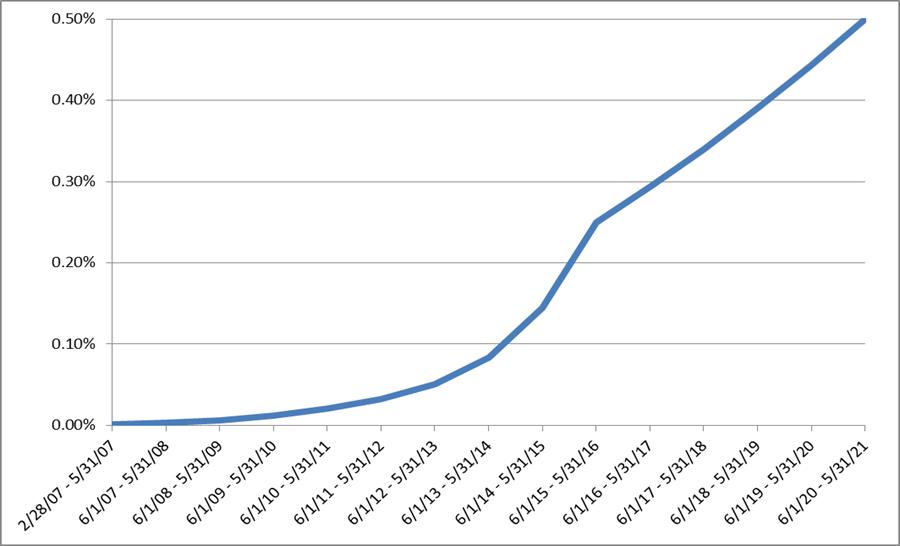
Among other things, the AEPS Act established that a certain percentage of the electricity sold in Pennsylvania must come from renewable energy sources and a specific percent must come from solar energy. (The latter is often referred to as a “solar carve out,” for obvious reasons.)
The exact percentages that must come from solar per Act 213 are shown here, in chart and table form.

To comply with the Act, businesses that sell electricity in Pennsylvania are required to submit alternative energy credits (AECs) corresponding to the currently required percentage. (The term “AEC” is specific to PA and means the same thing as renewable energy credit or “REC”, the more widely used terminology.)
A REC is an electronic certificate indicating that 1,000 kWhs (1,000 kWh = 1 MWh) of electricity has been generated from renewable fuel sources. When the fuel source is solar, it is usually called an SREC ("solar renewable energy credit"), but is officially termed an SAEC ("solar alternative energy credit") in Pennsylvania. Moving forward in this course, all solar credits will be referred to as SRECs to avoid confusion.
Solar Power Generation and Credits
Solar electric systems have a power rating that indicates their capacity to generate electricity from the sun. Power ratings are given in Watts. A kilowatt (kW) equals 1,000 Watts and a megawatt (MW) equals 1,000,000 watts. Electricity that is generated is energy measured in watt-hours, often kilowatt hours (kWh) or megawatt-hours (MWh). (For a review of energy and power, feel free to re-engage with the EGEE 102 course website [36]).
For example, a home in Pennsylvania with a 5 kW solar electric system will likely generate about 6,000 kWh per year (this depends on a lot of factors such as shading and orientation/azimuth). The owners of this system will earn six SRECs per year since 6,000 kWh = 6 MWh. These owners can sell their SRECs to the businesses (utilities) in PA that must comply with the AEPS. As long as the system is grid-tied (connected to the electrical grid), the owners are entitled to earn and trade SRECs. It does not matter where the electricity is used or by whom. Please note that partial SRECs are not always accepted for sale. Annual SREC totals from an individual supplier thus may be rounded down to the nearest whole SREC. (So even if the above mentioned system generated 6,200 kWh or even 6,900 kWh, they may only get credit for 6 SRECs.) Pennsylvania allows partial SRECs, so they can be included in SREC calculations.
How SRECs Impact the Market
When a utility is forced (by the AEPS Act) to buy SRECs, it adds to the cost of electricity because they must be allowed to recover these extra costs. This causes the price of electricity to rise for all customers (“ratepayers”), however minimal. The more SRECs the business must purchase and the higher the cost of the SRECs, the greater the increase in electricity prices for all ratepayers. (Keep in mind that this rate increase is almost certainly minimal, significantly less than $0.01 per kWh.)
SRECs are most often traded on the open market, though some special SREC incentive programs and auctions exist in some states. They are essentially auctioned off to businesses who need to purchase them. [For more detail about how this process works, see PJM EIS [37], the administrator of the Generation Attribute Tracking System (GATS). This video [38] provides a nice summary of how RECs are generated and tracked].
Solar electric system owners want to get as high a price as possible for their SRECs. The businesses that must comply with the AEPS want to pay as low a price as possible. The actual price (“settlement price”) is set by supply and demand (again, there are special auctions in some states, but this is the exception, rather than the rule).
The percentages in the AEPS drive demand. The higher the percentage, the greater the number of required SRECs for compliance. This demand, in turn, drives supply. If a small business owner is thinking of putting in solar, the prospect of being able to sell SRECs may make the owner more inclined to pony up the significant capital that is required to install a solar electric system. The potential for SREC revenue may also make the bank more likely to approve a loan for the installation.
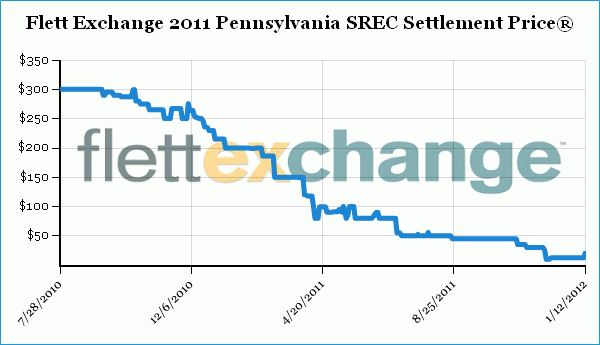
In 2008, the average settlement price in Pennsylvania for an SREC was $230. In 2009, the average was $260. (Note that this is $0.26/kWh, which was approximately double the cost of electricity at that time.) In 2010, the average was $325. In January 2012, the settlement price was $20 and by December of 2016 it had dropped to $7! (The price has been hovering in the $45 range in the summer of 2022 [39]. As a point of reference, SREC prices were in the $220 - $230 range in New Jersey and $340 - $400 range (!) in Washington, DC throughout 2021. For real-time pricing of these and other regional state markets, see Flett Exchange [40] or SRECTrade [41].) The images below provide a snapshot of PA prices in 2010 when prices were good, and in 2020 - 21, when they were significantly lower.

What happened? In 2009, Pennsylvania opened a rebate program for solar projects (solar electric and solar hot water). Along with other temporary factors, this caused the industry in Pennsylvania to surge—installing 46.5 MW in 2010. (In 2009, 4.4 MW were installed.) In fact, according to the Interstate Renewable Energy Council [43], Pennsylvania was 6th in the country in 2010 for newly installed solar electric capacity.
This surge in supply swamped the percentage of solar electricity required by the AEPS and SREC prices plunged. The consequences of this were widespread. Consumer interest in buying and installing new systems dropped considerably. With SREC returns this low, lenders would not finance projects. Solar installers closed shop or moved out of state. Existing solar installations were in trouble with revenue from SRECs falling far below expectations.
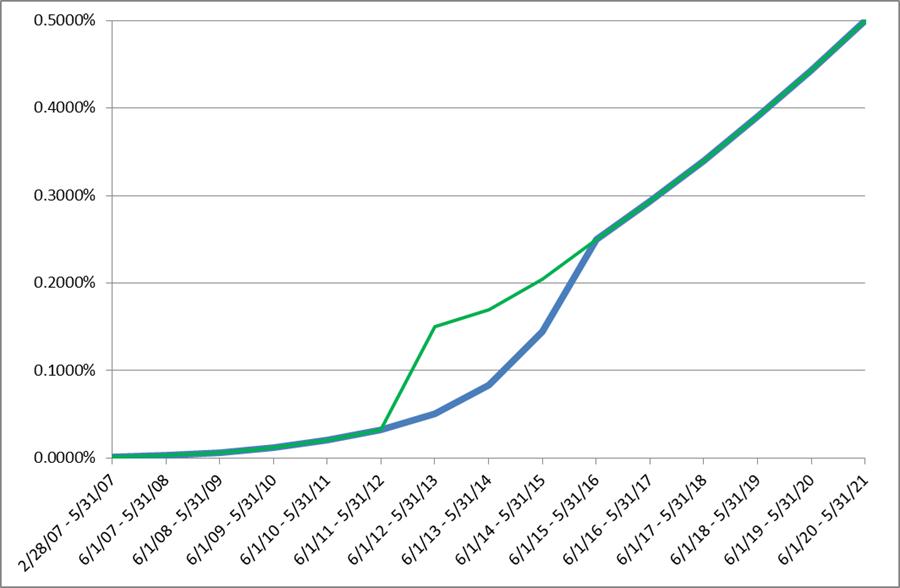
In response, a bill was proposed in the state House of Representatives that would accelerate the ramp-up of required percentages for solar electricity. The proposed increase for years June 2012 - May 2013 to June 2015 - June 2016 is shown in the figure below.
In addition to increasing the RPS percentages in the near term, the bill would also “close” PA borders. Under the original policy, electricity retailers can buy SRECs from a solar generation facility anywhere within the PJM region, which includes all or parts of Delaware, Indiana, Illinois, Kentucky, Maryland, Michigan, New Jersey, North Carolina, Ohio, Pennsylvania, Tennessee, Virginia, West Virginia, and the District of Columbia.
Status
Sponsored by Chris Ross (R-Chester), PA House Bill 1580 had 111 co-sponsors [44]. However, neither the House nor Senate was able to put it to vote before the legislative session ended and the 2012 election took place. Since then, several new bills have been announced to revise the AEPS targets but as of yet, none have been put to vote. In principle, this "issue" remains alive in PA. However, in April of 2018, the PA Public Utility Commission (PA PUC) issued a final implementation order [45] to Act 40 of 2017. This Act achieves part of PA House Bill 1580 by requiring all new SRECs to be generated by facilities inside of the state's borders. There are some exceptions, notably SREC contracts signed with out-of-state systems prior to October 30, 2017 and SRECs that have been "banked" (saved for future years), which can be used for a period of 3 years. Flett Exchange summarizes Act 40 of 2017 thus: "The commission ruled that unless an out of state solar facility has a binding contract for their SRECs with a renewable portfolio standard (RPS) buyer prior to October 30th 2017 the out of state solar facility will no longer have PA state certification on their SRECs after October 30th 2017. The SRECs generated (month of generation) prior to October 30th 2017 from an out of state solar facility will retain their PA state certification and the SRECs remain eligible for the full 3 compliance years."
Senate Bill 501 [46] is a bipartisan bill that was introduced in April of 2021, but died in subcommittee. According to SRECTrade, the bill would have "increase the state’s Tier I requirement from 8% to 18% by 2026..., increase the state’s solar carve-out from 0.5% at present to 5.5%, with 3.75% of the carve-out being sourced from in-state utility-scale solar (projects larger than 5 MW) and 1.75% from in-state distributed solar (smaller, interconnected residential and commercial projects). Notably, the legislation would also establish a limit on the cost of alternative energy credits (AECs, PA’s renewable energy credits) and facilitate long-term contracting in an effort to help minimize ratepayer impacts. Lastly, the legislation would also initiate a study on renewable energy storage in the state." (Source: SRECTrade [47], April 2021). It is not clear if it has enough support to pass, but it is a rare piece of major renewable energy legislation that is bipartisan.
Senate Bill 300 [29] (introduced as SB 230):
- "Expands the AEPS Tier I requirement from 8% to 30% by 2030, including 8% for in-state grid-scale solar, 2% for community solar, and 4% for in-state distributed generation solar;
- Enables community solar projects that are not currently permitted in Pennsylvania. Community solar allows people who cannot install solar on their properties to subscribe to a portion of the energy generated by a solar system located in their community, which would be credited to their electric bill."
- Referred to the Senate Consumer Protection and Professional Licensure committee as of March 15, 2023.
The above information on SB 300 was found on the State legislative tracking website: Center, L. D. P. (n.d.). Senate Co-Sponsorship Memoranda. The Official Website for the Pennsylvania General Assembly. https://www.legis.state.pa.us/cfdocs/Legis/CSM/showMemoPublic.cfm?chambe... [48]
Required Reading:
Pennsylvania Has Fallen Behind on Clean Energy Goals, but New Leadership in Harrisburg Could Give Rise to Policy Changes [49], Teague, C. (2023).
For a good summary of recently introduced legislation, as well as some other information about solar policy in PA, see this summary [50] from the Pennsylvania Solar Center.
A Short Note Regarding Energy and Financial Calculations
Most of this should be a review from EGEE 102, but this will help provide some perspective on this case study (and help you with this week's assignment!).
- If electricity costs $0.15/kWh and you use 100 kWh, it will cost you: $0.15/kWh x 100 kWh = $15.00
- There are 1000 kWh in an MWh
- A commonly-used economic indicator in renewable energy and energy efficiency projects is "simple payback." Simple payback indicates how long something will take to pay for itself, ignoring ongoing costs such as maintenance. To calculate simple payback, you simply (no pun intended) divide the upfront cost (after incentives) by the annual savings you will realize by implementing the measure. For example, let's say I spend $5 to buy an LED to replace an incandescent bulb. I calculate that it will save me $4/yr in electricity costs. My simple payback would thus be: upfront cost/annual savings = $5/$4 per yr. = 1.25 years.
- As indicated above, SRECs add value to your solar PV array. Let's say you have an array that will generate ~6,000 kWh/yr, which is 6 MWh and thus 6 SRECs. Because Pennsylvania has a "net metering [51]" law, the utility must pay you the same for electricity generated by your system that you pay them for the electricity that they supply. (This varies a bit by state, but most net metering states require the utility to pay at or near the full retail price that you pay). So if you pay $0.12/kWh, they pay you $0.12/kWh for each kWh your system generates. (The power company will not actually "pay" you for this. It will just take this off of your monthly bill.) Net metering also means that if you generate more electricity than you are using - say, on a nice summer day or sunny winter day - then that extra electricity will be used to compensate for times when you are using more electricity than you are generating. It goes beyond the scope of this lesson, but the amount that the utility "pays" the customer varies from state to state, as indicated above. It may just be the generation/supply cost, the transmission cost, and/or the distribution cost. The utility always recoups at least some of the cost through a monthly customer fee.
- Net metering is a very important (and increasingly controversial in some states) incentive for solar, but remember that SRECs provide an additional incentive. In the glory days of 2008, you would have gotten: 6 SRECs x $230/SREC = $1,380 in addition to your savings (this does usually come as a check). But in 2015 you would have probably received: 6 SRECs x $20/SREC = $120. Quite a big difference, eh? That is why SRECs is such an important policy mechanism. They can substantially alter the financial calculation for renewable energy systems.
When the SREC prices were so high in PA, soon after the AEPS was adopted, it was common to get paybacks in the range of 7-10 years. But now, even with low SREC prices, a building with good solar exposure can usually expect to have a simple payback of 7-10 years or less, depending on financing, state incentives, and a few other considerations. This is mainly due to lower prices for solar panels. In a good SREC market, simple paybacks can be in the sub-5 year range, which was unheard of a few years ago. It is a very dynamic marketplace due to a mixture of market and nonmarket forces!
Lesson 1 Assignment
Weekly Activity 1
Complete Quiz 1 located in under the Modules tab. The activity may include a variety of question types, such as multiple choice, multiple select, ordering, matching, and true/false (in some cases these require independent research and may be quantitative). Be sure to read each question carefully.
Unless specifically instructed otherwise, the answers to all questions come from the material presented in the course lesson. Do NOT go "googling around" to find an answer. To complete the Activity successfully, you will need to read the lesson, and all assigned readings, fully and carefully.
Each week, a few questions may involve research beyond the material presented in the course lesson. This "research" requirement will be made clear in the question instructions. Be sure to allow yourself time for this!
This Activity is to be done individually and is to represent YOUR OWN WORK. (See Academic Integrity and Research Ethics [52] for a full description of the College's policy related to Academic Integrity and penalties for violation.)
The Activity is not timed, but does close at 11:59 EST on the due date as shown on the Calendar.
If you have questions about the assignment, please post them to the "Questions about EME 444?" Discussion Forum. I am happy to provide clarification and guidance to help you understand the material and questions (really!). Of course, it is best to ask early.
Summary and Final Tasks
In this lesson, we learned about the nonmarket environment and a framework for collecting information for nonmarket analysis. The framework includes an issue, stakeholders, and assessment of the demand for and supply of nonmarket action. We applied the begging phases of the nonmarket analysis process to a Case Study where the issue is related to a Renewable Portfolio Standard (RPS) program. The information collection process provided hands-on experience with the structure and mechanics of RPS programs, an important policy type for renewable energy development.
You learned:
- the meaning of nonmarket environment;
- to identify nonmarket issues, stakeholders, and initial policy positions;
- a framework for organizing information collection related to nonmarket analysis;
- how to assess demand for and supply of nonmarket action;
- the structure, terminology, and mechanisms related to renewable portfolio standard (RPS) programs.
Have you completed everything?
You have reached the end of Lesson 1! Double-check the list of requirements on the first page of this lesson to make sure you have completed all of the activities listed there.