7 Natural Gas
Introduction
Overview of Lesson 7
With this lesson, we continue our survey of energy industries based on energy sources. In this lesson, we will review the natural gas industry--including exploration and extraction, transportation, resource estimates, demand and, usage and externalities.
What will we learn?
By the end of this lesson, you should be able to...
- describe sources of natural gas;
- provide a simple explanation of seismology and its role in resource exploration;
- understand and use concepts and terminology related to on- and off-shore natural gas extraction;
- describe major components of the US natural gas pipeline system;
- explain benefits and uses of liquefied natural gas (LNG);
- discern qualifiers in resource allocations, and report on current estimates;
- weigh the relative advantages and externalities of hydraulic fracturing;
- about methane leakage and related considerations.
What is due for Lesson 7?
The table below provides an overview of the requirements for Lesson 7. For details, please see individual assignments.
Please refer to the Calendar in Canvas for specific time frames and due dates.
|
REQUIREMENT |
SUBMITTING YOUR WORK |
|---|---|
| Read Lesson 7 content and any additional assigned material | Not submitted. |
| Weekly Activity 7 | Yes—Complete Activity located in the Modules Tab in Canvas. |
| Case Study--work with others on your Team to prepare Case Study, following course guidelines | Check Canvas calendar for all Case Study Due Dates. |
About Natural Gas

What is Natural Gas?
Natural gas, like other fossil fuels (coal and oil), is formed from the ancient decaying remains of plants and animals. Over millions of years, pressure and heat change some of this organic matter into natural gas trapped as bubbles beneath and in layers of rock. Natural gas formed in this way is known as thermogenic gas.
The primary component of natural gas is our old friend methane, CH4, usually around 70 to 90%. Natural gas also contains ethane, propane, butane and may have some carbon dioxide, oxygen, nitrogen, hydrogen sulphide and trace amounts of rare gases (e.g. A, He, Ne, Xe).
Natural gas is also created through biogenic processes. ("Biogenic" means produced by living organisms.) In this type of process, small microorganisms (bacteria) chemically break down (digest) organic matter to produce methane. These microorganisms are anaerobic, meaning they thrive in environments that have no oxygen. They live in shallow sediments, marshes, bogs and landfills, as well as the intestines of most animals, including humans.
One example of biogenic methane (or biogas) is landfill gas. New technologies allow this gas to be harvested and added to the supply of natural gas.
Anaerobic processes for producing methane may also be managed in a digester (an airtight tank) or a covered lagoon (a pond used to store manure) for waste treatment.
Natural gas can be a confusing term. We put "gas" in our car, but this is not "natural gas." The "gas" we use in our BBQs is propane (which is also known as liquid petroleum gas, or LPG), commonly found in natural gas, but not natural gas itself.
And while we're at it, another interesting thing about natural gas...in its natural form, natural gas is odorless. The "rotten egg" smell is added before it gets to the end user for safety reasons to help detect leaks. (Yes, someone chose that smell.) The odorant is called mercaptan.
Units of Measure
Like other gases, natural gas is commonly measured as a volume expressed as hundreds of cubic feet (ccf), thousands of cubic feet (Mcf), millions of cubic feet (MMcf) or billions and trillions of cubic feet (Bcf and Tcf, respectively).
Another way natural gas may be measured is by its energy or heat content, expressed as British Thermal Units, or BTUs. A BTU is the amount of natural gas required to heat one pound of water one degree. One cubic foot of natural gas contains about 1,027 BTUs, and thus 1 ccf contains about 102,700 BTUs. Residential natural gas is usually sold in ccfs. A therm, sometimes used for billing purposes, is exactly 100,000 BTUs.
Finding and Extracting Natural Gas
Exploration
The section below gives an overview of the exploration activities necessary to locate natural gas resources. Most of the content has been excerpted from Exploration [2]. If you would like more information and far more detail (and pictures!), you are encouraged to consult this source.
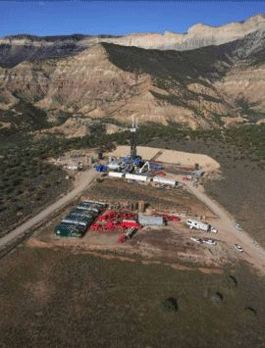
"Exploration for natural gas typically begins with geologists examining the surface structure of the earth, and determining areas where it is geologically likely that petroleum or gas deposits might exist. . . . By surveying and mapping the surface and sub-surface characteristics of a certain area, the geologist can extrapolate which areas are most likely to contain a petroleum or natural gas reservoir.
"Seismology, . . . the study of how energy, in the form of seismic waves, moves through the Earth's crust and interacts differently with various types of underground formations, . . . [is also] used to help locate underground fossil fuel formations.
"The basic concept of seismology is quite simple. As the Earth's crust is composed of different layers, each with its own properties, energy (in the form of seismic waves) traveling underground interacts differently with each of these layers. These seismic waves, emitted from a source, will travel through the earth, but also be reflected back toward the source by the different underground layers. Through seismology, geophysicists are able to artificially create vibrations on the surface and record how these vibrations are reflected back to the surface, revealing the properties of the geology beneath.
"An analogy that makes intuitive sense is that of bouncing a rubber ball. A rubber ball that is dropped on concrete will bounce in a much different way than a rubber ball dropped on sand. In the same manner, seismic waves sent underground will reflect off dense layers of rock much differently than extremely porous layers of rock, allowing the geologist to infer from seismic data exactly what layers exist underground and at what depth. While the actual use of seismology in practice is quite a bit more complicated and technical, this basic concept still holds"
Exploration [2], retrieved February 2014).
Seismology is also used for off-shore exploration, along with other techniques including measuring gravitational and magnetic differences and seismic imaging. Ultimately, the best way to gain a full understanding of subsurface geology and the potential for natural gas deposits to exist in a given area is to drill an exploratory well.
Extraction
To Read Now
Visit NaturalGas.org [3] (Website navigation is a little tricky, so direct links are below):
- Extraction [4]
- Onshore [5] (scan, read if you're interested and have time)
- Shale Shock: Hydraulic Fracturing [6]
- Offshore [7] (scan, read if you're interested and have time)
Transporting Natural Gas
Transportation Process and Flow
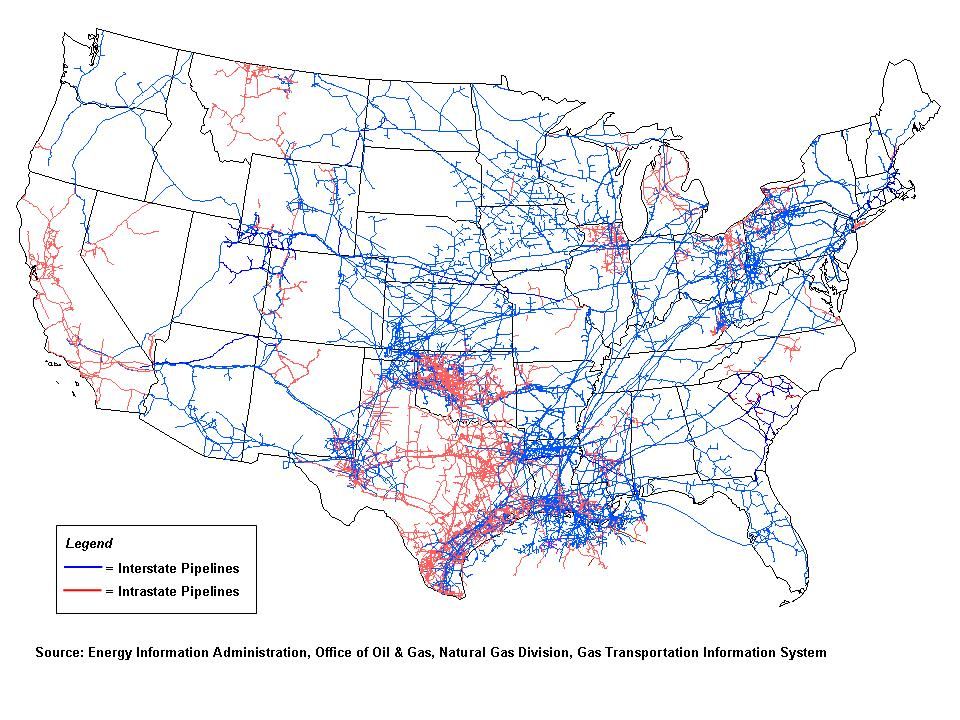
Like all energy sources, natural gas has to be available at the point of use. As a gas, the low density of natural gas presents special challenges for transportation. Because of its volume, it is not easily stored or moved by vehicle. For transportation across land, natural gas is usually moved through a network of pipelines. For transport across bodies of water, it is liquefied and carried by ship. The map below from the EIA shows the pipeline network in the U.S.
One if by Land
The section below describes the major components of the natural gas pipeline system in the United States. Most of the content has been excerpted from About U.S. Natural Gas Pipelines - Transportation Process and Flow [9]. (If you would like more information and far more detail, you are encouraged to consult this source.)
The Natural Gas Gathering System
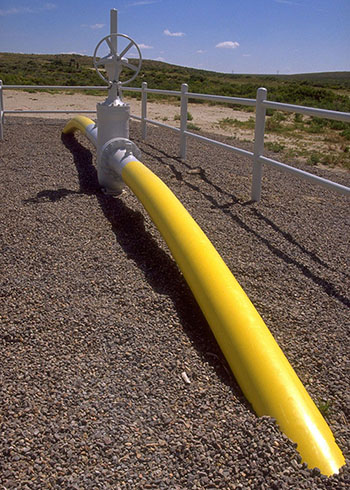
A natural gas pipeline system begins at a natural gas producing well or field. In the producing area many of the pipeline systems are primarily involved in "gathering" operations. That is, a pipeline is connected to a producing well, converging with pipes from other wells where the natural gas stream may be subjected to an extraction process to remove water and other impurities if needed. Natural gas exiting the production field is usually referred to as "wet" natural gas if it still contains significant amounts of hydrocarbon liquids and contaminants. . . .
Once it leaves the producing area, a pipeline system directs flow either to a natural gas processing plant or directly to the mainline transmission grid. Non-associated natural gas, that is, natural gas that is not in contact with significant quantities of crude oil in the reservoir, is sometimes of pipeline-quality after undergoing a decontamination process in the production area, and does not need to flow through a processing plant prior to entering the mainline transmission system.
The Natural Gas Processing Plant
At the wellhead, natural gas is usually a mix of mostly methane along with other hydrocarbons including ethane, propane, butane, and pentanes. Raw natural gas also contains water vapor, hydrogen sulfide (H2S), carbon dioxide, helium, nitrogen, and other compounds. This is why natural gas is sent to a processing plant after being extracted.
The principal service provided by a natural gas processing plant to the natural gas mainline transmission network is that it produces pipeline-quality natural gas. Natural gas mainline transmission systems are designed to operate within certain tolerances. Natural gas entering the system that is not within certain specific gravities, pressures, Btu content range, or water content level will cause operational problems, pipeline deterioration, or even cause pipeline rupture.
In processing, associated hydrocarbons (e.g., ethane, propane, butane, and pentanes) are removed and captured from natural gas and are known as "natural gas liquids " (NGLs), valuable by-products of natural gas processing. Natural gas processing plants also extract contaminants from the natural gas stream to produce pipeline quality "dry" gas, which is transported to end-users. "Dry" or "consumer grade" gas is almost pure methane and is what is used by consumers.
The Transmission Grid and Compressor Stations
The natural gas mainline (transmission line) is a wide-diameter, often-times long-distance, portion of a natural gas pipeline system, excluding laterals, located between the gathering system (production area), natural gas processing plant, other receipt points, and the principal customer service area(s). The lateral, usually of smaller diameter, branches off the mainline natural gas pipeline to connect with or serve a specific customer or group of customers. . . .
Between the producing area, or supply source, and the market area, a number of compressor stations are located along the transmission system. These stations contain one or more compressor units whose purpose is to receive the transmission flow (which has decreased in pressure since the previous compressor station) at an intake point, increase the pressure and rate of flow, and thus, maintain the movement of natural gas along the pipeline. . . .
To address the potential for pipeline rupture, safety cutoff meters are installed along a mainline transmission system route. Devices located at strategic points are designed to detect a drop in pressure that would result from a downstream or upstream pipeline rupture and automatically stop the flow of natural gas beyond its location.

Natural Gas Market Centers/Hubs
Natural gas market centers and hubs evolved, beginning in the late 1980s, as an outgrowth of natural gas market restructuring and the execution of a number of Federal Energy Regulatory Commission’s (FERC) Orders culminating in Order 636 issued in 1992. Order 636 mandated that interstate natural gas pipeline companies transform themselves from buyers and sellers of natural gas to strictly natural gas transporters. Market centers and hubs were developed to provide new natural gas shippers with many of the physical capabilities and administrative support services formally handled by the interstate pipeline company as “bundled” sales services.
Two key services offered by market centers/hubs are transportation between and interconnections with other pipelines and the physical coverage of short-term receipt/delivery balancing needs. . . .
Underground Storage Facilities
At the end of the mainline transmission system, and sometimes at its beginning and in between, underground natural gas storage and LNG (liquefied natural gas) facilities provide for inventory management, supply backup, and the access to natural gas to maintain the balance of the system. There are three principal types of underground storage sites used in the United States today: depleted reservoirs in oil and/or gas fields, aquifers, and salt cavern formations. In one or two cases mine caverns have been used. Two of the most important characteristics of an underground storage reservoir are the capability to hold natural gas for future use, and the rate at which natural gas inventory can be injected and withdrawn (its deliverability rate). . . .
Peak Shaving
Underground natural gas storage inventories provide suppliers with the means to meet peak customer requirements up to a point. Beyond that point the distribution system still must be capable of meeting customer short-term peaking and volatile swing demands that occur on a daily and even hourly basis. During periods of extreme usage, peaking facilities, as well as other sources of temporary storage, are relied upon to supplement system and underground storage supplies.
Peaking needs are met in several ways. Some underground storage sites are designed to provide peaking service, but most often LNG (liquefied natural gas) in storage and liquefied petroleum gas such as propane are vaporized and injected into the natural gas distribution system supply to meet instant requirements. Short-term linepacking is also used to meet anticipated surge requirements.
The use of peaking facilities, as well as underground storage, is essentially a risk-management calculation, known as peak-shaving. The cost of installing these facilities is such that the incremental cost per unit is expensive. However, the cost of a service interruption, as well as the cost to an industrial customer in lost production, may be much higher. In the case of underground storage, a suitable site may not be locally available. The only other alternative might be to build or reserve the needed additional capacity on the pipeline network. Each alternative entails a cost.
A local natural gas distribution company (LDC) relies on supplemental supply sources (underground storage, LNG, and propane) and uses linepacking to "shave" as much of the difference between the total maximum user requirements (on a peak day or shorter period) and the baseload customer requirements (the normal or average) daily usage. Each unit "shaved" represents less demand charges (for reserving pipeline capacity on the trucklines between supply and market areas) that the LDC must pay. The objective is to maintain sufficient local underground natural gas storage capacity and have in place additional supply sources such as LNG and propane air to meet large shifts in daily demand, thereby minimizing capacity reservation costs on the supplying pipeline (About U.S. Natural Gas Pipelines - Transportation Process and Flow [11]).
Two if By Sea
When natural gas is cooled to about -260°F, it becomes a liquid and, cleverly, is called Liquefied Natural Gas or LNG. In this form, it takes up about one six hundredth the volume of gaseous natural gas.
This has clear advantages for transportation and storage. Because it is easier to move, LNG can give "economically stranded" natural gas deposits access to markets.
LNG is shipped in specialized tankers with insulated walls. This makes it possible for countries that are separated by large bodies of water to import and export gas to one another.
LNG also makes it possible to store quantities of natural gas economically at sites where geologic conditions are not suitable for underground gas storage. This is especially important when LNG is stored at peak-shaving facilities, where it can be gasified and added to pipelines to meet consumer needs at times of peak demand. The videos below provide a good overview of the LNG production chain, including the liquefaction process. (Note that both videos have a closed-captioning option, and a link to the transcripts is available as well.) Please watch the following (3:44) and (2:23) videos:
PRESENTER: LNG, Liquefied Natural Gas. LNG is natural gas that has been cooled to at least minus 162 degrees Celsius to transform the gas into a liquid for transportation purposes.
To understand why liquefying natural gas is important, we first need to understand natural gas's physical properties. Methane has a very low density and is therefore costly to transport and store. When natural gas is liquefied, it occupies 600 times less space than as a gas.
Normal gas pipelines can be used to transport gas on land or for short ocean crossings. However, long distances and overseas transport of natural gas via pipeline is not economically feasible. Liquefying natural gas makes it possible to transport gas where pipelines cannot be built, for example, across the ocean.
The four main elements of the LNG value chain are, one, exploration and production, two, liquefaction, three, shipping, four, storage and regasification. At the receiving terminal, LNG is unloaded and stored before being regasified and transported by pipe to the end users.
The demand for LNG is rising in markets with limited domestic gas production or pipeline imports. This increase is primarily from growing Asian economies, particularly driven by their desire for cleaner fuels and by the shutdown of nuclear power plants.
The largest producer of LNG in the world is Qatar with a liquefaction capacity in 2013 of roughly one-quarter of the global LNG production. Japan has always been the largest importer of LNG and in 2013 consumed over 37% of global LNG trade.
The extraction process also has environmental and social issues to consider. LNG projects require large energy imports for liquefaction and regasification and therefore have associated greenhouse gas emissions.
Spills pose concerns to local communities. There have been two accidents connected to LNG. But in general, liquefaction, LNG shipping, storage, and regasification have proven to be safe. LNG projects require large upfront capital investments, which can be a challenge in moving projects ahead.
That's LNG.
PRESENTER: Heat and cold, Shakespeare told us to fear no more the heat of the sun nor the furious winter's rages, and natural gas now rises above other fuels to beat those forces back.
Natural gas is abundant, at least in some parts of the world, but how do we get it from regions that have it to regions that don't.? So we cool natural gas until it condenses into a compact liquid. Now we can ship it on special tankers.
Natural gas is mostly methane, with varying amounts of other hydrocarbons and impurities that can freeze and foul equipment. We remove the impurities in the pretreatment area of the LNG plant. Here we also remove heavy hydrocarbons, inert gases, and other gases that accompany the methane that is natural gas.
Now we can begin to liquefy this clean gas. Many technologies can do that, but also based on the same cyclic process that serves our kitchen refrigerators. That means we need some kind of refrigerant to remove heat from the gas, so it'll condense into liquid. Here's how it works.
First, the liquid refrigerant expands from a high pressure to a low pressure, turning it into a cold mixture of liquid and some vapor. Next, it passes through a heat exchanger that uses heat from the natural gas to turn the refrigerant into pure vapor. The natural gas is now a lot colder, and we can compress the refrigerant back to its high pressure. We cool the hot refrigerant in another heat exchanger until it condenses back into liquid, then we expand the refrigerant again to repeat the cycle.
The key to cooling condensing natural gas into LNG is flashing the liquid refrigerant. And once the gas is LNG, we store it in tanks at very nearly atmospheric pressure. Liquid natural gas looks like water, except that it boils off at room temperature. It's odorless, colorless, non-toxic, and virtually non-flammable.
The cryogenic LNG stays in these storage tanks at a constant temperature between minus 159 and 162 Celsius. Evaporation helps keep it cool and liquid while it's stored on land or in the ship. We capture the vapors and either burn them for fuel or we re-condense them and send them back to storage. Who then uses the LNG? Typically, a power plant or industrial user, they convert the liquid back to a gas, so it can be burned as a fuel or used as a feedstock.
More than half of today's LNG comes from just four countries-- Qatar, Indonesia, Australia, and Malaysia, but that's soon likely to shift. New natural gas discoveries promised to send Australia, the US, and Africa to the forefront.
The companies that build these plants have much to think about. Who will buy their gas? How best to meet buyer specifications. How much LNG will buyers want? Another thing, buyers have to make long-term commitments before suppliers can invest in new units.
If this is a golden age for natural gas, it rests upon vast ingenuity and daring. What gulfs of heat and cold we must cross to provide that Elixir of warmth anywhere in the world.
To Read Now
- Read "Liquefied Natural Gas (LNG) [12]" from the U.S. Department of Energy's Office of Fossil Energy.
- For some insight into the recent and projected global LNG market, read the 2023 Shell LNG Outlook [13]. Note in particular how the Russia-Ukraine conflict has affected the global LNG market.
- LNG is not embraced by everyone. Read "Canada’s LNG dreams fade as blockades add new costs to industry [14]" by Kevin Orland for some insight into some recent nonmarket action in Canada.
Optional Reading
- Browse through "LNG Monthly [15]" and "Summary of LNG Export Applications [16]" from the Office of Fossil Energy. (These are both linked to in the article above.)
- See "U.S. Liquefied Natural Gas Exports, A Primer on the Process and the Debate [17]" (Center for American Progress). This is an older reading, so the statistics are a little outdated, but the description of the process and other considerations are accurate.
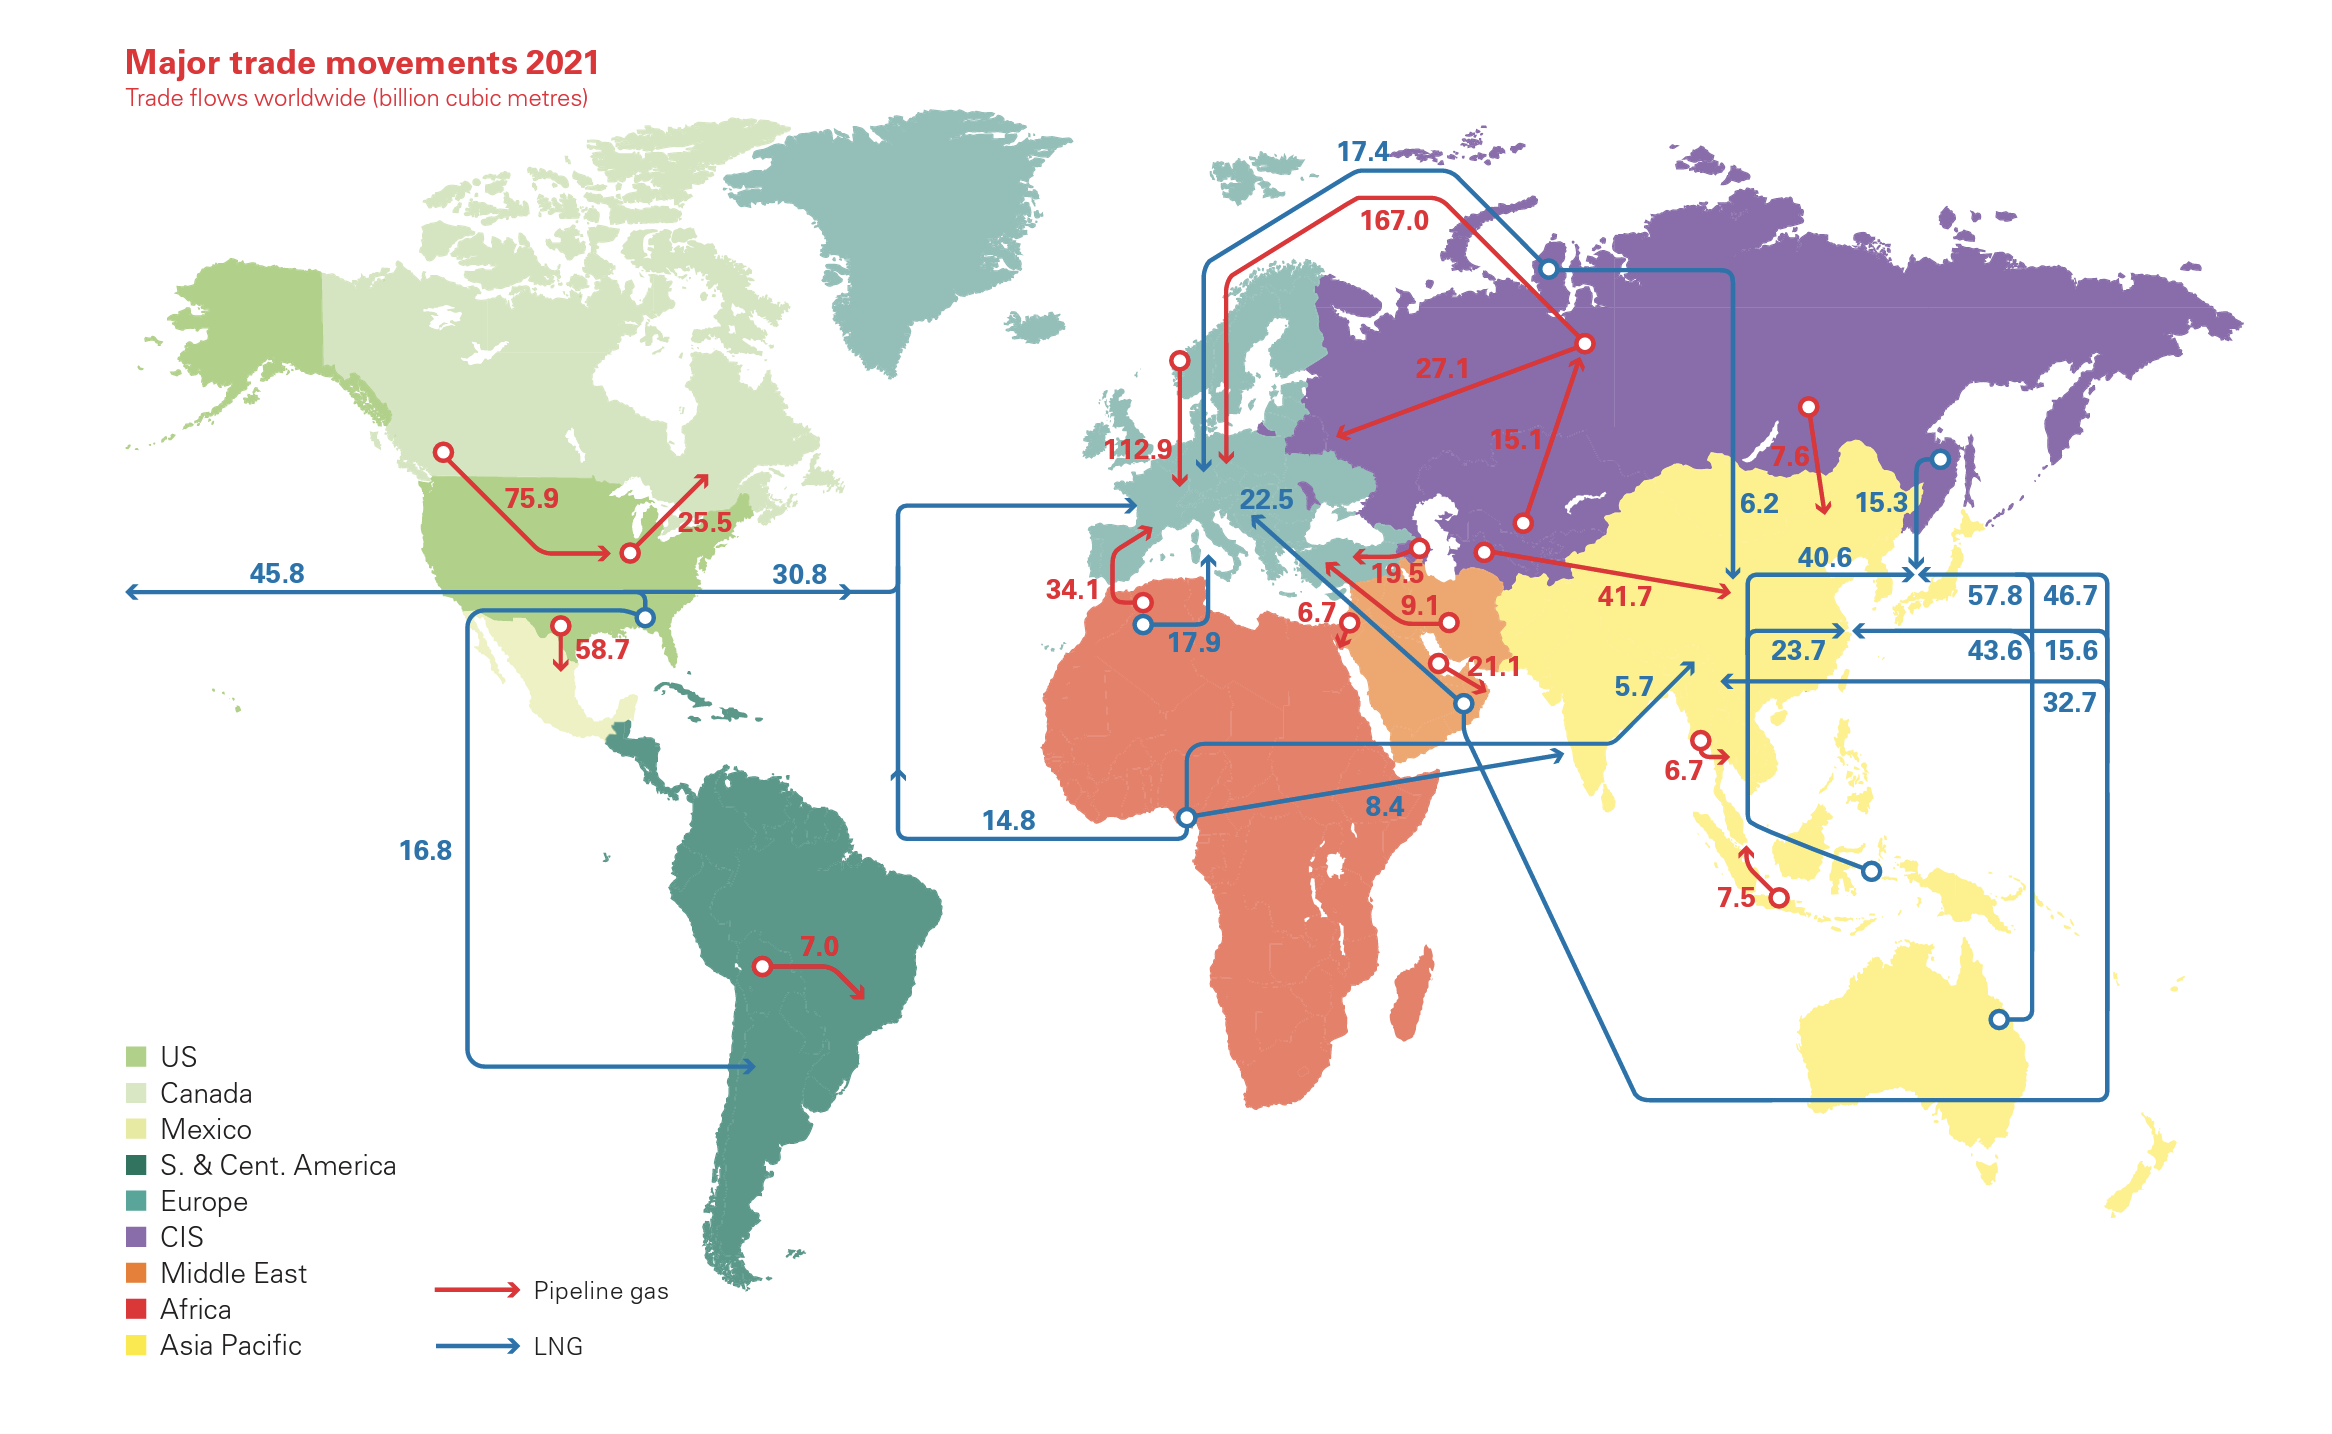
The map below, Major Trade Movements 2021, is from BP Statistical Review of World Energy 202 [18]2 (page 36). For a larger version of the map and more information (you may need to do this for this week's questions), please see the original source.
Where is Natural Gas located; how much is there?
To Read Now
- Go to the Energy Information Administration's (EIA's) International Energy Outlook 2019 [19] (IEO 2019). Read through the entire natural gas section. (Note that new versions of the IEO use the same model, so none of the projections have changed substantially.)
- (OPTIONAL) The EIA produces an IEO every year. The 2016 IEO (as I noted previously) provides more comprehensive information. Visit the IEO 2016 [20] and navigate to the "Natural Gas" section. Read or browse as much as you like.
This document includes the following chart, which provides a snapshot of projected natural gas consumption through 2040:
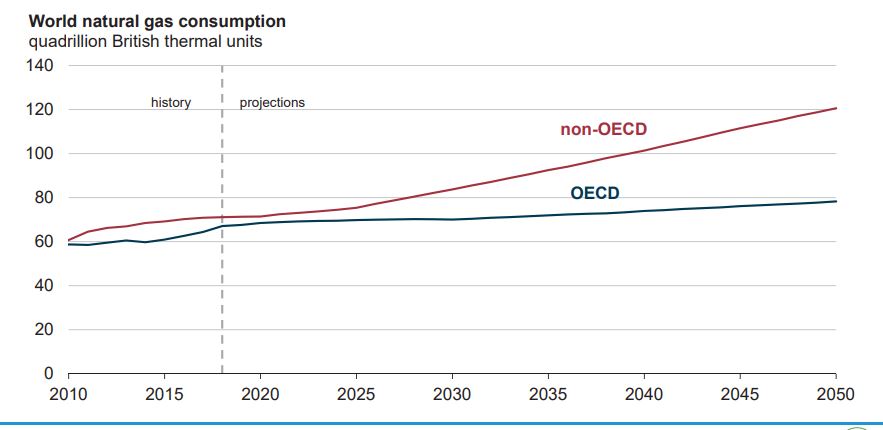
| Year | OECD | Non-OECD |
|---|---|---|
| 2015 | 59.0 | 65.1 |
| 2020 | 59.9 | 66.9 |
| 2025 | 62.0 | 76.0 |
| 2030 | 64.8 | 83.7 |
| 2035 | 69.1 | 93.2 |
| 2040 | 73.5 | 103.5 |
In the opening section, the 2016 Outlook report contains this statement, which emphasizes the role of unconventional natural gas reserves.
Although there is more to learn about the extent of the world's tight gas, shale gas, and coalbed methane resource base, the IEO2016 Reference case projects a substantial increase in those supplies—especially in the United States and also in Canada and China...The application of horizontal drilling and hydraulic fracturing technologies has made it possible to develop the U.S. shale gas resource, contributing to a near doubling of estimates for total U.S. technically recoverable natural gas resources over the past decade. Shale gas accounts for more than half of U.S. natural gas production in the IEO2016 Reference case, and tight gas, shale gas, and coalbed methane resources in Canada and China account for about 80% of total production in 2040 in those countries.
Things had not changed by the time the 2017 report was published.
- In the United States and China, increases in natural gas production between 2016 and 2040 are projected to mainly come from the development of shale resources...
- Shale resource development accounts for 50% of U.S. natural gas production in 2015, increasing to nearly 70% in 2040, as the country leverages advances in horizontal drilling and hydraulic fracturing techniques and taps into newly discovered technically recoverable reserves.
- Shale resource developments are projected to account for nearly 50% of China’s natural gas production by 2040, making the country the world’s largest shale gas producer after the United States.
- In Canada, future natural gas production is expected to come mainly from tight resources, from several regions in British Columbia and Alberta.
Remember, the IEO "Reference" case refers to IEO projections about the future that are based on the assumption that legislation and policy related to energy stays the same as when the report was generated. The Reference case "does not incorporate prospective legislation or policies that might affect energy markets."
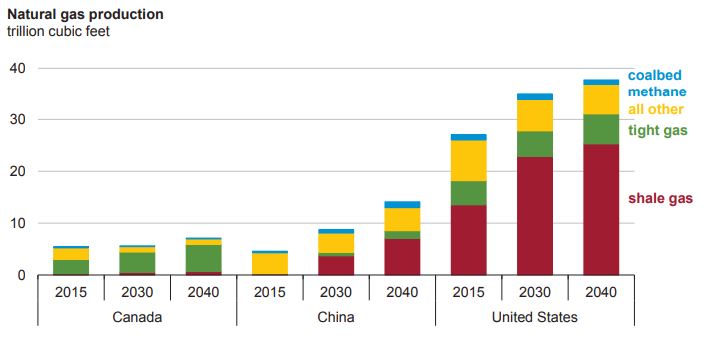
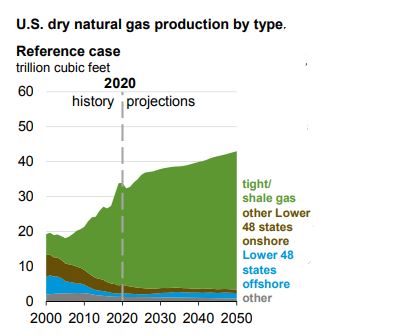
| gas type | 2015 | 2030 | 2040 |
|---|---|---|---|
| tight gas, shale gas, and coalbed methane | 19.2 | 28.8 | 31.9 |
| other gas | 7.8 | 6.1 | 5.8 |
| total gas | 27.0 | 34.9 | 37.7 |
| gas type | 2015 | 2030 | 2040 |
|---|---|---|---|
| tight gas, shale gas, and coalbed methane | 3.2 | 4.4 | 5.9 |
| other gas | 2.2 | 1.3 | 1.2 |
| total gas | 5.5 | 5.6 | 7.1 |
| gas type | 2015 | 2030 | 2040 |
|---|---|---|---|
| tight gas, shale gas, and coalbed methane | 0.6 | 5.0 | 9.7 |
| other gas | 4.1 | 3.7 | 4.5 |
| total gas | 4.6 | 8.7 | 14.1 |
Clearly, shale gas, and to a lesser extent, tight gas and coal bed methane, are to play an increasingly important role in global natural gas production!
The 2016 IEO provides the following chart for natural gas proved reserves (this information is not available in the 2017 or 2019 reports).
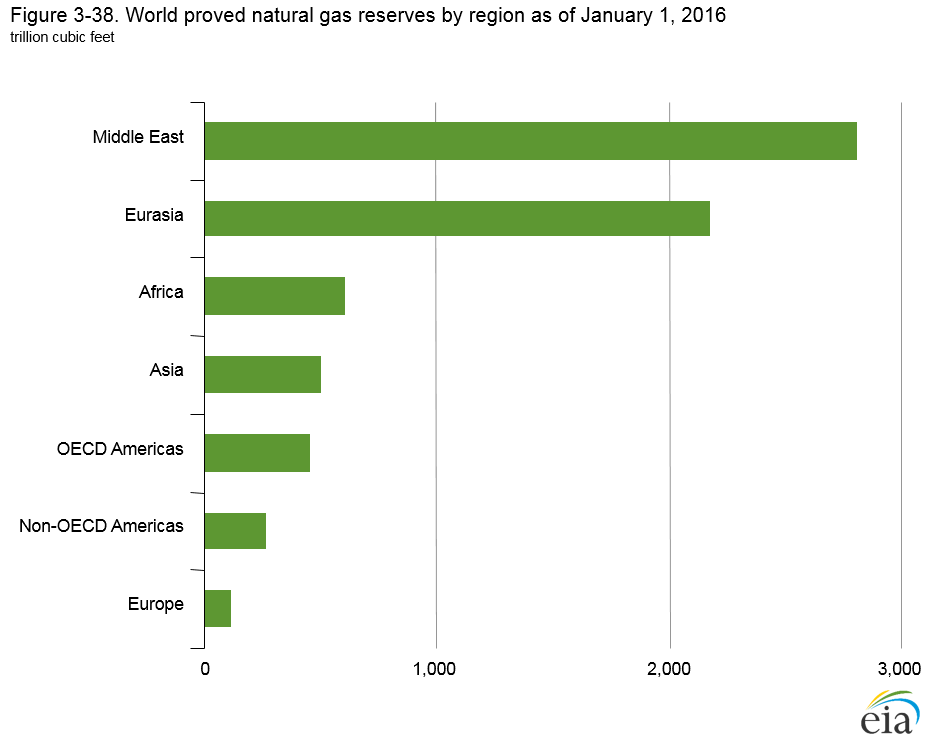
| Country | Trillion Cubic Feet |
|---|---|
| Middle East | 2,810.23 |
| Eurasia | 2,184.56 |
| Africa | 605.27 |
| Asia | 502.12 |
| OECD Americas | 457.27 |
| Non-OECD Americas | 271.62 |
| Europe | 118.71 |
The data in the second chart represents proved reserves. The Outlook study says, "the world's proved natural gas reserves have grown by about 40% over the past 20 years, to a total of 6,950 Tcf as of January 1, 2016."
As with coal, "proved reserves" means the natural gas that has been discovered and defined at a significant level of certainty and that can be economically recovered. "Technically recoverable" resources are estimates of the amount of gas that can be recovered, using current technology, without regard to cost. The chart below demonstrates that even as natural gas use increases, proved reserves continue to (paradoxically) increase. This is the result of improved extraction technology rendering natural gas increasingly economic, particularly with regard to unconventional sources. (For example, the 2013 International Energy Outlook stated that reserves had grown by 39 percent over the past 20 years, and that the total reserves were 6,793 Tcf, both of which are smaller than the 2016 numbers.) The chart below indicates the proved reserves of various regions since 1960. The exact numbers in the chart are not important, but it should give you a feel for the general trend over time. (In case you have trouble seeing it, the top line is the Middle East, the blue line is Africa, the brown line is Asia & Oceana, the black line is North America, the green line is Central & South America, and Europe is in yellow.)
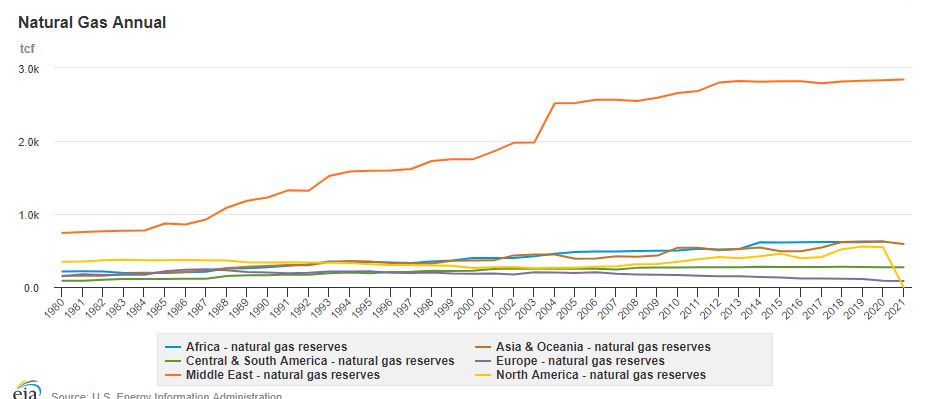
The nuances of resource estimates for non-renewable energy sources are rather complex. (For those who are interested, here is a full explanation of natural gas resource classifications [27].) The larger point is the importance of being fully aware of these concepts and qualifiers whenever you are working with or analyzing data related to reserves of non-renewable energy sources.
Shale Gas, the Play
Contributing mightily to the interest in natural gas, are new extraction techniques that make it economical to recover gas from "unconventional" sources, which (as defined by the EIA) include tight gas, shale gas, and coalbed methane.
Coalbed methane we understand from our previous lesson. "Tight gas" refers to natural gas that is locked in extraordinarily impermeable hard rock or that is trapped in sandstone or limestone formations that are impermeable or nonporous ("tight sand"). "Shale gas" refers to natural gas that is trapped within shale, a formation of fine-grained sedimentary rocks.
In the International Energy Outlook 2013 [29], the EIA reports, "In the United States, one of the keys to increasing natural gas production has been advances in the application of horizontal drilling and hydraulic fracturing technologies, which have made it possible to develop the country's vast shale gas resources and have contributed to a near doubling of estimates for total U.S. technically recoverable natural gas resources over the past decade" (p. 41). This trend, as clearly indicated above, continues today.
To Read Now
From the Department of Energy's Energy in Brief series, read "What is shale gas and why is it important? [30]" (the statistics are outdated, but the descriptions are concise and valid) and "Natural Gas and the Environment [31]" from the U.S. EIA.
| air pollutant | natural gas | oil | coal |
|---|---|---|---|
| Carbon dioxide | 117,000 | 164,000 | 208,000 |
| carbon monoxide | 40 | 33 | 208 |
| nitrogen oxides | 92 | 448 | 457 |
| sulfur dioxide | 0.6 | 1,122 | 2,591 |
| particulates | 7.0 | 84 | 2,744 |
| formaldehyde | 0.750 | 0.220 | 0.221 |
| mercury | 0.000 | 0.007 | 0.016 |
Natural Gas Demand and Uses
Demand

| region | Consumption (billion cubic tons | Percent of total |
|---|---|---|
| North America | 37,481 | 26% |
| Asia & Oceana | 29,325 | 20% |
| Eurasia | 21,426 | 17% |
| Europe | 18,908 | 15% |
| Middle East | 18,809 | 14% |
| Central & South America | 5,832 | 4% |
| Africa | 5,259 | 4% |
According to the Energy Information Administration, the world consumed more than138,000 billion cubic feet (Bcf) of natural gas in 2018. The chart above depicts how this consumption was distributed worldwide. Overall, in 2018, a little over 27% of the world's primary energy consumption was from natural gas, according to BP's 2020 Statistical Review of World Energy [34].
Regarding future demand, in International Energy Outlook 2016 [20], the Energy Information Administration reports,
By energy source, natural gas accounts for the largest increase in world primary energy consumption...Natural gas remains a key fuel in the electric power sector and industrial sector. In the power sector, natural gas is an attractive choice for new generating plants because of its fuel efficiency. Natural gas also burns cleaner than coal or petroleum products, and as more governments begin implementing national or regional plans to reduce carbon dioxide (CO2) emissions, they may encourage the use of natural gas to displace more carbon-intensive coal and liquid fuels...Consumption of natural gas increases in every IEO region..
As you might guess (and may recall reading previously), as natural gas becomes a more popular fuel source worldwide, international trade will also increase. As you can see, the U.S., Russia, and China will play major roles in this. As stated in the IEO 2019 [35],
- Asia experiences the greatest growth in global natural gas consumption because the economies of countries such as China and India are rapidly expanding. Non-OECD natural gas demand in Asia increasingly outpaces regional supply, despite relatively large increases in natural gas production in China. As a result, net imports of natural gas to Asia (all countries) more than triple from 2018 to 2050
- Despite strong growth in LNG trade, pipeline flows continue to account for most of the interregional natural gas trade during the projection period as pipeline infrastructure is further developed
- Non-OECD Europe and Eurasia (primarily Russia) remains the largest net exporter of natural gas in 2050, followed by the Middle East. During this time, OECD Europe increases its dependence on Russian pipeline natural gas, and non-OECD Asia imports a growing amount of LNG.
- The Americas grow as a net exporter of natural gas, driven mostly by LNG shipments from the United States, to countries outside the region.
Uses
Natural gas is used in many ways, including power generation, residential heating and appliances (cooking, clothes dryers) and in the production of many products.
According to the U.S. EIA [36], in the United States, about 34% of all the energy we used came from natural gas in 2020. About 38% of the natural gas we used was for electricity generation (up from 30% in 2014). Another 33% was used for industrial purposes, and about 15% was used in homes, while 10% was used in commercial buildings. Only 3% was used for transportation.
Natural gas can be used in several different ways to generate electricity--it may be burned to create steam that turns a turbine (similar to a coal-fired plant) or may be used with a gas turbine, where hot gases from the burning gas turn the turbine (instead of heating steam). Gas turbines may be turned on and off quickly, making them well suited to meet peak load demands. Gas turbines are also used in combined cycle units, where the waste heat from the gas turbine is used to create steam and drive a turbine. These arrangements are much more efficient than steam or gas turbines alone - many combined cycle units approach 60% efficiency, compared to just over 30% for coal and nuclear. Because of its widespread availability and other advantages, natural gas is used for distributed generation--where electricity is generated at or very near the point of use, often a commercial or industrial site.
Natural gas is also used to produce steel, glass, paper, clothing, and brick. Many products use natural gas as a raw material, such as paints, fertilizer, plastics, antifreeze, dyes, photographic film, medicines, and explosives.
In the United States, more than half of the homes use natural gas as their main heating fuel. In our homes we also use it for cooking, water heaters, clothes dryers, and other appliances.
To Read Now
The increasing use of natural gas for electricity generation has been an important development in the global power sector. Though it has been outcompeting coal (for the most part) in the U.S., in some situations and locations, other sources are replacing natural gas, as you will see below.
- Read "Energy Transitions Begin to Leave Out Natural Gas Power [37]" from Power Magazine and "Natural gas prices, not 'war on coal,' were key to coal power decline: study [38]" from Phys.org.
Hydrogen Production


Natural gas is also used in the production of hydrogen to power fuel cells. [A fuel cell converts chemical energy of a fuel (usually hydrogen) and an oxidant into electricity. If you're interested, visit the DOE's Fuel Cell Technologies Office [40].]
Remember that natural gas is mostly methane and that methane is CH4? Aha, makes sense! Hydrogen is produced from natural gas through a type of thermal process called natural gas reforming.
To Read Now
- Visit the Department of Energy's Fuel Cell Technologies Program. Read "Natural Gas Reforming [41]." (And of course, you are encouraged to poke around more on this nifty topic, if you have the time and interest.)
- When hydrogen is used to generate energy, there are no emissions. However, the production of hydrogen almost always has a carbon footprint. For an overview of the impact of various forms of hydrogen production, read the following sections of "Decarbonized Hydrogen in the US Power and Industrial Sectors: Identifying and Incentivizing Opportunities to Lower Emissions [42]" by Resources for the Future from December 2020. (As always, feel free to read through more of the report. It provides a very comprehensive and well-sourced look at the state of hydrogen production.):
- Abstract
- Key Findings
- Introduction
- Hydrogen Supply - Read everything until Section 2.3.2 Cost and Opportunities for Reduction.
Compressed Natural Gas
In addition to its gas and liquid states, natural gas may also be compressed to be used as a fuel for vehicles. According to NGV Global [43], there were over 26 million Natural Gas Vehicles (NGVs) operating worldwide by November 2018 (the most recent date data were available for), including motorcycles, cars, vans, light and heavy-duty trucks, buses, lift trucks, locomotives, even ships and ferries. From 1996 to 2018, the number of NGVs has grown by nearly 3,000%! (850,445 vehicles in 1996 and 26,366,422 vehicles in 2018, according to NGV Global [43].) As you can see in the image below, global growth is driven by the Asia-Pacific region and to a lesser extent, Latin America.

In the United States, however, at 175,000 in 2017 the number of NGVs is small and increasing slowly. Vehicles fueled by natural gas get fewer miles on a tank of fuel and, here, refueling stations are not widely available and new CNG-fueled vehicles are limited. According to the U.S. DOE [44], the 2016 Chevrolet Impala Bi-Fuel (CNG) is the only new vehicle currently available in the U.S. However, conventional gasoline, and diesel vehicles can be retrofitted for CNG.
When biogas (produced from decomposing organic matter) is processed to purity standards, it is a renewable natural gas (RNG) that can substitute for natural gas as an alternative fuel for natural gas vehicles. In fact, according to the U.S. DOE [45], "about 60% of the gas used in Sweden's 38,500 natural gas vehicles is RNG. In Germany, 25% of the public compressed natural gas stations dispense 100% RNG. In the United States, biomethane vehicle activities are on a smaller scale."
Looking Ahead
A Mixed Bag of Climate Benefits
From a climate change perspective, natural gas has some strong positive and negative aspects. One of the primary environmental benefits of natural gas is that it emits much less CO2 per MMBTU (million BTUs) than other fossil fuel sources. Much less, in fact, as can be seen in the chart below.
| Fuel Type | Pounds of CO2 |
|---|---|
| Coal (anthracite) | 228.6 |
| Coal (bituminous) | 205.7 |
| Coal (lignite) | 215.4 |
| Coal (subbituminous) | 214.3 |
| Diesel Fuel and Heating Oil | 161.3 |
| Gasoline | 157.2 |
| Propane | 139.0 |
| Natural Gas | 117.0 |
As you can see, natural gas has the lowest carbon intensity of all fossil fuels, and emits about half as much CO2 per unit of energy as coal. Coal and natural gas are the two primary sources of electricity, and in addition to natural gas emitting less carbon dioxide on a raw energy basis, as mentioned previously combined cycle turbines are more efficient than coal-fired power plants, which decreases the carbon footprint further relative to coal in terms of pounds of CO2 per kWh generated.
The shale gas boom has been one of the drivers of the decreasing carbon intensity of the energy sector and the U.S. economy. There are five lines in the chart below, each of which indicate a relatively clear trend. Each of these lines shows a trend relative to 1990. For example, As of 2003, the GDP (the blue line at the top) increased to a factor of 1.5, which means the GDP was 50% larger in 2003 relative to 1990. (This chart is from the US EIA, and there are a number of excellent charts on the page if you are interested):
- GDP (blue line at the top): "Total value of goods and services produced over a specific time period" (From Investopedia [47], a great source of economic/financial information, by the way!).
- Energy CO2 (red line, second from top): These are the total emissions that were emitted as a result of energy use.
- Carbon intensity of energy (yellow line, third from the top): This indicates the ratio of carbon dioxide emissions to energy consumed.
- Energy intensity of the economy (green line, fourth from the top): Indicates the ratio of energy use to economic output.
- Carbon intensity of the economy (brown line, bottom): Indicates the amount of CO2 emitted per unit of economic output.

Index of key energy related emissions drivers, 1990-2014. 1990 acts as a baseline labeled 1.0
- Gross Domestic Product: increases fairly steadily with a slight dip in 2009, reaching about 1.9 in 2014
- Energy CO2: increases slightly 1990-2009, then declines to about 1.1 in 2014
- Carbon Intensity of the economy: steadily decreases to approximately .6 in 2014
- Energy Intensity of the economy: Follows the same trend as carbon intensity of the economy
- Carbon Intensity of the energy: fairly stable at 1 until 2007-2008, where it slightly decreases to .9 to 2014
The EIA attributes part of the decline in overall emissions and decreased carbon intensity of the economy and energy generation to natural gas usage. However, natural gas can have (and has had) negative climate impacts.
To Read Now
- "Natural-Gas Boom Driving Methane Leaks, Study Finds [49]" (Wall Street Journal, June 21, 2018) (.pdf file also available [50])
- For a somewhat longitudinal view of methane regulation in the U.S., first read "EPA Aims To Roll Back Limits On Methane Emissions From Oil And Gas Industry [51]" (NPR, August 29, 2019) then "Biden Signs Bill To Restore Regulations On Climate-Warming Methane Emissions [52]" (NPR, June 30, 2021).
- For a more global perspective, read "Rhodium Group Report on Global Oil & Gas Methane Emissions [53]" (Environmental Defense Fund, April 2015). You only need to read the summary on the link, but feel free to download the entire report.
The Future of Natural Gas
The following essays are from the Union of Concerned Scientists (UCS). The UCS is known as a strong proponent of renewable energy and energy efficiency, safe and clean energy supplies, and policies that address climate change. The essays appear at the same location on the same web page, but at two different points in time. The first essay was originally accessed in February 2014, and the second was last accessed in September 2017. The first essay thoughtfully draws together the vying promises and challenges of natural gas at a time when fracking was not quite as ubiquitous (the essay was written in 2010, as it turns out). The second essay was written in 2015. These positions illustrate both the promise of natural gas as a (possibly) lower-carbon "transition" fuel and, when taken together, the cautiousness with which societies should approach increased natural gas production... and give us a nice landing spot for this hard-working lesson. Enjoy.
The Future of Natural Gas
A convergence of factors is driving our society towards greater reliance on natural gas as a source of energy. An increased focus on the potential reductions in carbon emissions and air pollution from burning natural gas instead of coal or oil have made natural gas an environmentally attractive alternative to other fossil fuels. Concurrently, improved techniques for extracting unconventional sources of gas have dramatically raised estimates of the U.S.’s available gas resource.
Because energy produced from natural gas has much lower associated carbon emissions than these other fossil fuels, natural gas could act as a “bridge” fuel to a low-carbon energy future. Particularly in the electric sector, natural gas has the potential to ease our transition to renewable energy.
In the short term, renewable energy added to the grid may displace natural gas use, because natural gas power typically has the highest operating costs. In the long term, increased amounts of renewable energy are likely to encourage the use of natural gas as a complementary source of power. The integration of large amounts of renewable energy sources into the electrical generation mix will pose some challenges for the nation’s electric system because of the inherent variability of solar and wind power. Natural gas plants have the operational flexibility to vary their production rapidly, allowing them to provide reliability to the electric power system as it transitions to greater shares of renewable generation.
Natural gas is by no means a panacea for the environmental problems caused by our energy use. There is broad agreement among climate scientists that carbon reductions of about 80 percent will be needed to avert the worst effects of climate change, so simply switching to natural gas from coal and oil will not ultimately bring about the necessary reductions. In addition, the development of our newly-discovered shale gas resource will disturb areas previously untouched by oil and gas exploration and raise serious water management and quality challenges. Some researchers have also suggested that abundant shale gas resources could delay the transition to renewables by providing a cheap, plentiful alternative.[48] Given the competing uses of natural gas and the vagaries of regional supplies, increased dependence on natural gas also exposes our economy to its frequent price volatility.
Overall, the increased use of natural gas over coal and oil will produce real and substantial reductions in global warming emissions and improvements in public health. As gas use expands, the natural gas industry must also minimize the environmental effects of its extraction and production. If used wisely and efficiently, natural gas can help our economy effectively transition toward even cleaner, more sustainable sources of energy like wind, solar, geothermal, and bioenergy.
The Future of Natural Gas
Despite significant environmental concerns associated with its extraction, production, and distribution, natural gas burns more cleanly than coal and oil and therefore offers advantages in reducing emissions and improving public health. However, natural gas is a fossil fuel whose emissions do contribute to global warming, making it a far less attractive climate solution than lower- and zero-carbon alternatives such as energy efficiency [55] and renewable energy [56].
Furthermore, new research suggests that methane leakage during the extraction and distribution of natural gas may be undermining the potential to reduce global warming emissions by using natural gas in place of higher-carbon fossil fuels such as coal and oil. And new horizontal drilling and hydraulic fracturing (or "fracking") techniques that have allowed domestic gas and oil production to expand rapidly over the past decade have raised new questions about the impacts that natural gas extraction and use will have on climate change, public health and safety, land and water resources, and people. This expansion is currently outpacing our capacity to understand and manage the attendant risks.
During our nation's transition to a low-carbon energy future, natural gas can play an important but limited role in the electricity and transportation sectors [57] -if policies sufficient to minimize emissions and protect communities and public health are put in place.
Lesson 7 Assignment
Weekly Activity 7
Please review Canvas calendar for all due dates related to your Nonmarket Analysis Case Study.
Deliverables
Complete "Weekly Activity 7," located in the "Weekly Activities" folder under the Modules tab in Canvas. The activity may include a variety of question types, such as multiple choice, multiple select, ordering, matching, true/false, and "essay" (in some cases these require independent research and may be quantitative). Be sure to read each question carefully.
Unless specifically instructed otherwise, the answers to all questions come from the material presented in the course lesson. Do NOT go "googling around" to find an answer. To complete the Activity successfully, you will need to read the lesson, and all assigned readings, fully and carefully.
Each week, a few questions may involve research beyond the material presented in the course lesson. This "research" requirement will be made clear in the question instructions. Be sure to allow yourself time for this! You will be graded on the correctness and quality of your answers. Make your answers as orderly and clear as possible. Help me understand what you are thinking and include data where relevant. Remember, numbers should ALWAYS be accompanied by units of measure (not "300" but "300 kW"). You must provide ALL calculations/equations to receive full credit - try to "talk me through" how you did the analysis.
This Activity is to be done individually and is to represent YOUR OWN WORK. (See Academic Integrity and Research Ethics [59] for a full description of the College's policy related to Academic Integrity and penalties for violation.)
The Activity is not timed, but does close at 11:59 pm EST on the due date, as shown in Canvas.
If you have questions about the assignment, please post them to the "Questions about EME 444?" Discussion Forum. I am happy to provide clarification and guidance to help you understand the material and questions (really!). Of course, it is best to ask early.
Summary and Final Tasks
With this lesson, we continued our survey of energy industries based on energy sources. In this lesson, you learned about the natural gas industry--from exploration and extraction, transportation, resource estimates, demand, usage, and externalities.
You learned:
- about sources of natural gas;
- a simple explanation of seismology and its role in resource exploration;
- concepts and terminology related to on- and off-shore natural gas extraction;
- about major components of the US natural gas pipeline system;
- benefits and uses of liquefied natural gas (LNG);
- qualifiers in resource allocations and how to report on current estimates;
- to weigh the relative advantages and externalities of hydraulic fracturing;
- about methane leakage and related considerations.
Have you completed everything?
You have reached the end of Lesson 7! Double-check the list of requirements on the first page of this lesson to make sure you have completed all of the activities listed there.