8 Biomass and Hydro
Introduction
Overview of Lesson 8
With this lesson, we continue our survey of energy industries based on energy sources. In this lesson, we will review the natural gas industry--including exploration and extraction, transportation, resource estimates, demand, usage, and externalities.
What will we learn?
By the end of this lesson, you should be able to...
- describe sources of renewable energy, in the USA and worldwide;
- quantify biomass and hydropower energy sources, in the USA and worldwide;
- explain biomass conversion processes, including feedstocks and products of each;
- discuss biomass logistics and identify major operations;
- explain in detail major factors related to bioenergy economic, social, and environmental sustainability;
- present and consume electricity data using appropriate and correct units of measure;
- reflect on worldwide trends and projections for electricity generation from renewable sources;
- describe major types and components of hydropower plants;
- apply major factors related to hydropower economic, social, and environmental sustainability.
What is due for Lesson 8?
The table below provides an overview of the requirements for Lesson 8. For details, please see individual assignments.
Please refer to the Calendar in Canvas for specific time frames and due dates.
|
REQUIREMENT |
SUBMITTING YOUR WORK |
|---|---|
| Read Lesson 8 content and any additional assigned material | Not submitted. |
| Weekly Activity 8 | Yes—Complete Activity located in the Modules Tab |
Renewable Energy
Introduction
The Energy Information Administration glossary [1] defines renewable energy sources as "energy resources that are naturally replenishing but flow-limited. They are virtually inexhaustible in duration but limited in the amount of energy that is available per unit of time. Renewable energy resources include biomass, hydro, geothermal, solar, wind, ocean thermal, wave action, and tidal action."
On the other hand, the EIA, in the context of transportation fuels, defines alternative fuels [2] as fuel that is "substantially not petroleum and would yield substantial energy security benefits and substantial environmental benefits." Of the energy sources we have considered so far, coal and natural gas are non-renewable energy sources. Nuclear, though not renewable, is often considered an alternative fuel source because it does not have greenhouse gas emissions associated with fossil fuels. Natural gas is considered by the EIA as an alternative transportation fuel. Other alternative fuels include biofuels such as ethanol and biodiesel.
The most commonly used renewable energy sources are hydroelectricity, wind, biomass, solar, and geothermal. In this course, we are going to look closely at hydropower and biomass (this lesson) and wind and solar (next lesson), since they are by far the most-used sources in the world.
According to the International Energy Agency's (IEA's) 2019 "Key World Energy Statistics [3]" renewable energy accounted for around 13.8% of total primary energy supply (TPES) in 2017, down from 14.1% in 2014 and even with the13.8% in 2013 (2017 is the most recent year for which global data are available). Note that this includes "waste" which in part consists of municipal, commercial, and industrial waste (i.e., garbage) that is burned and used to generate electricity and/or heat (see the glossary for an explanation). Believe it or not, it is standard practice to consider waste incineration as renewable energy, regardless of the composition of the waste. Whether or not this is valid is a debate for another time, but for now, we'll consider it renewable since it cannot be disaggregated from biomass in the IEA data.
Primary energy refers to energy in its "original" form, in other words "before any transformation to secondary or tertiary forms of energy" (source: US EIA [4]). For example, coal is a primary energy source, but any electricity or heat it generates is not. Renewable energy sources are also primary energy sources, as are oil, nuclear, and natural gas (but again, any electricity generated from non-renewable sources is not primary energy). Total primary energy supply (TPES) refers to all primary energy used in a given geographical area.
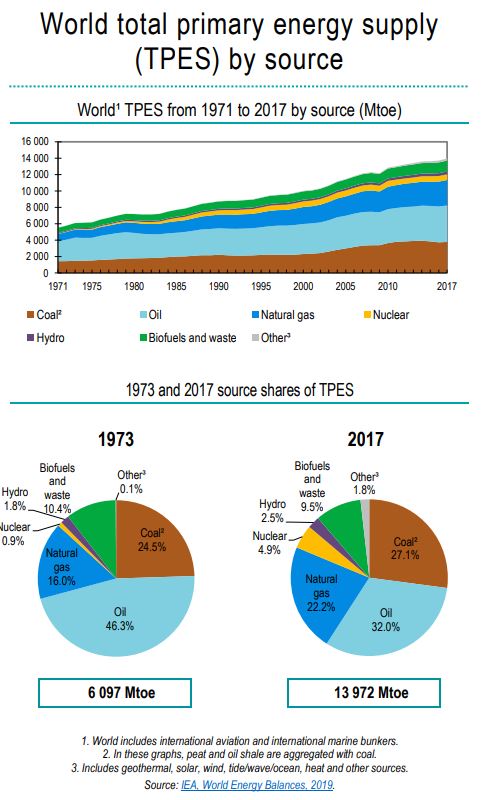
Click here to see a text description of Figure 8.1.
World total primary energy supply (TPES) by fuel
The first graph shows the World* TPES from 1973 to 2017 by fuel (Mtoe) showing that all fuel types have been rising steadily. The fuel types include coal (including peat and oil shale), oil, natural gas, nuclear, hydro, biofuels and waste, and other (including geothermal, solar, wind, tide/wave/ocean, heat and other). *The world includes international aviation and international marine bunkers.
The following table compares 1973 and 2017 energy supply by source.
| Energy Type | 1973 | 2017 (2015) |
|---|---|---|
| OIl | 46.3% | 32.0% (31.7%) |
| Coal | 24.5% | 27.1% (28.1%) |
| Natural Gas | 16.0% | 22.2% (21.6%) |
| Nuclear | 0.9% | 4.9% (4.9%) |
| Hydro | 1.8% | 2.5% (2.5%) |
| Biofuels and Waste | 10.4% | 9.5% (9.7%) |
| Other | 0.1% | 1.8% (1.5%) |
| Total Mtoe | 6097 | 13,972 (13,647) |
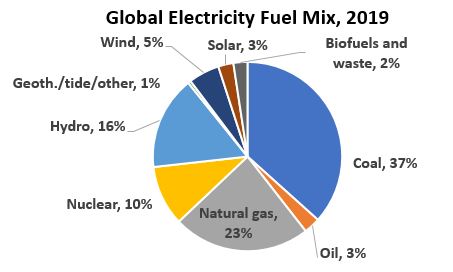
According to the IEA [5], about 27% of all electricity generation worldwide was from renewables in 2019 (up from around 24% in 2015), and is predicted to rise to 28% by 2021 (these are the most recent data available from IEA). Renewable energy accounted for over half of all net electric power capacity additions in 2015, which is the first time that they have accounted for more than 50%. This was led by onshore wind at 63 GW (gigawatts, or billion Watts) and solar photovoltaics at 49 GW (both of these will be addressed in the next lesson).
The IEA reported in 2021 that "renewables are expected to account for 90% of total global power capacity increases in both 2021 and 2022." 90%! That is a staggering number, and is led by wind and solar installations across the world, despite the fact that China had been opening about one coal plant per week [6] in 2020.
Energy and Power
Hopefully, this is a refresher at this point, but because it is so important and so easily confused, let’s be certain…
Power is the rate at which work is performed or energy is converted from one form to another. A car, for example, will have a power rating in “horsepower.” This power rating basically indicates how fast the car can convert chemical energy (from the fuel) into kinetic energy (motion). The power rating is separate from how fast or how far the car actually goes. For example, a 1967 Corvette with a 435 hp power rating will have that rating whether it is sitting in the driveway, rolling along a country road, or racing around a track. But while in operation, the engine's actual hp (the rate the energy is physically being converted) can increase and decrease.
Similarly, a light bulb has a power rating measured in watts. In this case, the light bulb is transforming electrical energy into heat and light. The higher the wattage, the higher the rate of energy transformation. And like our car engine, the power rating stays the same whether the light bulb is on or not. A 75-W bulb is always a 75-W bulb.
To understand energy, think about your power bill. You don’t get a bill for how many light bulbs you have, or how many watts they are. You get a bill for how much you use them. And when you use them, they use energy (electrical energy). The amount of electricity (energy) they use is measured in kilowatt hours (kWh). In two hours, a 150-W bulb will use 300 Wh of electricity (150 W x 2 h = 300 Wh). Since there are 1,000 Wh in a kWh, this is 0.3 kWh. A 50-W bulb will use 100 Wh in the same amount of time (0.1 kWh).
When we refer to electricity generation of power stations (including hydroelectric, wind, and solar), the systems themselves have a power rating that is in watts (or kW or MW). This is generally referred to as capacity. You can think of capacity as the maximum power output of an energy source. For example, a 1 MW (megawatt, or million watt) power plant has a peak electric power output of - you guessed it - 1 MW. If it operates at full capacity for 1 hour it would generate 1 MWh (1 MW x 1 hr) (a MWh is a megawatt-hour, which should ring a bell because SRECs are measured in MWh). If it operated at full capacity for one day it would output 24 MWh (1 MW x 24 hr).
Wind and solar energy are notoriously intermittent, but even coal and natural gas power plants have downtime. Nuclear power plants generally operate at near capacity most of the time and are viewed as one of the most reliable renewable energy sources. Hydroelectricity can be designed to operate at near full capacity, but generally, do not. The capacity factor of an energy source is determined by dividing the actual energy generation over a given period of time by the maximum possible generation over that same period (hopefully this sounds familiar, as it was the subject of a question in an earlier homework). Capacity factor generally refers to a year or an average year of generation but can refer to any amount of time. In the example above, if the 1 MW power plant output 12 MWh in one day, the capacity factor for that day would be 50% (12 MWh/24 MWh = 50%). Nuclear tends to have an average capacity factor above 90%, while hydroelectricity hovers in the 40% range. See this table from the EIA [7] for the average capacity factors of different non-fossil fuel sources of electricity in the U.S., and this table for fossil-fuel capacity factors. [8]
Generation is the amount of electricity generated (should be easy to remember!) by an energy-generating system. The amount of electricity a system generates can be measured in kWh, but can also be measured in MWh (million Wh) or GWh (billion Wh), or even TWh (trillion Wh). The amount of electricity a hydroelectric power plant will generate is basically determined by the plant's capacity and the amount of fuel (moving water), and whether or not full output is desired at the time. The amount of electricity a solar array will generate is basically determined by the solar array’s capacity and the amount of fuel (sunshine). The amount of electricity a wind turbine will generate is determined by the turbine’s capacity and the amount of fuel (wind) that is being provided at the time.
U.S. Energy Use
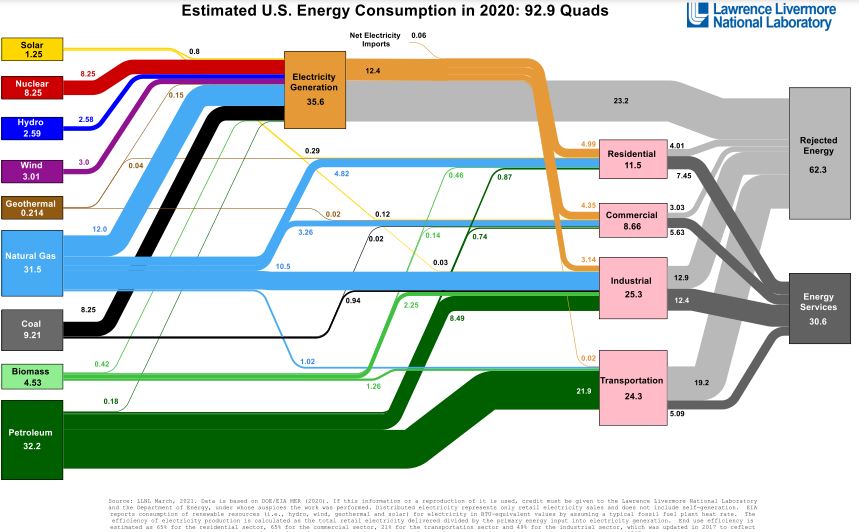
The image below illustrates the total energy flows in the U.S. in 2020. All the fuel sources on the left are primary energy sources, and the quantities are given in quads (a quad is one quadrillion BTUs, or 1 x 10¹⁵ BTUs). The image indicates how each energy source is used, and how much is wasted ("rejected"), mostly as heat. (You can click on the image to see a larger and resizable version.) You can view a short explanation of this chart [9] by a representative from Lawrence Livermore National Laboratory [10] (LLNL), the U.S. national lab that generates this chart every year.
Lawrence Livermore National Laboratory also publishes an annual carbon emission flow chart (this type of "flow" chart is called a Sankey diagram). The 2018 chart (the most recent available) can be seen below. Note that the subjects of this Lesson (hydroelectric and biomass) and the next lesson (solar and wind) do not account for any of the U.S.'s carbon footprint.

Biomass
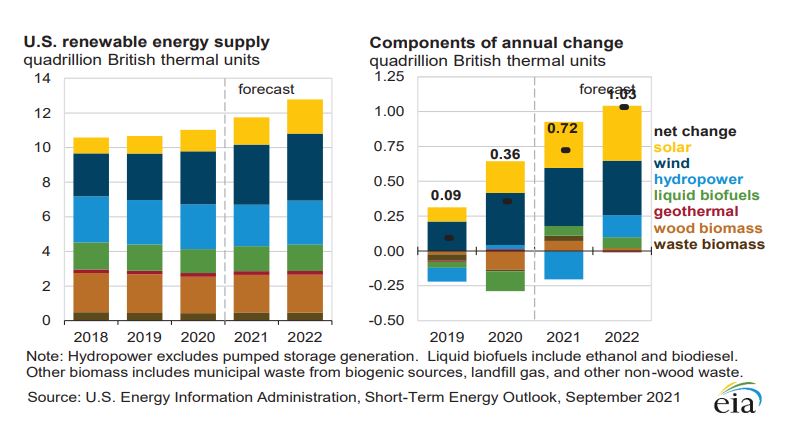
The table and chart below comes from the EIA's monthly report [12], "Short-Term Energy Outlook," September 2021. (Commonly referred to as STEO).
| Energy Source | 2017 | 2018 | 2019 | 2020 |
|---|---|---|---|---|
| Hydroelectric Powera | 3.640 | 7.031 | 2.492 | 2.592 |
| Geothermal | 0.300 | 0.578 | 0.209 | 0.214 |
| Solar | 1.021 | 2.170 | 1.043 | 1.246 |
| Wind | 3.197 | 6.479 | 2.729 | 3.065 |
| Wood Biomass | 3.121 | 6.109 | 2.297 | 2.101 |
| Ethanol | 1.694 | 3.284 | 1.200 | 1.045 |
| Biomass-based diesel | 0.424 | 0.777 | 0.265 | 0.275 |
| Waste Biomassb | 0.705 | 1.356 | 0.433 | 0.430 |
| Biofuel losses and co-productsc | 1.163 | 2.266 | 0.800 | 0.698 |
| Total | 15.236 | 29.990 | 11.441 | 11.657 |
Biomass clearly comes from a variety of sources, so what is biomass? In the table above, it is wood biomass, waste biomass, ethanol, biomass-based diesel ("biodiesel"), and biofuel losses and co-products. Is it me, or does it seems like other renewable sources like solar and wind get most of the press? Don't get me wrong - these are great sources, but biomass is by far the largest single source of renewable energy both in the U.S. and worldwide. Altogether, about 38% of renewable energy consumed in the USA in 2020 came from biomass sources (not included the biofuel losses and co-products). About the same amount as wind and solar combined!
What is Biomass?
Biomass is "organic nonfossil material of biological origin constituting a renewable energy source." (Source: EIA [13]). Why the word "nonfossil?" We know that fossil fuels are formed in the Earth's crust from decayed organic material. So why aren't fossil fuels considered "biomass"?
Another definition describes biomass as "derived from living, or recently living organisms." This is the trick: the difference is one of time scale. "Fossil fuels such as coal, oil, and gas are also derived from biological material, however material that absorbed CO2 from the atmosphere many millions of years ago" (Biomass Energy Centre [14]). Biomass then is a renewable energy source, as indicated by the EIA definition, and thus is "virtually inexhaustible in duration but limited in the amount of energy that is available per unit of time." Biomass differs from other renewables such as solar and wind because, in addition to being limited in availability, it is possible to use it at a much higher rate than it can be replenished. Think of a clear-cut forest or decimated cornfield.
Biomass Applications and Processes
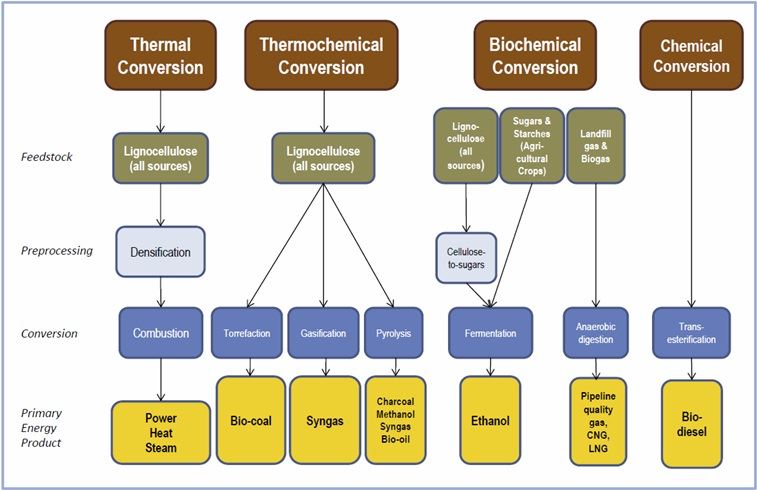
Click link to expand for a text description of Figure 8.5
Diagram examines bioenergy conversion technologies of various different energies. F stands for Feedstock. PP stands for Preprocessing, C stands for conversion and PEP stands for primary energy product.
Thermal Conversion
F: Lignocellulose (all sources)
PP: Densification
C: Combustion
PEP: Power, Heat, Steam
Chemical Conversion
F: N/A
PP: N/A
C: Transesterification
PEP: Bio-diesel
Thermochemical Conversion
F: Lignocellulose (all sources)
PP: N/A
C: Torrefaction
PEP: Bio-coal
C: Gasification
PEP: Syngas
C: Pyrolysis
PEP: Charcoal, methanol, syngas, bio-oil
Biochemical conversion
F: Lignocellulose (all sources)
PP: Cellulose to Sugars
C: Fermentation
PEP: Ethanol
F: Sugars & Starches (Agricultural Crops)
PP: N/A
C: Fermentation
PEP: Ethanol
F: Land Fill gas & Biogas
PP: N/A
C: Anaerobic Digestion
PEP: Pipeline quality gas, CNG, LNG
A feedstock is "any renewable, biological material that can be used directly as a fuel, or converted to another form of fuel or energy product." According to the Office of Energy Efficiency and Renewable Energy [16], "biomass feedstocks are the plant and algal materials used to derive fuels like ethanol, butanol, biodiesel, and other hydrocarbon fuels".
There are two basic categories of biomass material: woody & .... non-woody! "Lignocellulose" is woody biomass. (For an excellent description and discussion, see Sources of biomass [17] from the Wisconsin Grasslands Bioenergy Network. This is not required reading.)
From the Environmental and Energy Study Institute [18], here is a list of some of the most "common (and/or most promising)" biomass feedstocks--
- Grains and starch crops – Sugar cane, corn, wheat, sugar beets, industrial sweet potatoes, etc.
- Agricultural residues – Corn stover, wheat straw, rice straw, orchard prunings, etc.
- Food waste – Waste produce, food processing waste, etc.
- Forestry materials – Logging residues, forest thinnings, etc.
- Animal byproducts – Tallow, fish oil, manure, etc.
- Energy crops – Switchgrass, miscanthus, hybrid poplar, willow, algae, etc.
- Urban and suburban wastes – Municipal solid wastes (MSW), lawn wastes, wastewater treatment sludge, urban wood wastes, disaster debris, trap grease, yellow grease, waste cooking oil, etc.
Logistics
Feedstock logistics encompass all of the operations necessary to harvest the biomass and move it to the conversion reactor at the biorefinery (or the heat and/or electricity generation facility), including the processing steps necessary to ensure that the delivered feedstock meets the specifications of the biorefinery conversion process. A biorefinery is where "biomass is upgraded to one or more valuable products such as transport fuels, materials, chemicals, electricity and, as a byproduct, heat" (Source: "What is a Biorefinery? [19]" by Bernstsson, Snadén, Olsson, and Åsblad. This article provides an excellent explanation of various biorefining processes if you are so inclined!). Conventionally, facilities that generate electricity and/or heat through direct thermal conversion (combustion) are not considered biorefineries unless they first convert the biomass into a "novel" material like biogas. In the chart at the top of this page, biorefineries are used in all technologies except for thermal conversion.
Logistics includes harvest and collection, preprocessing, storage and queuing, handling and transportation, and is used in all four of the technologies in the chart above.
In its natural form, most biomass is bulky, relatively wet, and due to its low bulk-density, costly to transport. Preprocessing includes production steps, like chipping, grinding, compacting and drying, that turn biomass into what is properly called feedstock.
Biomass densification is the compression or compaction of biomass to reduce its volume per unit area. Densification is used for solid fuel applications (e.g., pellets, briquettes, logs). Drying biomass improves the grinding process, and results in smaller more uniform particles of biomass.
For cellulosic biomass, mechanical (e.g., crushing) and thermochemical (e.g., hydrolysis) pretreatments are necessary.
Many herbaceous feedstocks, for example, corn stover, are only harvested over a few weeks during the year in the U.S. Corn Belt. To maintain a continuous supply of this feedstock to biorefineries, storage is required. Biological degradation can reduce the amount of biomass available for bioenergy production and also impact the conversion yield, by altering biomass chemical composition.
Unprocessed biomass leaving the field or forest is often bulky, aerobically unstable, and has poor flowability and handling characteristics. These traits can make raw biomass handling and transportation inefficient. Transport can be expensive, especially as distance increases.
The video below from the U.S. Department of Energy may help you visualize some of the processes involved with harvesting and using various feedstocks. Please watch the following (3:39) video:
PRESENTER: Nearly a billion dollars a day-- that's how much we spend on oil imports in the US. Oil that powers our nation's transportation systems and industries.
But here's something to think about-- a strong biofuels industry could meet much of our demand. Biofuels are made from organic materials, or biomass, grown in our own fields and forests. A booming biofuels industry would also keep a lot of the money we spend on imported oil in the country-- plus it would reduce our dependence on foreign oil, and create jobs in rural America.
In fact, we can use homegrown biomass to replace or supplement almost every product that comes from a typical barrel of crude oil. These are things like gasoline, diesel, jet fuel, and other consumer products, like plastics. Much of our imported oil could be replaced with sustainable, renewable biofuels and products made in the USA.
Check this out. This is the Billion-Ton Update Study by the US Department of Energy. This study found that potential biomass resources could produce about 85 billion gallons of biofuels a year-- that's about a third of the oil we use.
OK, so what kinds of plant materials or feedstocks can be converted to fuels? And, where will they come from? America is already using biomass that comes from agriculture and forest operations across the country. These are non-food plants grown specifically for energy. American farms all across the US can produce a wide variety of energy crops. These are plants that are grown because of their high energy content-- crops like switchgrass or fast-growing hybrid poplar trees.
And energy crops can also be grown on marginal, degraded, or underused agricultural land, helping farms expand and become more productive. Agricultural waste can even be converted into biofuels.
Look at this-- farmers can gather and sell corn stalks and wheat straw to be converted to biofuels, making their lands even more profitable. This is non-edible plant material left over from crop harvests that's been collected from farm land instead of going to waste.
So, how do you take plants and make them into fuels and other products? No matter what kind of plant you start with, the first steps are to break them down. The US Department of Energy, partnering with private industry, is making these steps a lot more efficient and affordable. Together, they're developing new machinery and processes specific to the various biomass crops.
This equipment is harvesting, baling, grinding, and condensing these raw plants into energy-ready materials-- materials like these energy dense pellets, ready for the biorefinery. From there, energy-ready biomass feedstocks are transported to one of many biorefineries sprouting up in communities across the country. Here, they can be further broken down, converted into biofuels, and made ready for use.
Homegrown biomass feedstocks-- creating jobs in rural America, generating clean renewable fuels, and reducing our dependence on foreign oil.
Conversion
The figure at the top of this page shows four categories of biomass processing: thermal, thermochemical, biochemical, and chemical. This is a very helpful starting place for understanding the different inputs and outputs associated with biomass.
To Read Now
Visit the the Wisconsin Grasslands Bioenergy Network and read closely, Bioenergy Conversion Technologies [21].
Biomass and Sustainability
Benefits of Energy from Biomass Resources
The Natural Resources Defense Council [22] lists (below) the "Advantages of Biomass Energy":
- Farmers and foresters already produce a great deal of residue. While much of it is needed to protect habitat, soil, and nutrient cycles, tens of millions of tons and more could be safely collected with the right management practices. Every year in the United States, roughly 39 million tons of crop residues go unused.
- Unlike coal, biomass produces no harmful sulfur or mercury emissions and has significantly less nitrogen -- which means less acid rain, smog, and other toxic air pollutants.
- Over time, if dedicated biomass is sustainably managed, converting it to energy can result in low or no net carbon emissions, provided that the carbon released is rapidly absorbed back from the atmosphere by biomass re-growth.
- Using biofuels in our cars and airplanes can potentially produce less global warming pollution than petroleum-based fuels, and allows us to invest our energy dollars at home rather than in foreign oil.
- Switchgrass, a promising source of biofuels, is a native, perennial prairie grass that is easier to grow responsibly than most row crops. If planted in such a way that it does not replace native habitat or take land out of food production, switchgrass and other sustainably managed energy crops have the potential to reduce erosion and nitrogen runoff, and increase soil carbon faster when mowed than when standing.
- Many ethanol refineries are owned by farmer-cooperatives, which help preserve the economic vitality of rural communities.
Bioenergy Sustainability
In 2005, the United Nations adopted the World Summit Outcome, including a commitment "to promote the integration of the three components of sustainable development – economic development, social development and environmental protection – as interdependent and mutually reinforcing pillars." (Resolution Adopted by General Assembly [23], page 11)
In 2013, the Food and Agriculture Organization of the United Nations issued "Biofuels and the sustainability challenge: A global assessment of sustainability issues, trends, and policies for biofuels and related feedstocks." This report examines the assessment of bioenergy different factors governing the sustainability of biomass production for biofuels, and is the most comprehensive assessment of the sustainability implications of biofuels that I have seen with a global perspective. The authors identify “tests” relevant to these pillars:
- Economic sustainability. This test assesses when production makes sense from an economic point of view; which stable competitive conditions would induce producers to opt for biofuels production; what impacts increased production may have on competing uses for the feedstock (primarily food and feed); and to what extent biofuels can be a reliable substitute for fossil fuels.
- Environmental sustainability. This test addresses criteria “such as GHG emissions, soil stress and its ability to maintain productive capacity, available water resources, air, and water pollution and biodiversity.”
- Social sustainability. This test includes considerations of rural development, gender mainstreaming [24], community involvement, inclusiveness of small farmers in the production processes, labor, and land rights.
These pillars are essentially the same as what is often referred to in the literature as the "3 E's" of sustainability: economics, environment, and (social) equity.
To Read Now
Download and open "Biofuels and the sustainability challenge: A global assessment of sustainability issues, trends and policies for biofuels and related feedstocks [25]" from the Food and Agriculture Organization of the United Nations.
Read Section 2.1 Definition of sustainable development (starting on page 67).
Take a few minutes to become familiar with the overall document (review table of contents). You will be using all of Chapter 2 to answer questions in this lesson's assignment.
Not required, but if you have time and are interested, review case studies in Boxes 2.3, 2.4, and 2.5. Very interesting, just a little too "in the weeds" for this lesson. (Okay, I thought that was funny.)
Renewable Energy for Electricity
About Renewable Energy Sources
Biomass, the subject of the first part of this lesson, is a widely used renewable energy source. As you learned earlier in the lesson, it constitutes nearly 10% of global TPES according to the IEA's 2019 Key World Energy Statistics [3] and a little under 5% of U.S. TPES, according to Lawrence Livermore National Laboratory. As we have learned, it is processed in many different ways to produce a wide range of outputs for many kinds of applications, including heat for cooking, space heating and warming water; heat for industrial purposes; heat for electricity production; syngas; ethanol and biodiesel for transportation, and even methane for natural gas applications.
Other widely used renewable energy sources--hydro, wind and solar--are used almost exclusively for electricity generation. Energy from the sun is also used in solar hot water applications and other solar heating applications, including passive solar. But, its most common application is for electricity generation.
For the remainder of this lesson, and the following lesson, we will be considering renewable energy sources used to generate electricity: hydropower, then wind and solar (in the next lesson).
Renewable Energy for Electricity Generation
In their most recent International Energy Outlook (2021) [26] with global electricity projections, the EIA reports that renewable energy is the fastest-growing source of electricity generation (not just capacity!) in the IEO2021 Reference case through 2050 (see Figure 8.6). They report that:
Globally, incremental electricity generation comes largely from renewable resources, beginning in 2025. As renewables—particularly solar and wind—become cost-competitive, the IEO2021 Reference case projects that all post-2020 electricity generation growth in OECD regions will come from those sources and that they will displace an increasing share of existing non-renewable, mostly fossil fuel-based, sources. In non-OECD regions, we project that electricity generation from renewable sources account for about 90% of generation increases from 2020 to 2050. Because electricity generation grows at almost twice the rate in non-OECD regions than in OECD regions in the Reference case, the non-OECD regions add over two times the generation from renewable sources compared with the OECD regions.This projected growth in renewables is uncertain and may largely depend on changes to regulatory policies and market rules, large and cost-effective supply chains to support renewable installations, and a sufficient amount of conventional generation technologies or storage to back intermittent renewable capacity.
Renewable electricity generation grew in 2020 despite the Covid-based economic downturn. In their Global Energy Review 2021 [27], the IEA noted the following:
Renewable energy use increased 3% in 2020 as demand for all other fuels declined. The primary driver was an almost 7% growth in electricity generation from renewable sources. Long-term contracts, priority access to the grid, and continuous installation of new plants underpinned renewables growth despite lower electricity demand, supply chain challenges, and construction delays in many parts of the world. Accordingly, the share of renewables in global electricity generation jumped to 29% in 2020, up from 27% in 2019. Bioenergy use in industry grew 3%, but was largely offset by a decline in biofuels as lower oil demand also reduced the use of blended biofuels.
Renewable electricity generation in 2021 is set to expand by more than 8% to reach 8 300 TWh, the fastest year-on-year growth since the 1970s. Solar PV and wind are set to contribute two-thirds of renewables growth. China alone should account for almost half of the global increase in renewable electricity in 2021, followed by the United States, the European Union and India.

Click link to expand for a text description of Figure 8.6
| Fuel Type | 2020 | 2025 | 2030 | 2035 | 2040 | 2050 |
|---|---|---|---|---|---|---|
| other | 1.1 | 1.1 | 1 | 1 | 1 | 1.1 |
| Nuclear | 2.5 | 2.6 | 3 | 3.1 | 3.2 | 3.1 |
| Natural Gas | 6.5 | 7 | 7.2 | 72 | 7.1 | 7.2 |
| Coal | 8.1 | 7.7 | 7 | 7.8 | 7.9 | 8 |
| wind | 1.9 | 3 | 3.2 | 4.2 | 5.1 | 6.8 |
| solar | 0.9 | 1.95 | 3.2 | 5.1 | 6 | 10.1 |
To Read Now
- Read "Renewable Energy Market Update 2021 [29]" from the IEA.
- Read from the beginning through "Forecast additions for 2021 and 2022 have been revised upwards by over 25% from last year" in "Renewable Energy Market Update 2021: Renewable electricity [30]" from IEA.
- (OPTIONAL) the Electricity [31]section of the IEA's Global Energy & CO2 Status Report [32].
Optional Reading
- The Electricity [31]section of the IEA's Global Energy & CO2 Status Report [32].
Hydropower Technology
In 2020, about 28% of the world's electricity was generated from renewable energy sources. Of that, about 57% came from hydropower (down from 77% in 2012). Between 2020 and 2050, the Energy Information Administration (in the IEO2021 Reference case [33]) projects that hydropower generation will increase 1.1% per year, while renewable electricity is expected to grow by over 4% per year. Because of this, the EIA projects that hydropower will drop to just over 29% of the total renewable energy generation in 2040 and 23% of the total renewable energy generation in 2050. (Just a few years ago, they projected over 50% in 2040. They did not expect solar and wind to grow as rapidly as they have.) This drop in total percentage is very apparent in the chart below. (Note that the chart below uses the same data as the chart on the previous page, but is expressed as a percentage instead of total generation.)
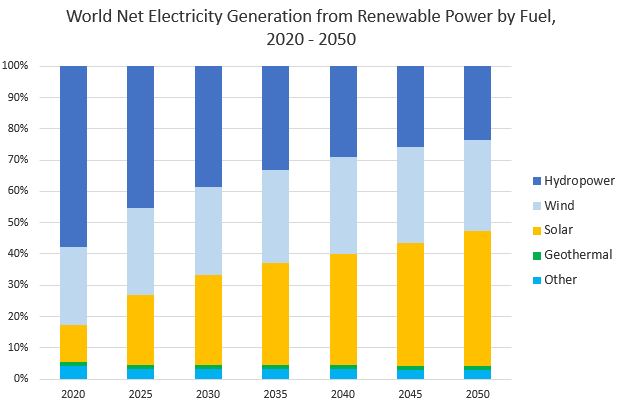
Click link to expand for a text description of Figure 8.8
| Fuel Type | 2020 | 2025 | 2030 | 2035 | 2040 | 2050 |
|---|---|---|---|---|---|---|
| Other | 291.3 | 332.8 | 399.7 | 488.7 | 556.7 | 689.5 |
| Geothermal | 09.1 | 129.3 | 188.4 | 214.0 | 238.6 | 253.9 |
| solar | 831.9 | 2274.8 | 3655.6 | 4948.8 | 6391.4 | 10152 |
| Wind | 1741.4 | 2814.2 | 3583.5 | 4532.7 | 5525.6 | 6833.5 |
| Hydropower | 4034.3 | 4619.6 | 4921.4 | 5065.2 | 5337.0 | 5548 |
In their "2020 Hydropower Status Report [34]" (an outstanding resource for international hydropower trends!) the International Hydropower Association (IHA) reports that 15.6 GW of new hydropower capacity was installed in 2019 (down from 21.9 GW in 2017 and 33.7 in 2015). At the end of 2019, worldwide hydropower capacity was about 1,308 GW (up from 1,036 GW in 2014). Total generation was a record 4,306 TWh, which was "the single greatest contribution from a renewable energy source in history", which IHA states avoided "an estimated 80 - 100 million metric tonnes of carbon emissions." Brazil led all other countries in increased capacity, with over 4.91 GW of growth in 2019, followed closely by China at 4.17 GW of additional capacity.
Types of Hydropower Plants
There are three general types of hydropower stations:
Run of River (or Diversion), electricity is generated through the flow of a river.
Reservoir (or Impoundment), flowing water is stored in a reservoir where the release of the water to generate electricity can be controlled.
Pumped Storage, where water is pumped from a lower reservoir to a higher reservoir, so that it can be released to generate electricity when needed.
To Read Now
- Visit the Office of Energy Efficiency and Renewable Energy (EERE) and read "Types of Hydropower Plants [35]"
Also read the following to get a sense of how hydropower works, particularly in impoundment systems:
- From the U.S. Geological Survey, read "The flow of water produces hydroelectricity [36]" and "Hydroelectric Power: How it Works [37]"
- From the Tennessee Valley Authority, read "How Hydroelectric Power Works [38]" and watch the embedded video.
After reading through the information on the link above, please watch the following (3:50) video from the U.S. Department of Energy.
To Read Now
Visit the Foundation for Water & Energy Education.
Take the Walk Through a Hydro Project [40] tour, click through all 10 steps.
Optional
Take the Fish Passage [41] tour, click through all 5 features (Spillways, Turbines, Juvenile Fish Transportation, Bypass Systems, Fish Ladders).
To Read Now
Read an article from Yale 360 [42] that illustrates how pumped storage can be integrated with other renewable energy sources.
A fourth emerging type of hydropower is marine and hydrokinetic, where electricity is generated from the energy of waves, tides, ocean, and river currents. Data are hard to come by, but in their 2013 Hydropower Report [43] the International Hydropower Association estimates global installed tidal and ocean capacity was about 515 MW at the of 2012, with roughly an additional 3,000 MW of "pipeline capacity" (planned).
Global Hydropower and Sustainability
Global Trends
In the 2019 International Energy Outlook [45], the Energy Information Administration projects that most new hydroelectric development will take place in non-OECD countries. In their 2016 Hydropower Report [46], the International Hydropower Association identified the following key trends and developments driving this growth:
- New international policy and agreements
- Advanced hydropower control technologies enabling renewable hybrids
- Climate aspects
- The value of pumped storage being recognized worldwide
- New financial instruments
- Climate bonds attracting strong interest
- Mergers and acquisitions pointing to a larger role for the private sector
- The China sector going global
- Transformative projects in Africa
- Hydropower driving regional connection
To Read Now
The International Hydropower Association is an excellent resource for hydropower information. Keep in mind that they are an industry organization, so they promote the interests of the industry and tend to shall we say "look at the bright side" of hydropower. That stated, they are a good source of data, especially on the status of hydropower across the world.
- Read pp. 7 - 9 of their "2021 Hydropower Status Report [47]." (Feel free to browse the rest.)
Hydropower and Sustainability
The World Bank supports the "responsible development of hydropower projects of all sizes and types—run of the river, pumped storage, and reservoir—including off-grid projects meeting decentralized rural needs." In a world where more than a billion people lack access to electricity, and the quality of life it provides, hydropower has great promise, if done responsibly. However, as the World Bank points out in their Overview [48]of hydropower: "While hydropower development offers great opportunities, it also comes with complex challenges and risks that vary significantly by the type, place, and scale of projects. Factors such as resettlement of communities, flooding of large areas of land, and significant changes to river ecosystems must be carefully considered and mitigated." All of these problems have arisen to varying degrees in projects across the world, so hydropwer should be deployed carefully if sustainability is one of the goals of the project.
In 2010, an international Hydropower Sustainability Assessment Protocol was launched. According to the Hydropower Sustainability Assessment Protocol [50]: "The Protocol was developed through 30 months (2008–10) of cross-sector engagement, including a review of the World Commission on Dams Recommendations, the World Bank Safe Guard Policies and the IFC Performance Standards. During this period, a multi-stakeholder forum jointly reviewed, enhanced, and built consensus on what a sustainable project should look like." This protocol involved "representatives of environmental NGOs (WWF, The Nature Conservancy), social NGOs (Oxfam, Transparency International), development banks, governments (China, Zambia, Iceland, Norway), and the hydropower sector."
The Hydropower Sustainability Assessment Protocol addresses the three pillars of sustainability for hydropower: environmental, social, and economic. Environmental issues include those arising from hydropower construction and operation related to broad areas of water quality, sedimentation, and habitat. While hydropower has the potential to reduce poverty and improve quality of life, it can also be the cause of population displacement and other negative social impacts on local and indigenous communities. Hydropower can be a tool of economic development with many benefits for local communities, if (big IF), economic benefits are distributed equitably between "the government, the project proponents, and stakeholders who receive the electricity services and the local communities who bear the impacts of a development."
To Read Now
- Visit the Hydropower Sustainability Assessment Protocol, [51] and browse the Home page and the overview page [52]. You'll use info in the ESG Gap Analysis Tool [53] page as part of this lesson's assignment.
For an excellent discussion of river-related environmental factors, review the following.
- From the Foundation for Water & Energy Education, read "Changes to the Ecosystem [54]"
Optional Reading
- "Changing Habitat Conditions for Fish and Wildlife [55]" from the same document.
Lesson 8 Assignment
Weekly Activity 8
Deliverables
Complete "Weekly Activity 8," located in the "Weekly Activities" folder under the Modules tab. The activity may include a variety of question types, such as multiple choice, multiple select, ordering, matching, true/false, and "essay" (in some cases these require independent research and may be quantitative). Be sure to read each question carefully.
Unless specifically instructed otherwise, the answers to all questions come from the material presented in the course lesson. Do NOT go "googling around" to find an answer. To complete the Activity successfully, you will need to read the lesson, and all assigned readings, fully and carefully.
Each week, a few questions may involve research beyond the material presented in the course lesson. This "research" requirement will be made clear in the question instructions. Be sure to allow yourself time for this! You will be graded on the correctness and quality of your answers. Make your answers as orderly and clear as possible. Help me understand what you are thinking and include data where relevant. Remember, numbers should ALWAYS be accompanied by units of measure (not "300" but "300 kW"). You must provide ALL calculations/equations to receive full credit - try to "talk me through" how you did the analysis.
This Activity is to be done individually and is to represent YOUR OWN WORK. (See Academic Integrity and Research Ethics [56] for a full description of the College's policy related to Academic Integrity and penalties for violation.)
The Activity is not timed, but does close at 11:59 pm EST on the due date.
If you have questions about the assignment, please post them to the "Questions about EME 444?" Discussion Forum. I am happy to provide clarification and guidance to help you understand the material and questions (really!). Of course, it is best to ask early.
Summary and Final Tasks
With this lesson, we continued our survey of energy industries based on energy sources. In this lesson, you learned about the natural gas industry--from exploration and extraction, transportation, resource estimates, demand, usage, and externalities.
You learned:
- about sources of renewable energy, in the USA and worldwide;
- to quantify biomass and hydropower energy sources, in the USA and worldwide;
- to explain biomass conversion processes, including feedstocks and products of each;
- about biomass logistics and identify major operations;
- details about major factors related to bioenergy economic, social, and environmental sustainability;
- appropriate and correct units of measure to use with electricity data;
- about worldwide trends and projections for electricity generation from renewable sources;
- the major types and components of hydropower plants;
- to apply major factors related to hydropower economic, social, and environmental sustainability.
Have you completed everything?
You have reached the end of Lesson 8! Double-check the list of requirements on the first page of this lesson to make sure you have completed all the activities listed there.