Lesson 3: Annual Percentage Rates, Salvage Value, Bond Investment and Financial Cost of Capital
Introduction
Overview
In Lesson 3, we will learn about Annual Percentage Rates (APR), Salvage Values, Bond Investments, Financial Costs, and Opportunity Costs of Capital. APR is another rate that is important to this class. Bond is a common investment tool these days. After this lesson, students will also be able to distinguish the financial cost of capital and the opportunity cost of capital. Similar to the previous lesson, the introduction in this class will be based on examples, textbook reading, and assigned reading materials.
Learning Objectives
At the successful completion of this lesson, students should be able to:
- understand Annual Percentage Rate and how to calculate it;
- evaluate the value of a bond and understand the cash flow pattern of a bond;
- demonstrate the concept of financial cost of capital and opportunity cost of capital; and
- evaluate a project(s) using Net Present Value, Benefit Cost Ratio, and Present Value Ratio.
What is due for Lesson 3?
This lesson will take us one week to complete. Please refer to the Course Syllabus for specific time frames and due dates. Specific directions for the assignment below can be found within this lesson.
| Reading | Read Chapter 3 of the textbook. |
|---|---|
| Assignment | Homework and Quiz 3. |
Questions?
If you have any questions, please post them on our discussion forum (not email), located under the Modules tab in Canvas. I will check that discussion forum daily to respond. While you are there, feel free to post your own responses if you, too, are able to help out a classmate.
Annual Percentage Rates (APR)
Annual Percentage Rate (APR) is usually used for loans, mortgages, and so on. APR represents an annualized expression of the cost of borrowing money.
When you take out a loan or mortgage on a property, in addition to the interest, you are required to pay some other transaction costs such as points*, loan origination fees, a home inspection fee, mortgage insurance premiums, … . Considering these costs, the amount of money that you will receive is actually somewhat less than what you requested. APR is the expression that reflects some of these costs, and under the Federal Truth in Lending Law, Regulation Z, the lender is required to provide this information to the borrower. Since APR includes mentioned transaction costs, it is higher than interest rates. You can think of APR as the rate of return on the loan taking process considering its costs.
* Loan points are a percentage of the loan value that is deducted as transaction cost.
APR can be a good tool for comparing different loans offered by lenders. But there are two issues that need to be considered before comparing APRs:
- how the lender calculates APR and what costs are included;
- the fact that the difference between APR and loan interest rate is higher for smaller loans with shorter lifetimes, considering similar costs.
For More information about APR please watch the video linked below.
Annual Percentage Rate Video (1:34) [1]
Investopedia presents: Annual Percentage Rate
The annual percentage rate or APR is the cost per year of borrowing. By law, all financial institutions must show customers the APR of a loan or credit card. Which clearly indicates the real cost of the loan. APR is not the same as the interest rate on a loan. Loans charge and interest rate but usually also charge other fees such as closing costs, origination fees, or insurance costs which are typically wrapped into the loan. If two loans have the same interest rate but one has much higher fees than the other, simply shopping by interest rates won’t give an accurate comparison of the loan's true cost. That’s why there is an APR. By factoring in other fees APR gives a more accurate estimate of the cost per year of a loan. For this reason, the APR is generally higher than the interest rate.
For example, a mortgage company may offer a customer an interest rate of 4% on a mortgage loan of $100,000 but after closing costs and other fees, the loan may have an APR of 4.1%. Unfortunately, not all financial institutions include the same fees in their APR calculation, so APRs are not always a perfect comparison tool. When comparing load or credit card APR’s ask what fees are included so your comparison is accurate.
Example 3-1
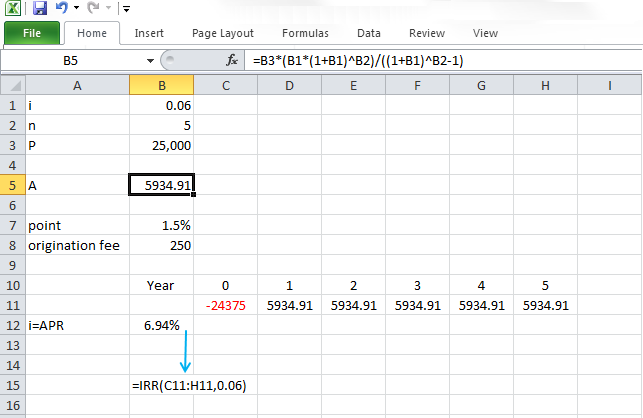
Calculate the APR for a 5-year, $25,000 loan with the interest rate of 6% (compounded annually), considering 1.5 points and loan originating fee of 250 dollars. Assume all the costs are deducted at the time of taking the loan (present time).
Note: 1.5 points equals a cost of 1.5% of the loan value.
First, the uniform series of annual payments needs to be calculated.
Regarding Table 1-12 and Equation 1-6
Then, we have to calculate the costs and deduct them from the loan:
So, borrower will receive $24,375 at the present time and pay $5,934.91 to the bank, each year, starting from end of the year 1:
Now, we have to calculate the rate of return for such a project.
| Loan-cost= 24,375 | A=5,934.91 | A=5,934.91 | A=5,934.91 | A=5,934.91 | A=5,934.91 |
|
|
|||||
| 0 | 1 | 2 | 3 | 4 | 5 |
Present value of loan – present value of the costs = present value of all annual payments
With the trial and error technique, explained in the Lesson 2 section “Break-Even and Rate of Return (ROR) Calculations II,” we can calculate i =6.94% as the APR for loan.
Please watch the following video, Calculating APR for a loan or mortgage (4:43).
PRESENTER: In this video, I'm going to explain how to calculate Annual Percentage Rate, or APR, for loans or mortgages. APR is a parameter that shows the annual cost of borrowing money. When you're going to take out a loan or mortgage on a property, in addition to the interest, you will pay some other transaction costs, which usually includes points, loan origination fees, home inspection fee, mortgage insurance premiums, and closing costs.
So eventually, you will receive a little bit less than the amount that you ask for for the loan or mortgage. APR is the parameter that helps you calculate the true cost of borrowing money. APR reflects some of these costs, but not all of them. So when you take a loan or mortgage, you need to ask what costs are included in the APR.
So APR is very close to the interest rate of the loan or the mortgage, but it will be a little bit higher because you receive a little bit less amount of money. Let's work on this example. Let's assume we're going to take $25,000 of loan at the present time with the interest rate of 6%, compounded annually. And we have to pay off the loan in five years.
And costs are going to be 1.5 points. And loan originating fee of $250. Let's calculate the APR for this loan.
The first thing that needs to be calculated is the uniform series of annual payments that we have to pay each year to pay off the loan. So we can use the factor A over P to calculate this uniform series of annual payments. So $25,000, multiply the factor A over P and the equation, and the result. So we have to pay $5,935 per year for five years to pay off the loan.
In the next step, we have to calculate the loan costs. Here, we have points and loan origination fee. We have 1.5 points, which means the cost is going to be 1.5% of the total original amount of loan $25,000, which comes to $375, and loan origination fee, which is $250. So total cost of the loan is going to be $375 plus $250, which comes to $625.
In the next step, we have to deduct the loan cost of $625 from the original amount of the loan, which was $25,000. We are going to actually get $24,375 at the present time, but we have to pay $5,935 per year. In order to calculate the APR of this project, we need to calculate the return on this project.
Let's say you are going to receive $24,375, and you need to pay $5,935 per year for five years. So in order to calculate the rate of return, we write the equation present value of loan minus present value of cost should be equal to present value of all annual payments. And we calculate the rate of return for this project, which will be 6.94%.
And this is going to be the APR of the loan. Please note that APR should be very close to the interest rate. As we can see here, the APR of 6.94% is very close to the loan interest rate of 6%.
Excel formula to calculate Rate of Return
Rate of return for an investment can be determined by the try and error method that is previously explained. Also, a convenient way to learn to calculate rate of return is to use Microsoft Excel or Google Sheets and apply Internal a Rate of Return (IRR) function to the cash flow.
Note: You have to enter the occurred amounts in the spreadsheet in the form of cash flow (you can enter the years in horizontal or vertical direction). It means inflow and outflow of cash should be entered with different signs (depending on the project). So, you can enter the loan with negative signs at the present time and annual payments in following years with positive signs.
More information about the IRR function in provided in following links.
IRR Function in Microsoft Excel [2]
Please watch the following video, Internal Rate of Return (1:58).
The IRR function calculates the internal rate of return of a series of cash flows. In this example, we have a series of cash flows, starting with an initial investment, a negative number in Period 0, and then a whole bunch of cash inflows over the next five years. We'd like to work out what the internal rate of return of these cash flows are.
If we click in the cell where we want the result, we can activate the Function Wizard. We can go to the Financial category, go to IRR. And when we say OK, we are asked for these arguments.
The first one is the values, which is basically an array or reference to cells that contain the numbers for which we want to calculate the IRR. So in that case, it would be this list here. And then you are asked for a guess. And in some cases, the IRR cannot come up with a number. You need to put in a guess. And generally, I'll put in 0.1, or 10%. And when you click OK, you'll see that the IRR is calculated.
In order for the IRR to work, you need to understand two issues. The first is that your series of cash flows must contain at least one negative number and at least one positive number in order for it to work, otherwise it'll deliver an error message.
The second issue is that unlike the NPV function, the IRR function assumes that the first value it is given occurs in Period 0, and after that it goes to Period 1, 2, whereas the NPV function assumes that the first number it's given occurs at the end of Period 1. This is extremely important, especially if you're trying to reconcile your NPVs to your IRR numbers.
Figure 3-1 displays the APR calculations for Example 3-1.
Bond Investment
Please read the materials and watch the videos in the following links:
Please Read the Material and Watch The Videos in These 2 Links
Investopedia Dictionary: Bond [4] (1:46).
Investopedia Dictionary: Bond Yield [5] (1:56).
Coming Soon
Investopedia presents: Bond Yields
Two popular bond yield measures are the current yield and the yield to maturity. Current yield is the interest it pays annually divided by the bond’s current price. This calculation tells investors what they will earn from buying a bond and holding it for one year. Jane is thinking about buying a bond for $100 with a $10 annual coupon she divided $10 by $100 to find it’s current yield is 10%. Since bond prices constantly change due to market and economic conditions jane might not actually earn 10% her actual return will depend on how long she holds the bond and its price when she sells it. Jane might sell the bond in two years for $75. So, while she earned $20 for the 2 years she held it since she sold it for $25 less that she bought it for she actually lost $5. The current yield helps her approximate what she might earn which helps her decide whether or not to invest. Since she wants to buy a bond Jane also needs to consider yield to maturity: YTM which is how much she’ll earn if she holds the bond until it matures, that is, if she doesn’t sell before the maturity date of the bond. YTM is expressed as an annual rate and it accounts for what all of a bonds future coupon payments are worth today at their present value. Jane needs to know the bonds market price, par value, coupon interest rate and time to maturity to calculate YTM. She plugs these values into a computer program that assumes coupon payments are reinvested at the same rate as the bonds current yield of 10%. YTM is a complex calculation but it gives Jane a better idea of her future returns and lets her compare bonds with different maturities and coupons.
Please watch the following video, Investing Basics: Bonds (3:56).
PRESENTER: Bonds are a common investment. However, to many investors, they remain a mystery. So let's explore what a bond is, and how it might benefit your investment portfolio.
A bond is simply a loan given to a company or government by an investor. By issuing a bond, a company or government borrows money from investors, who in return are paid interest on the money they've loaned. Companies and governments issue bonds frequently to fund new projects or ongoing expenses. Some investors use bonds in hopes of preserving the money they have, while also generating additional income. Bonds are often viewed as a less risky alternative to stocks, and are sometimes used to diversify a portfolio.
Consider this example. The city of Fairview wants to build a new baseball stadium, so it decides to issue bonds to raise money. Each bond is a loan for $1,000, which Fairview promises to pay back in 10 years. To make this loan more attractive to investors, Fairview agrees to pay an annual interest rate of 5%, which in the bond world is also known as a coupon rate. An investor buys the bond at face value for $1,000.
Now let's fast forward. Each year, the city of Fairview pays the investor $50. These regular interest rates continue for the length of the bond, which is 10 years. Once the bond reaches maturity, the investor redeems his bond, and Fairview returns his $1,000 principal investment. This bond was a good deal for both the city and our investor. Fairview got the money it needed to build the stadium, the investor received regular interest payments and the return of the original investment.
Because a bond offers regularly scheduled payments and the return of invested principal, bonds are often viewed as a more predictable and stable form of investing. Compare regular payments of a bond to the experience of owning a stock. With stocks [although returns are typically greater] profits and losses are driven by market forces, and are considerably less predictable. Of course, like any investment, bonds are not without risk.
One risk that bond investors face is the possibility that the issuer defaults on paying back the principal. This is what is known as default risk. Typically, bonds with higher default risk also come with higher coupon rates. The amount of risk depends on the financial stability of the issuer. For example, most governments are generally considered stable issuers, and issue bonds with a relatively low coupon rate. Corporate bonds typically represent a greater risk of default, as companies can and do go bankrupt. That's why corporate bonds often offer a higher coupon rate.
Several credit rating agencies [such as Moody's and Standard and Poor's] assign rankings to different bonds. This allows bond investors to gauge the financial strength of the bond issuer. These ratings agencies often use different criteria for measuring risk, so it's a good idea to compare ratings when considering a particular bond. And keep in mind rating agencies aren't always accurate. So be sure to research a bond and its risks thoroughly before investing.
Another risk to consider is interest rate risk. This is the risk that interest rates will go up, and any bonds you own will be worth less if sold before their maturity date. After all, when interest rates rise, more investors allocate their money into the new, higher interest rate bonds. If you wanted to unload a low interest rate bond to take advantage of these new rates, you would have to sell your bond at a discount to make it a worthwhile purchase for another investor.
Capital preservation and income generation are just two ways bonds might be part of a diversified portfolio. Many investors use a mix of stocks and bonds to pursue their investment goals. And because bonds move differently from stocks, they can help increase or protect portfolio returns. Keep in mind that this discussion showed you one simplified way that investors might use bonds and only a few of the risks to consider. Like all investments, bonds are complex and have a variety of uses and risks. Before you invest in bonds, It’s important that you invest in your own financial education.
[Take control of your financial future today with premier education brought to you by Investools from TD Ameritrade Holding Corp.]
A bond is a financial tool that can help the government and corporations raise money for their investments. A bond is a document that simply means “I owe you” or “IOU.” The Government and corporations issue the bond for a specified period of time (can be weeks to years). Buyers pay the bond at face value (the price that is written on the bond) and purchase the bond once it is issued. In the end of the specified period (known as maturity date), buyers receive the face value. In return, bond issuers agree to pay a fixed annual amount as interest, called bond’s coupon. Some bonds allow the interest rate to be adjusted with inflation rate. And some bonds can be converted to common stock or other securities after a period of time. A good thing about a bond is that buyers don’t necessarily need to wait until the maturity date; they can sell their bonds before the maturity dates in the market. The price of a bond (a bond that is not new) depends on the financial market and interest rates in the market and can be higher or lower than its face value. If the interest rate in the market drops, then the bond can be sold at a higher price than the face value, and vice versa.
The organization that issues the bond usually backs (supports) it with some selected asset as collateral in case of bankruptcy. And if the issuer organization doesn’t provide real tangible assets for supporting the bond, the bond is called a “junk bond.” In general, bonds with a higher level of risk pay higher interest rates.
Brokers and investors usually measure economic performance in terms of compound interest rate of return, which is referred as “yield to maturity” (YTM), as well as the “current yield." Most bonds, debentures, and notes pay interest on a semi-annual basis, but related interest rates are described nominally. This means that the evaluation of a bond must be made on a semi-annual basis and then expressed as a nominal value.
The U.S. Government offers different types of securities [7] including:
- Treasury bills [8]
- Treasury notes [9]
- Treasury bonds [10]
- Treasury Inflation-Protected Securities (TIPS) [11]
- Floating Rate Notes (FRNs) [12]
Please read the materials provided in the above links.
If you would like to know more about the history of bonds and the bond market, you can find some interesting documentaries on YouTube.com.
Example 3-2
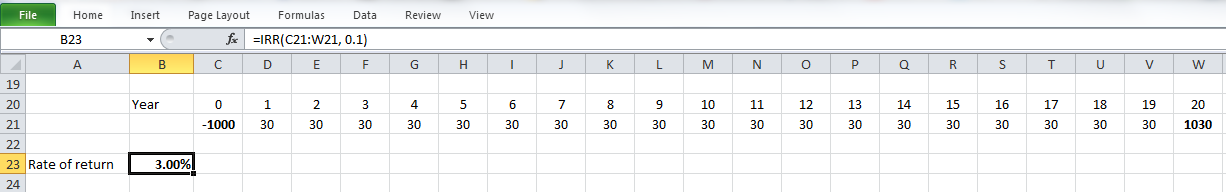
Calculate the rate of return for a new bond with a face value of $1000 dollars and a maturity date of 10 years that pays 30 dollars every six months.
| C = $1000 | I=$30 | I=$30 | I=$30 | L = $1000 | |
|
|
|||||
| 0 | 1 | 2 | ... | 20 | |
C: Cost
I: Interest Income (semi-annual)
L: Maturity Value
Present value of cost = present value of income
According to Table 1-12:
With the trial and error method, we can calculate that i = 3% per semi-annual period. So, the nominal rate of return equals 2*3 = 6% per year compounded semi-annually. In bond broker terminology, the term “yield to maturity” is used to describe this nominal rate of return and may be listed by acronym “YTM.”
The following figure shows how you can calculate rate of return using IRR function in Microsoft Excel. Please notice the figures and signs, especially the first and last years.
Old Bond Rate of Return Analysis
As explained before, buyers can sell their bonds in the market before their maturity dates.
Example 3-3
Assume person A buys the new bond that is explained in Example 3-2. After two years (in the end of the year), person A decides to sell the old bond to person B for 800 dollars. Calculate the rate of return of investment for person B.
Person B investment can be shown as:
| C = $800 | I=$30 | I=$30 | I=$30 | L = $1000 | |
|
|
|||||
| 0 | 1 | 2 | ... | 16 | |
We can write the equations for this investment as:
Present value of cost = present value of income
The trial and error technique or IRR function in Microsoft Excel gives that i = 4.82% per semi-annual period and a nominal rate of return 2*4.82 = 9.64%per year compounded semi-annually.
Note: the only thing different from previous the calculation is the time and investment cost.
Please watch the following video, Calculating return on a bond investment (7:53).
PRESENTER: In this video, I'm going to talk about bonds and how to calculate the return on a bond investment.
Bonds are financial tools that can help governments and corporations raise money for their investments. So a bond is a piece of document that simply says, I owe you. So there are three things that you need to know about the bond. The first one is the face value. When buyers buy bond, they pay the face value. The face value is the amount that is written on the bond at the time that it's issued. The second thing that you need to know about the bond is the maturity date, which actually means the expiration date. It is the date that buyers receive the face value of the bond. The third one is the interest that the issuer of the bond pays to the buyers of the bond, and it is called bond coupon and it will be paid as fixed amount. It can be annually or semiannually, every six months.
Some bonds allow the interest rate to be adjusted with the inflation rate. Some bonds can be converted to some common stock or other securities. The good thing about bond is the buyer of the bond doesn't need to wait until the maturity date and receive his or her money. Buyers of the bond can sell the bond at any time before the maturity date.
The price of a bond is dependent on the financial market and interest rate in the market can be higher or lower than the face value. If the interest rate in the market drops, then bond can be sold at the higher price than the face value. For example, if you buy a bond and in the market, the interest rate drops, you can sell your bond at the higher price than the face value because the bond has coupon, which means that you're going to receive fixed amounts of payments per year or per six months, and these are fixed. If the interest rate in the market drops, your bond has higher value in the market.
Usually, the issuer of the bond has to support or back the bond with some selected asset as collateral in case of bankruptcy. Bonds with higher level of risk pay higher interest rate. The interest rate has to be reported nominally, but the interest can be paid on the semiannual basis.
Let's work on this example. Let's assume you are going to buy a bond that has a face value of $1,000 with a maturity date of 10 years that pays you $30 every six months, and you want to calculate the return on this investment.
First, we draw the time line. We are going to have 20 time intervals because there are 10 years and each six months, we are going to receive $30. We are going to have $1,000 investment at the present time, and we are going to receive $30 every six months, which are going to be 20 payments of $30. And in the end, we are going to receive the $1,000 of the face value of the bond. And we are going to calculate the return on this project.
We write the equation. Present value of the cost should be equal to present value of income. Present value of the cost is the $1,000 that we pay for this investment at the present time, and we are going to receive 20 payments of $30. And in the end of the 10th year, which is going to be the 20th period, we are going to receive the face value of $1,000.
And then we have to solve this equation using the trial and error method or IRR function in Excel, which I'm going to explain in the next video. And we calculate the i as 3% per semiannual. And then we need to calculate the nominal rate of return, which equals 2 multiply 3%, which will be 6% per year, compounded semiannually. So this investment of buying a bond at the present time at the price of $1,000 with a maturity date of 10 years and a coupon of $30 being paid every six months, is going to have the return of 6% per year compounded semiannually. The 6% nominal rate of return that we calculated is also called yield to maturity or YTM.
Now, let's work on an other example-- old bond rate of return analysis. Let's assume person A buys a new bond that is explained in the previous example, and then this person wants to sell the bond after two years to the person B at $800. Let's calculate the rate of return in this investment for person B.
So again, the first thing that we have to do is we have to draw the time line. And here, because person A is selling the bond after two years to person B, we are going to have 16 periods of six months. Person B is buying the bond at the cost of $800, and person B is going to receive $30 every six months for 16 periods of six months. In the end of the eighth year or 16 six months, person B is going to receive the face value of $1,000. Please note that person B is buying the bond at $800 but is going to receive the face value of the bond at the end of the maturity date.
And we write the rate of return equation. Present value of cost equal to present value of income. Cost is going to be $800, and person B is going to receive 16 payments of $30 every six months and $1,000 in the end of the 16th period. And we calculate the rate of return for this investment using the trial and error technique or IRR function in Excel, which is going to be 4.82%. And again, this is per semiannual period. We need to report that as the nominal rates per year. So we have to multiply by 2. So we are going to get 9.64% per year compounded semiannually. This is the return on this investment.
Example 3-4
Assume interest rates in the financial market dropped, which causes the price of an old bond to increase. So, person A in Example 3-2 can sell the old bond after two years (in the end of the year) to person B for 1200 dollars. Calculate the rate of return of investment for person B.
Similar to Example 3-3, person B's investment can be shown as:
| C = $1200 | I=$30 | I=$30 | I=$30 | L = $1000 | |
|
|
|||||
| 0 | 1 | 2 | ... | 16 | |
Present value of cost = present value of income
And rate of return per semi-annual period will be i = 1.58% and the nominal rate of return is: 2*1.58 = 3.16%per year compounded semi-annually.
Example 3-5
Now assume this situation: Since the interest rate dropped in the financial market, the issuer organization can call the old bonds after 4 years (from now -- total maturity period of 6 years). This means that at that time, the issuer organization takes the bond and pays the face value. Please calculate the rate of return for person B’s investment if he buys the old bond at $1200.
Person B's investment can be shown as:
| C = $1200 | I=$30 | I=$30 | I=$30 | L = $1000 | |
|
|
|||||
| 0 | 1 | 2 | ... | 8 | |
Note that the old bond will be called in 4 years from now after person B buys it.
Present value of cost = present value of income
The rate of return for person B’s investment will be i = 0.45% per semi-annual period and the nominal rate of return: 0.9% per year compounded semi-annually.
Financial Cost of Capital and Opportunity Cost of Capital
As briefly explained in the first lesson, the financial cost of capital for a project (for a privately owned company) can be the average cost of financing current projects (or under consideration projects). The opportunity cost of capital or minimum rate of return (denoted as “i*”) reflects other opportunities that exist for the investment of capital now and in the future. The opportunity cost of capital for an investment is higher and more important than the financial cost of capital. An investor will invest in a project only if the rate of return is higher than opportunity cost capital (minimum rate of return).
Rate of return is a decision method to accept or reject a project and it is not a reliable method to rank several projects in terms of investment. Also, the rate of return for a current project is not necessarily applicable to future projects. For example, if an investment project has the rate of return of 5%, but another investment with similar (or lower) risk (such as interest paid by the bank to the money in your account or interest from buying Treasury Bond) has the rate of return of 6%, then the minimum rate of return and opportunity cost of capital will be 6%, and the project is not acceptable for investment.
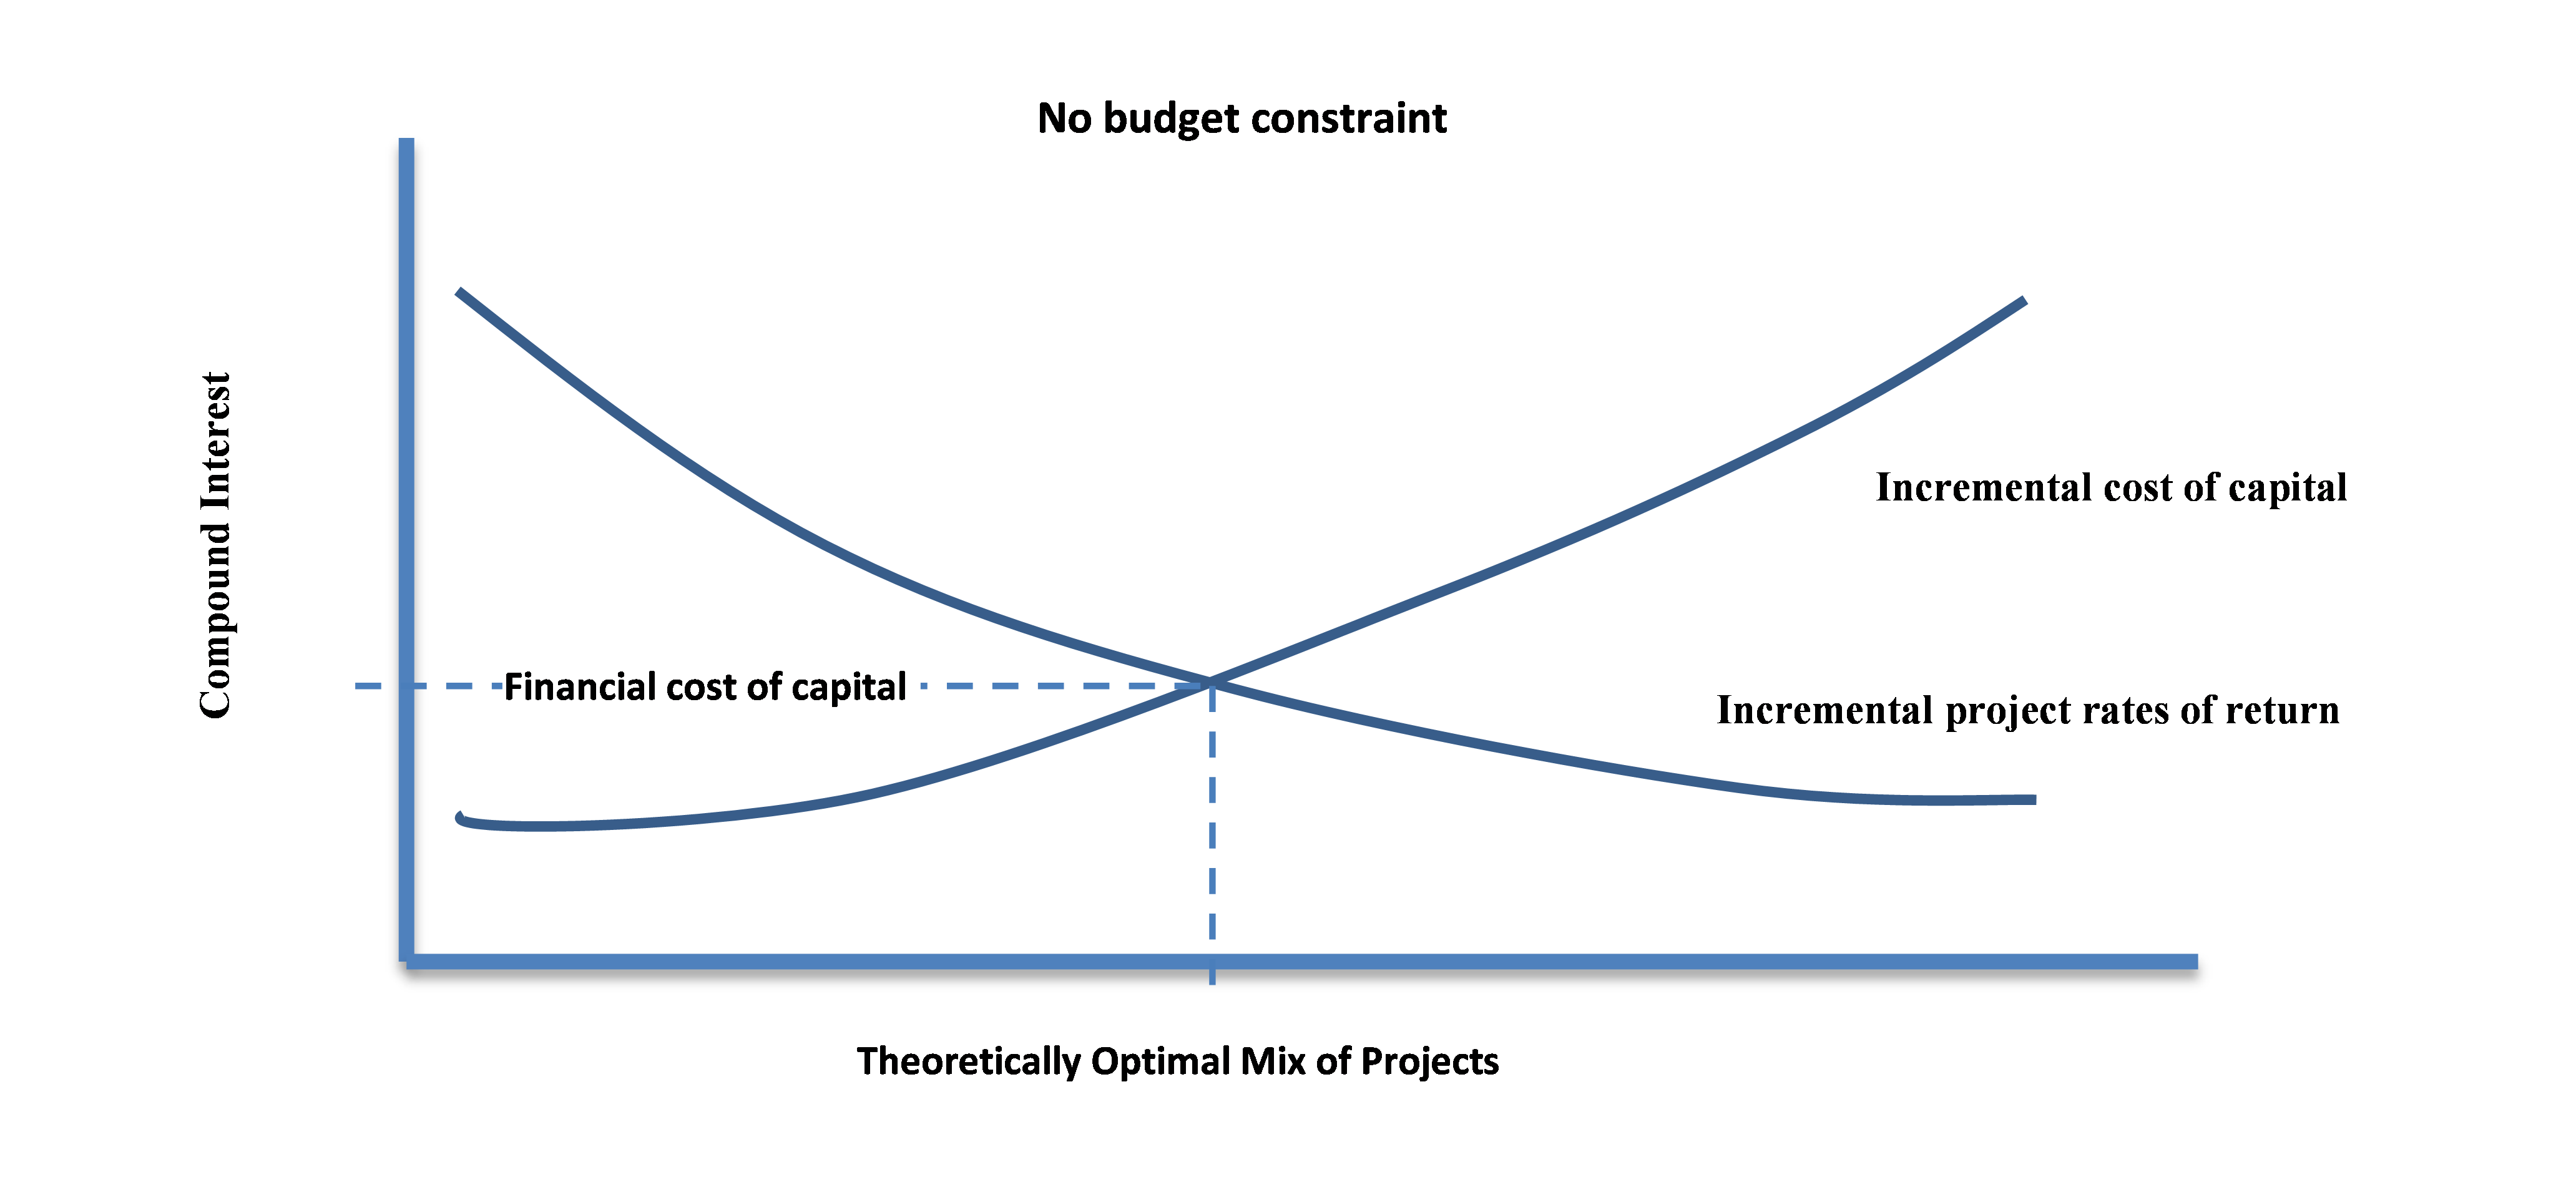
If a company doesn’t have budget constraints, then it would keep investing in a new project until the rate of return on the next project is less than the cost of raising money. See Figure 3-3, below.
But this assumption is not usually realistic, and in the real world, there is always a budget constraint. As Figure 3-4 shows, budget constraint causes the cost of the capital curve to move upward and also to the left. In this case, the financial cost of capital needs to be adjusted to a minimum acceptable rate of return (MARR). The minimum acceptable rate of return reflects the project’s rate of return that is given up for the project under consideration.
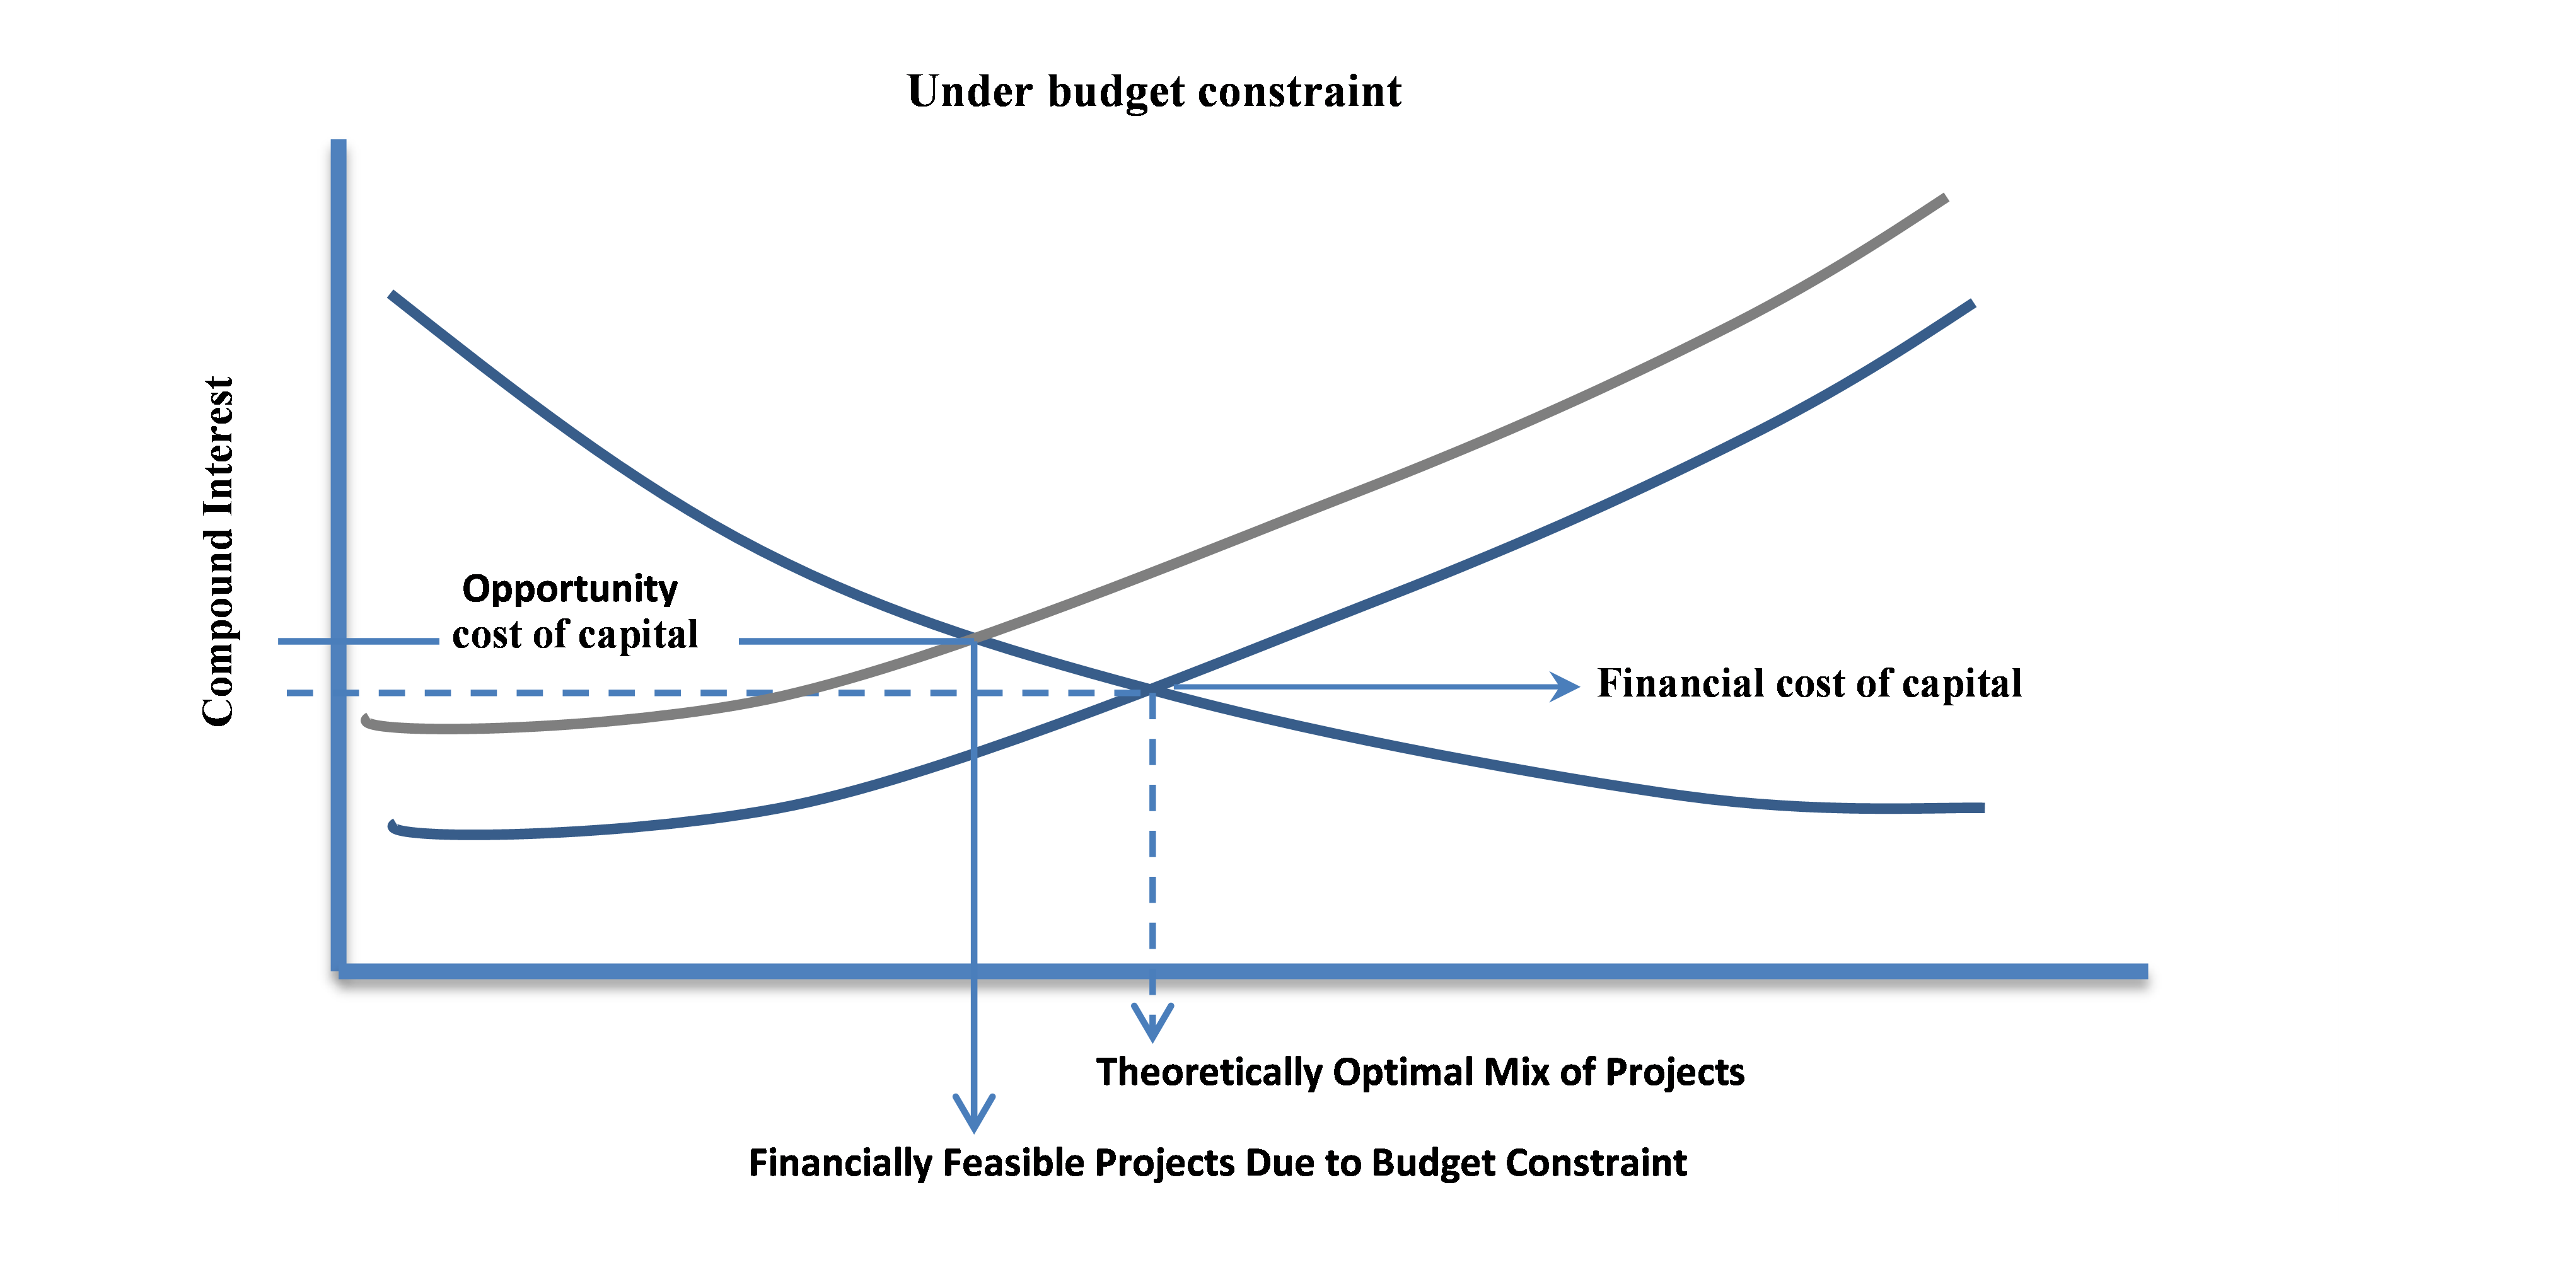
However, if the project that is under consideration is the only possible project or it is not comparable with other projects, or there is enough funding available for all other projects with a higher rate of returns, then the opportunity cost of capital can be equal to the financial cost of capital.
Net Present Value, Benefit Cost Ratio, and Present Value Ratio for project assessment
Net Present Value (NPV)
As explained in the first lesson, Net Present Value (NPV) is the cumulative present worth of positive and negative investment cash flow using a specified rate to handle the time value of money.
Or
Or
If the calculated NPV for a project is positive, then the project is satisfactory, and if NPV is negative then the project is not satisfactory.
The following video, NPV function in Excel, explains how NPV can be calculated using Microsoft Excel (8:04).
PRESENTER: In this video, I'm going to explain how to use NPV function in Excel to calculate the NPV of a cash flow. There are two main ways of calling NPV function in Excel. The first method is clicking in this little Fx here. When you click that, this window pops up, and then you can search the NPV function in this box.
You click Go. It finds the NPV function, or you can go to the Financial category here and you will find the NPV function. And then you click OK.
You can see three boxes here. The first one is asking you to enter the Rate. This rate is the interest rate that you're going to discount your cash flow when you calculate the NPV. You can write a number here, which is going to be 10%, or you can rate these from a cell, which I wrote 10% here. Then after, we can click this one or we can push Enter.
And then after, you can enter the cash flow. You can enter the cash flow one by one, in each of these values, or you can choose the cash flow as a series here. Then you click here. If you entered everything correctly, the NPV is going to be calculated and the function shows the NPV here. If something is wrong, you won't see a correct NPV here. Then I click OK. So as you can see, the NPV is calculated and shown.
The other way to call the NPV function is you just write equal sign, and then write NPV open parentheses, the first one, and then you can see did this thing pops up. In the first, you need to enter a rate. You can write a value here-- you can write 10%, or you can read it from this cell. And then you write a comma, and then you enter the values. You start from here, go all the way to the end of the cash flow. And you close the parentheses.
So one thing that you have to be very careful using the NPV function in Excel is NPV function in Excel always considers you are entering your cash flow from year 1. So if you have the cash flow that is happening at the present time, at time 0-- at year 0-- you have to enter that manually. NPV function in Excel does not consider any cash flow at time 0-- it doesn't understand a time 0. NPV assumes that you are entering everything from year 1.
So you can always double-check the result of this NPV function. If you calculate the present value of each of these payments, the summation of that discounted cash flow should be equal to this net present value. Let's quickly calculate that. Let's say we want to calculate the present value of these payments. The first one equals $50,000 divided by 1 plus interest rate. I put a dollar sign behind the column to fix this when I'm going to apply it to the other cells, and power, year.
So as you can see here, this is the present value of this $50,000 of investment. I apply that to the other cells. So the summation of this discounted cash flow, these present values, should be exactly the same as the NPV that we calculated using the NPV function in Excel, which you can see they are exactly the same.
So let's work on another example that has the cash flow at present time. So as you can see in this investment, we are going to have $60,000 of investment at present time, and also $50,000 of investment at year 1. This investment is going to yield the annual income of $24,000 a year, from year 2 to year 10. Let's see how we can calculate the NPV of this cash flow using the NPV function in Excel.
So as you can see here, because we are going to have a payment at present time, we need to enter that payment manually. So what we do is, we write the equal sign and then we add this payment, which is happening at the present time, or year 0. And then after, we use the NPV function for the rest of the cash flow. I write NPV-- I rate the interest rate from here. Then I select the cash flow, starting from the year 1 all the way to the year 10. I close the parentheses, and I press Enter. So this is the NPV, using the NPV function of this cash flow.
Let's double-check our result. Let's see if this is correct or not. So I'm going to calculate the present value of all these payments, and then the summation should be exactly same as this NPV-- using the NPV function. So present value equals this payment-- it is happening at the present time, so it doesn't need to be discounted. So it is equal same amount-- present value of this, $50,000, equals $50,000 divided by open parentheses 1 plus interest rate. I fix the column to make sure it doesn't change-- to make sure interest rates sale doesn't change when I'm going to apply to the other cells. I close the parentheses, and power, year. So this is the present value of this-- $50,000 happening at year 1.
So I apply this to the rest of cash flow, and the summation of this discounted cash flow should give me the exact same value as the NPV-- that I used the NPV function in Excel. As we can see, these are exactly the same.
So these are two ways of calculating NPV using Excel, and how we can double-check the other one.
In the video NPV and IRR in Excel 2010 [13] (8:59) you can find another useful video for calculating NPV using Excel NPV function. In this video, cash flow is formatted in the vertical direction (there is absolutely no difference between vertical and horizontal formatting, using spreadsheet).
In the following video, IRR function in Excel, I'm explaining how to calculate the Rate of Return for a given cash flow using Microsoft Excel IRR function (4:19).
PRESENTER: In this video, I'm going to explain how to calculate rate of return for a given cash flow using IRR function in Excel. There are two ways that we can call IRR function. First, we can click on this fx icon. This window pops up, and we can write IRR in this box, which is a search box. Go, it finds it. Or, we can choose the financial from this list and find the IRR.
When we choose IRR, this window opens up. And it has two boxes. The first box needs you to enter the cash flow. There's a very important point in calling Excel IRR function. That requires you to enter the cash flow, and it assumes your cash flow starts from year zero. So you should be very careful using IRR function in Excel. It assumes your cash flow starts from year zero or present time.
So I select the cash flow starting from year zero. And I click here or press Enter. So here, it already calculated the IRR. But sometimes, the IRR function cannot find a rate of return. So you need to give it an initial guess. If you don't have any assumption in your mind, just give it 10%. If still it doesn't calculate it, give it 20%, and so on. And you press OK. So as you can see here, the rate of return for this cash flow, starting from year zero, is 14.06%.
The other way to call the IRR function in Excel is just writing the IRR function. You write the equals sign, and then you write IRR. You can see Excel shows this here, shows the function here. You open the parentheses. You select the cash flow from starting from year zero all the way to the year 10. A comma, and the initial guess, which is going to be 10%. And the result.
So we can always double-check this result that we calculated rate of return using Excel IRR function. As you know, rate of return is a rate that makes NPV equal zero. So if I calculate the NPV for this rate, it should be exactly zero, or very close to zero. So let's see. Let's calculate the NPV for this rate.
So because we are going to have a payment at present time, I have to enter that payment manually. And then I have to calculate the NPV of the rest of the cash flows that start from year one using the NPV function.
NPV, open parentheses. Rates. I choose the rate. Comma, and then I select the cash flow that starts from year one. And I close parentheses. And you can see the NPV equals zero. So it shows that the rate of return that I calculated for this cash flow is correct.
Example 3-6:
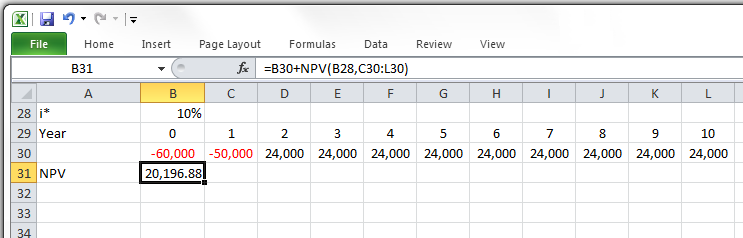
Please calculate the NPV for the following cash flow, considering minimum discount rate of 10% and 15%.
| C=60,000 | C=50,000 | I=24,000 | I=24,000 | ... | I=24,000 |
|
|
|||||
| 0 | 1 | 2 | 3 | ... | 10 |
C: Cost, I:Income
If using spreadsheet, following method can be more convenient:
Figure 3-5 illustrates the calculation of the NPV function in Microsoft Excel. Please note that in order to use the NPV function in Microsoft Excel, all costs have to be entered with negative signs.
Benefit Cost Ratio
Benefit Cost Ratio (B/C ratio) or Cost Benefit Ratio is another criteria for project investment and is defined as present value of net positive cash flow divided by net negative cash flow at i*.
For the project assessment:
- If B/C >1 then project(s) is economically satisfactory
- If B/C =1 then project(s) the economic breakeven of the project is similar to other projects (with same discount rate or rate of return)
- If B/C <1 then project(s) is not economically satisfactory
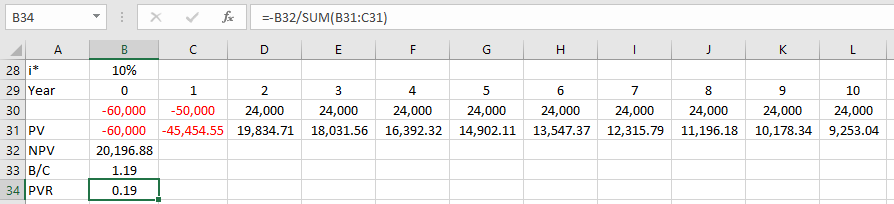
Present Value Ratio
Present Value Ratio (PVR) can also be used for economic assessment of project(s) and it can be determined as net present value divided by net negative cash flow at i*.
- If PVR>0 then project(s) is economically satisfactory
- If PVR=0 then project(s) is in an economic breakeven with other projects (with same discount rate or rate of return)
- If PVR<0 then project(s) is not economically satisfactory
Example 3-7
Calculate the B/C ratio and PVR for the cash flow in Example 3-6.
Figure 3-6 illustrates the calculation of the B/C function in Microsoft Excel. Please note that you need to use the absolute value in the denominator or multiply the answer by -1.
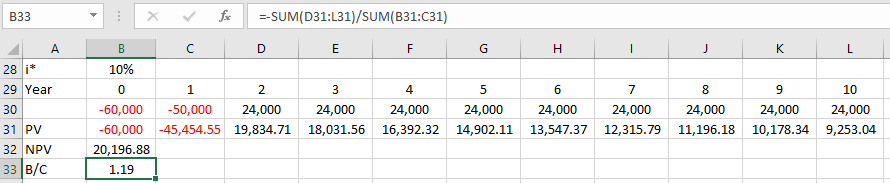
Figure 3-7 illustrates the calculation of the PVR function in Microsoft Excel. Please note that you need to use the absolute value in the denominator or multiply the answer by -1.
Summary and Final Tasks
Summary
In Lesson 3, we have learned that annual percentage rates (APR) represent an annualized expression of the cost of borrowing money, and how to calculate an APR based on a leader's cash flow. The salvage value is also introduced, which presents a positive cash flow for the project. Bonds are a very popular tool for corporations and governments to raise debt capital and we have learned the cash flows of a bond. The old bond rate or return with or without call privileges is also introduced. We also learned the concepts and effects of financial cost and opportunity cost of capital and in the last part we figured out how to evaluate a project(s) using Net Present Value, Benefit Cost Ratio, and Present Value Ratio.
Reminder - Complete all of the Lesson 3 tasks!
You have reached the end of Lesson 3! Double-check the to-do list on the Lesson 3 Overview page [14] to make sure you have completed all of the activities listed there before you begin Lesson 4.