
Flow charts are very useful because they allow us to graphically organize and codify a great deal of information in an easy-to-use roadmap. That is why you will find many flow charts in the book chapters and papers that you are reading for this class. There is a lot of flexibility on how you might build your own diagrams.
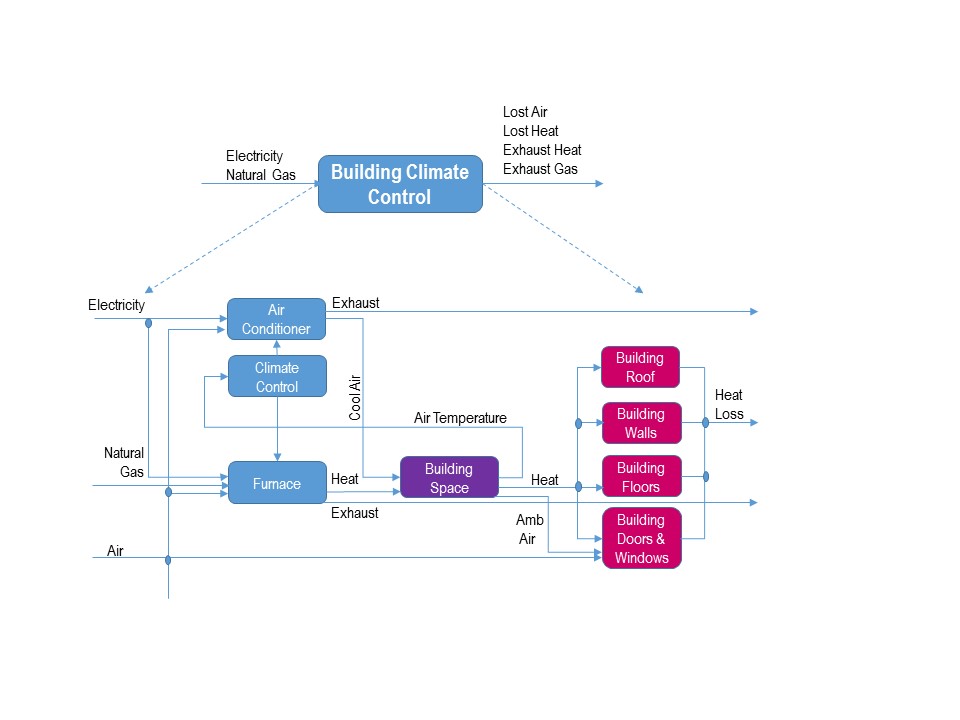
Figure 3.3: Energy flows in a building heating system.
Click for text description.
- Building climate control
- Input: electricity, natural gas
- Output: lost air, lost heat, lost exhaust, electricity
- Air conditioner
- Input: electricity, climate control, air
- Output: cool air, exhaust
- Climate control
- Input: air temperature
- Output: into the furnace
- Furnace
- Input: electricity, natural gas, air
- Output: exhaust, heat
- Building Space
- Input: cool air, heat
- Output: Heat, ambient air, air temperature
- Building roof/walls/floors/doors/windows
- Input: air, ambient air, heat
- Output: heat loss
Credit: Modified from Sustainability Science and Engineering, Volume 1: Defining Principles.
We note that inputs in the figure above are represented by arrows moving toward the system and outputs by arrows moving away from the system. We write the name of the input or output above the corresponding arrow. In general, if we are inputting energy from a wind turbine, we may want to write the average number of kilowatts/per day that the turbine produces above the " in="">