
Goals and Scope of the LCA:
The first step in conducting an LCA occurs prior to data collection; it consists of defining what will be measured, how it will be measured, and in what order. ISO 14041 and related publications create a framework for this analysis. Figure 4.4 shows how Goal and Scope setting can be subdivided. The results from an LCA must be expressed in physical or monetary units that are widely used in order to facilitate comparisons among alternative systems. In general, these values are termed Functional Units. Potential challenges include accuracy of measurement and availability of data.
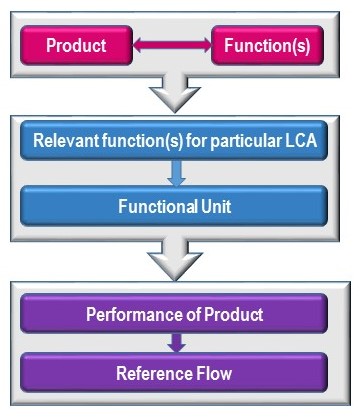
Elements of Goal and Scope definition as stated in ISO 14041
This flow chart begins at the top with the terms
- Relevant function(s) for particular LCA
- Functional Unit
- Performance of Product, and
- Reference Flow
Inventory Analysis:
Inventory analysis aims to produce a transparent and comprehensive analysis of a natural system. Here, ISO 14041 also provides a sequence of steps that may be followed to create this inventory (Figure 4.5).
- System Boundaries is a concept that originates in thermodynamics. As you may remember from the previous chapter, natural systems are inherently open - i.e., adiabaticity is not a good assumption in most cases. However, this is exactly what we are attempting to construct by binding all material and energy flows. For an LCA to be realistic, system boundaries must be comprehensive enough to include all the network supporting processes, but not large enough to introduce unnecessary complications. These requirements are difficult to meet. For most systems, some assumptions must be made. To create a transparent LCA, these assumptions and/or limitations need to be clearly stated. A common challenge faced while choosing system boundaries is that manufacturers seldom create a single product. Consequently, allocation, system expansion, causal allocation, and technical allocation are common sources of uncertainty in calculating inputs and outputs of material and energy.
- System boundaries must encompass all processes and transformation that result in Elementary Flows, which are the actual movements of energy and matter.
- The final stage of planning is to create a Life-Cycle Inventory Flow Diagram that outlines how data are to be collected and in what order, by establishing hierarchies, finding relationships among different subsystems, components and units, and disentangling aggregation of endogenous and exogenous flows.
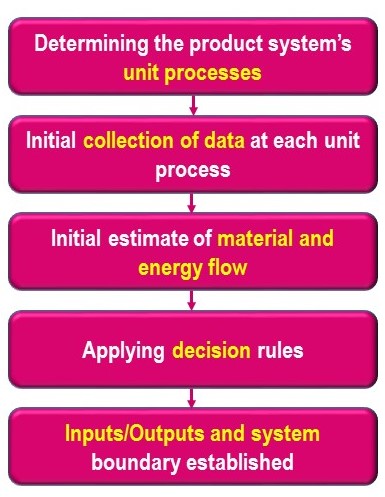
Inventory analysis flowchart for establishing inputs, outputs and system boundaries as stated in ISO 14041.
Five items are listed.
- Determining the product system's unit processes
- Initial collection of data at each unit process
- Initial estimate of material and energy flow
- Applying decision rules
- Inputs/Outputs and system boundary established
Impact Assessment:
According to ISO 14040 and ISO 14044, the impact assessment must include classification and characterization of data. In addition to these critical steps, the impact assessment may include economic and social dimensions.
- Classification involves assigning different sets of observations to more general categories.
- Once observations are sorted into relevant categories, the impact that each category has on the overall system is measured through the process of Characterization.
- Normalization is a concept that originates in statistical analysis of data. Here, different categories are measured against a common standard. In other words, we are finding out how much a result differs from the norm.
- In the context of the Impact Assessment, Classification and Grouping serve two different purposes. While classification creates physical and/or biological categories, grouping sorts categories into social/economically meaningful packages that allow prioritization.
- Another subtle difference comes from the aim of Normalization versus Weighting. Weighting re-scales the category results to express the relative social/economy importance of these results.