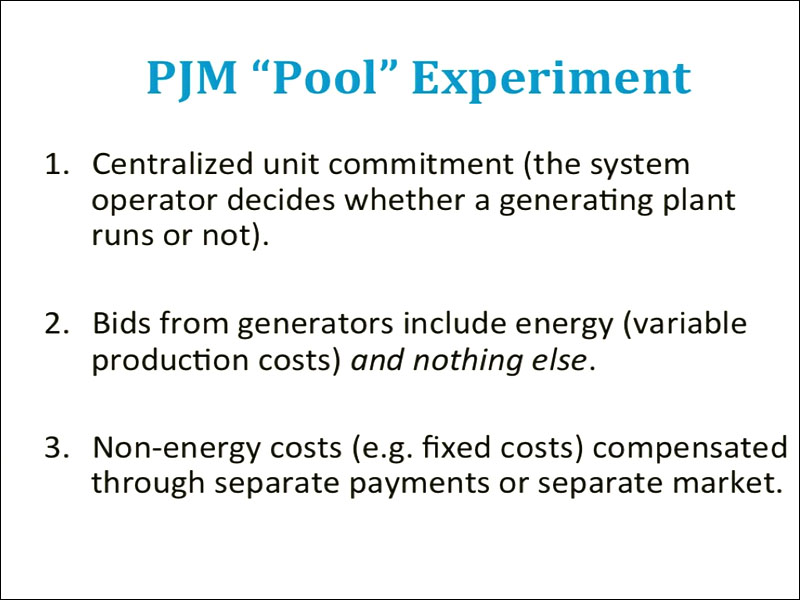
PJM - ah, they used a different model, a different market model, which is sometimes called a pool. And the way the PJM, or pool market, works is that individual generators commit their capacity to the market, or the pool. The pool decides which generators are going to run at which hours. The way that generators are allowed to structure supply offers is much more limited in the pool than it was in the power exchange. In the pool, the supply offers from generators basically just reflected variable cost. And so, capital cost recovery and other things were made up through separate payments or separate markets.
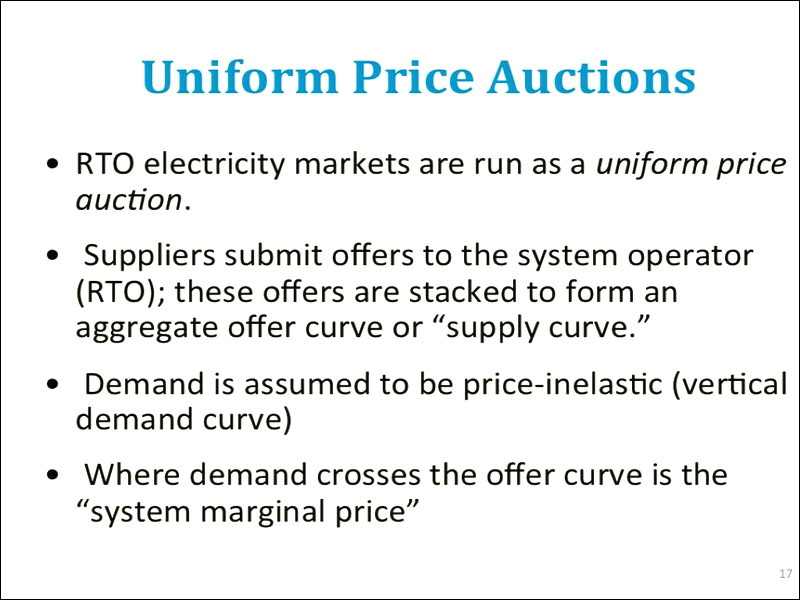
So the pool-type market has really become the dominant market model used in the US today. The pool-type market was, more or less, what FERC's standard market design looked like. The markets that are run by regional transmission organizations are all run as what we call uniform price auctions. They way that a uniform price auction works is that suppliers submit supply offers to the RTO and then these offers are aggregated to form a system supply curve. Originally, demand was assumed to be perfectly inelastic - which is the same thing as saying a vertical demand curve - so whatever demand happened to be, that's what it was and they would pay whatever price the market happened to produce. At the point where this vertical demand curve crossed the offer curve, or the supply curve, was the market clearing price, or what we call the system marginal price for that particular time. I'll show you a couple of different pictures of this.
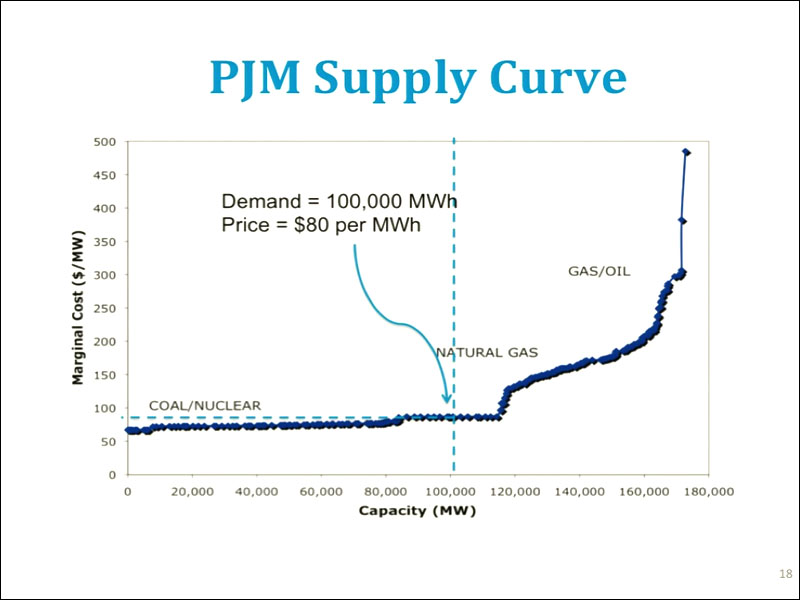
This is approximately what the supply curve looks like for the PJM market. A couple of things about this supply curve are that, first of all, it has this hockey stick sort of shape. Over a large range of electricity demand, the market price would not vary all that much - or the cost of generation would not vary all that much. In the example that I have here, if demand is a hundred thousand megawatt hours, which is this vertical line about here, then the point where that line crosses the supply curve is what sets the market price for that particular time period. And so in this particular time period, at a demand of a hundred thousand megawatt hours, the price would be eighty dollars per megawatt hour. And if the price were a little bit lower or a little bit higher than that, say eighty thousand instead of a hundred thousand, the market clearing price would not change all that much. But as demand increases, in this case past a hundred and or a hundred and twenty thousand megawatt hours, then the cost of the capacity you'd have to use in order to satisfy that demand starts to rise very sharply. So this point, the part of the supply curve over here where the price starts to rise very steeply is sometimes called the "devil's elbow."
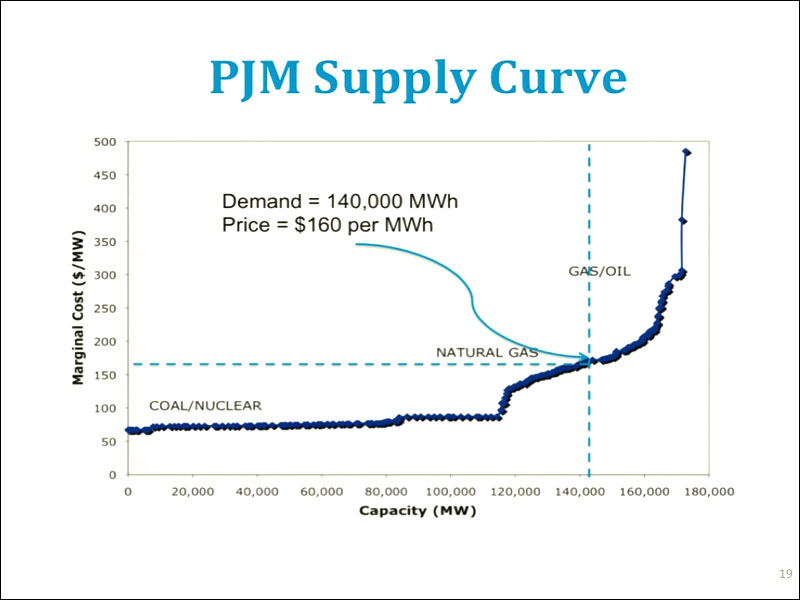
If we have demand of a hundred and forty thousand megawatt hours, then all of a sudden the price would jump to $160 per megawatt hour. So we have increased demand by 40% and we have doubled the price. At high levels of electricity demand, the small changes in demand can produce much larger than proportional changes in the market price.
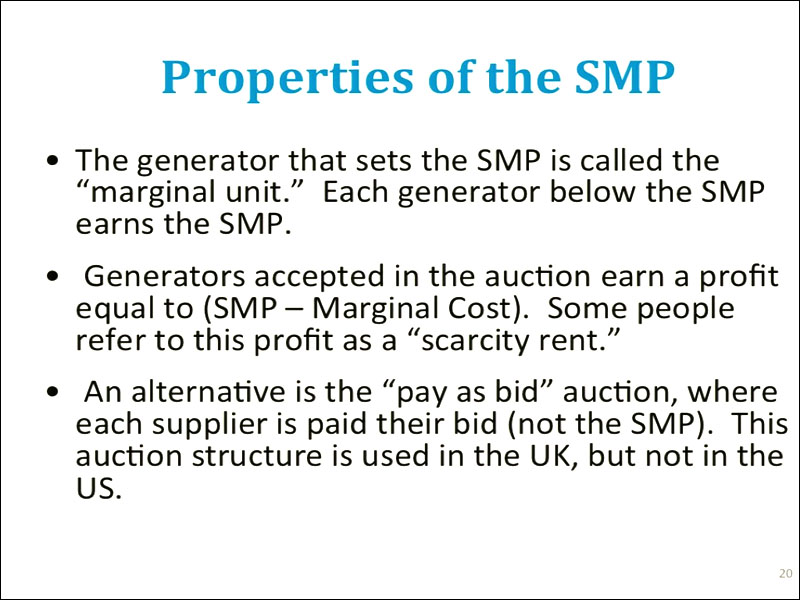
The last generator that is dispatched to meet electricity demand is the generator that basically sets the market price, or the system marginal price. And the way these uniform price auctions work is that that system marginal price, or that market price, is paid to every generator whose supply offer was lower than the market price. So if you're a generator, your profit during any time period is equal to whatever the market the price is minus your marginal cost. Sometimes you'll hear this market referred to as a scarcity rent. The way that these uniform price auctions work, if you've take Econ 101, is not dissimilar to just about any other market in the world.
There is a variation on the uniform price auction called the pays as bid auction. This is used in the UK but not in the United States. The idea behind the pay as bid auction is that there's still a system marginal price that is produced through the market, but rather than each generator earning the system marginal price, each generator who is accepted into the auction, each generator that bids below what the system marginal price turns out to be, is payed whatever their bid was. As I said, this is used in the UK but not in the US. The belief in the US is that if you switched to a pay as bid system, this would simply give generators incentives to manipulate their bids. So if you're a generator that has a marginal cost of five dollars per megawatt hour and you believe that the market price, or the system marginal price, will be fifty dollars per megawatt hour, in the uniform clearing price option, you would earn fifty minus five equals forty-five dollars per megawatt hour in profit. In the pay as bid auction, if you actually submitted a bid that was equal to your marginal cost, then you would earn five dollars per megawatt hour. The thought is, in the US, is that this would give this particular supplier an incentive to inflate their bid up to whatever they thought the market clearing price would be. So the pay as bid is not really used in the US.
So, basically, all of the centralized wholesale markets run by RTOs follow this uniform price option format.