For these centralized electricity markets….I'd said that starting in the 1990s there were two competing models for setting up electricity markets: one in California and one in the PJM states. What California did was it tried most directly to replicate a financial exchange, like the New York Stock Exchange, for buying and selling electricity. And so it opened The California Power Exchange. So California's biggest utilities, they all agreed to go along with this, and they agreed to buy all of their power from the power exchange. So how the power exchange worked was this:
First, individual generators decided whether or not they wanted to enter their supplies into the power exchange. This is called decentralized unit commitment. It was up to the generators whether or not they wanted to make their capacity available to the exchange. The bids from the generators, there was an overall cap, so a maximum amount, that the generators could bid, but beyond that, the generators could more or less do whatever they wanted. They could submit whatever type of supply offer they wanted to. And then, just as generators had to submit supply offers, the three large California utilities, they also had to submit demand bids. So the idea was that you would have so many suppliers rushing into this market to serve so much electricity demand that there would be sort of this vigorous competition that would ensue, sort of like in an auction.
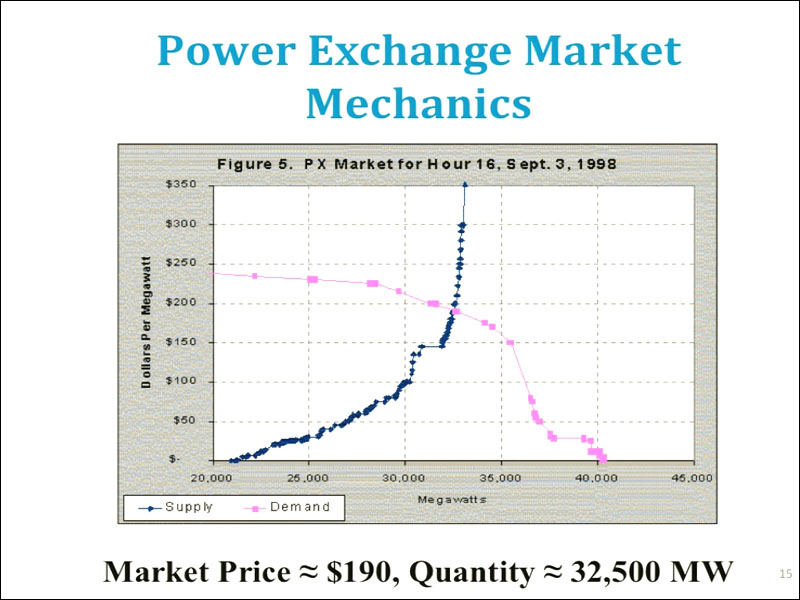
So the way that the power exchange market worked was that every hour, suppliers would submit supply offers, which is the blue curve here, and the supply offer indicated how much generating capacity the supplier was willing to make available to the power exchange at what price. So when you put all of these together you got what we call a supply curve or an offer curve. And that's in the blue. On the demand side, the utilities had to submit the amount of electricity that they were willing to buy from the exchange at some price. And so that's the pink curve right over here. And when these purchase offers were aggregated together you got kind of a California system demand curve. And where the supply and demand curve met determined the price and quantity at which the electricity market would clear. So in this example, and this is a picture from the late 1990s, the point where supply equals demand, the market cleared for this particular hour at about 32,500 megawatts of generation capacity would be utilized to serve 32,500 megawatt hours of energy demand, and the market clearing price would be $190 per megawatt hour. So this was repeated every single hour of every single day. And in the event that there wasn't enough electricity purchased in through the power exchange to serve all of California's electricity demand, there was a secondary balancing market that would ultimately equate demand and supply on a sub-hourly basis. So, this was basically how the power exchange model worked, and the California power exchange lasted for about two and a half years, and after the California power crisis, as California's sort of screeching halt to electricity deregulation, the power exchange was shut down. Partially because of California's sort of dismal failure, the power exchange model has not really been replicated anywhere else except in Alberta, up in Canada, where they actually have had a power exchange type market for well over a decade. They seem to like it, but in California, it didn't work so well.