Lessons
This is the course outline.
Lesson 1: Principles of Sustainable Systems
1.0 Lesson 1 Overview
Overview
This first lesson of the course reviews some important definitions related to sustainability and sustainable development. We start with very general concepts and then narrow it down to specific principles and how they apply to technologies. Understanding the role of technology in sustainable society is central to this course. As we go from one topic to another, we will always return to the practical question: Is this particular method, product, or design good for our future or should we better look for alternatives? This lesson sets the context. We get introduced to the principles of sustainable design and sustainable engineering and see how they can direct our thinking, innovation, and eventually lifestyle. This lesson also includes introduction to the systems analysis, which becomes an effective tool in understanding interactions between environmental, economic, and social factors in sustainable development.
Learning Objectives
By the end of this lesson, you should be able to:
- understand definitions and principles of sustainable development;
- understand how these principles apply to design and engineering;
- recall the basics of the systems analysis and apply this approach to a simple system as an example;
- identify the role of technology in sustainability framework.
Readings
You will be asked to read the following items throughout your lesson. Look for these readings in the required reading boxes throughout the lesson pages.
Book chapter (E-Reserves): C.U. Becker, Sustainability Ethics and Sustainability Research, Ch. 2. Meaning of Sustainability, Springer 2012, pages 9-15.
UN Document: Report of the World Commission on Environment and Development: Our Common Future [1], Chapter 2, Geneva, Switzerland, March 20, 1987.
Web article: Daly, H., From a Failed Growth Economy to a Steady-State Economy [2], in The Encyclopedia of Earth, 2009.
Web article: Ellis, E., Overpopulation is not the Problem [3], New York Times, Sept.13, 2013.
Note:
The directly linked materials are available on the web. The items that do not contain a direct link can be accessed electronically, via Canvas's "Library Resources" button.
Questions?
If you have any questions while working through this Lesson, please post them to our Message Board forum in Canvas. You can use that space any time to chat about course topics or to ask questions. While you are there, please feel free to post your own responses if you are able to help out a classmate.
1.1 Sustainability Definitions
Sustainability as a Term
The term sustainability has a multidisciplinary use and meaning. In dictionaries, sustainability is typically described by many sources as a capability of a system to endure and maintain itself. Various disciplines may apply this term differently.
In history of humankind, the concept of sustainability was connected to human-dominated ecological systems from the earliest civilizations to the present. A particular society might experience a local growth and developmental success, which may be followed by crises that were either resolved, resulting in sustainability, or not resolved, leading to decline.
In ecology, the word sustainability characterizes the ability of biological systems to remain healthy, diverse, and productive over time. Long-lived and healthy wetlands and forests are examples of sustainable biological systems.
Since the 1980s, sustainability as a term has been used more in the sense of human sustainability on planet Earth and this leads us to the concept of sustainable development which is defined by the Brundtland Commission of the United Nations (March 20, 1987) as follows: "Sustainable development is development that meets the needs of the present without compromising the ability of future generations to meet their own needs." The following video will further elaborate on this definition and will give a few examples on its meaning.
Video: What is Sustainability (9:43)
So what is Sustainability? You’ve probably heard the term sustainability in some context or another. Maybe you’ve used some product or service that was labeled as sustainable, or maybe you're aware of some campus or civic organization that focuses on sustainability. You may recognize that sustainability has to do with preserving or maintaining resources. We often associate sustainability with things like recycling, using renewable energy sources like solar and wind power, and preserving natural spaces like rainforests and coral reefs. However, unless you have an inherent interest in sustainability, you probably haven’t thought much about what the term actually means. This video provides a basic definition of sustainability. Simply put, sustainability is the capacity to endure or continue. If a product or activity is sustainable, it can be reused, recycled, or repeated in some way because it has not exhausted all of the resources or energy required to create it. Sustainability can be broadly defined as the ability of something to maintain itself. Biological systems such as wetlands or forests are good examples of sustainability, since they remain diverse and productive over long periods of time. Seen in this way, sustainability has to do with preserving resources and energy over the long term rather than exhausting them quickly to meet short-term needs or goals. The term sustainability first appeared in forestry studies in Germany in the 1800s, when forest overseers began to manage timber harvesting for continued use as a resource. In 1804, German forestry researcher Georg Hartig described sustainability as “utilizing forests to the greatest possible extent, but still in a way that future generations will have as much benefit as the living generation." So while our current definitions are quite different and much expanded from Hartig’s, sustainability still accounts for the need to preserve natural spaces, to use resources wisely, and to maintain them in an equitable manner for all human beings, both now and in the future. Sustainability seeks new ways of addressing the relationship between societal growth and environmental degradation, which would allow human societies and economies to grow without destroying or over-exploiting the environment or the ecosystems in which those societies exist. The most widely quoted definition of sustainability comes from the Brundtland Commission of the United Nations in 1987, which defined sustainability as meeting “the needs of the present without compromising the ability of future generations to meet their own needs.” As a quick example of sustainability, think about aluminum soda cans. In the past, many soda cans were used and thrown away without a whole lot of thought.The practice of throwing them away was unsustainable, since ready sources of aluminum are limited and landfills and trash dumps were filling quickly with wasted cans. Consequently, governments and private corporations began to recycle aluminum soda cans, and today more than 100,000 soda cans are recycled each minute in the United States. A billion dollar recycling industry has emerged, creating jobs and profits for the workers and businesses employed in that enterprise, while at the same time using limited resources more thoughtfully and reducing the impact on the environment. The process has become cyclical rather than linear, resulting in the continued use of materials. But sustainability is about more than just the economic benefits of recycling materials and resources. While the economic factors are important, sustainability also accounts for the social and environmental consequences of human activity. This concept is referred to as the “three pillars of sustainability,” which asserts that true sustainability depends upon three interlocking factors: environmental preservation, social equity, and economic viability. First, sustainable human activities must protect the earth’s environment. Second, people and communities must be treated fairly and equally—particularly in regard to eradicating global poverty and the environmental exploitation of poor countries and communities. And third, sustainability must be economically feasible—human development depends upon the long-term production, use, and management of resources as part of a global economy. Only when all three of these pillars are incorporated can an activity or enterprise be described as sustainable. Some describe this three-part model as: Planet, People and Profit. Our current definitions of sustainability—particularly in the United States—are deeply influenced by our historical and cultural relationship with nature. Many American thinkers, writers, and philosophers have focused on the value of natural spaces, and those ideas contributed to the environmentalist movement that emerged in the second half of the 20th century. Grassroots environmental organizations like Greenpeace and the Sierra Club advocate for the protection and restoration of nature, and they lobby for changes in public policy and individual behavior to preserve the natural world. Seen in this way, Environmentalism and sustainability have a lot in common. In fact, some people think that our current conversations about sustainability are the next development or evolution of environmentalism. However, earlier environmental debates often pitted the environment against the economy—nature vs. jobs—and this dichotomy created a rift between those supporting one side of the debate against the other. Many of the current discussions involving sustainability hope to bridge the gap by looking for possibilities that balance a full range of perspectives and interests. Sustainability encourages and provides incentives for change rather than mandating change, and the three pillars of sustainability emphasize this incorporation. Essentially though, sustainability looks for coordinated innovation to create a future that merges environmental, economic, and social interests rather than setting them in opposition. In some ways, sustainability is the most important conversation taking place in our society today. The earth is our home, and it provides all of the things we need for our survival and nourishment. However, that home has limited resources, and our collective future will depend upon the successful management and use of those resources. We are living in a critical time, where global supply of natural resources and ecosystem services is declining dramatically, while demand for these resources is escalating. From pollution, to resource depletion, to loss of biodiversity, to climate change, a growing human footprint is evident. This is not sustainable. We need to act differently if the world and its human and non-human inhabitants are to thrive in the future. Sustainability is about how we can preserve the earth and ensure the continued survival and nourishment of future generations. You and everyone you know will be affected in some way by the choices our society makes in the future regarding the earth and its resources. In fact, your very life may well depend upon those choices.
With human decision-making involved, sustainability attains a significant ethical aspect and transforms social paradigm on success, growth, profit, standards of living. This reevaluation requires broader and more synergistic overview of many components of anthropological ecosystems, including technology.
The topic of sustainable development gained enough importance in the last few decades of the 20th century to become a central discussion point at the 1987 General Assembly of United Nations (UN). Concerned by the quick deterioration of the human environment, uneven development, poverty, population growth, extreme pressure on planet's land, water, forest, and other natural resources, UN issued an urgent call to the World Commission on Environment and Development to formulate a "global agenda for change" [UN, 1987]. The result of this action was the report "Our Common Future", which further served as the global guideline for world's nations in formulating their political and economic agenda. This document is almost 40 years old now and was followed up by a long array of actions and movements in subsequent years. But let us go back for a little bit and see how it all started.
The original 1987 Report prepared by the World Commission on Environment and Development is a big document (over 300 pages), so I do not advise you to read it all right away. The following reading (about 16 pages) is Chapter 2 of the report, which talks specifically about the concept of sustainable development. So, some of the terms, definitions, and perspectives outlined there will be especially useful for our further work and discussions in this course. So, here is your first reading assignment:
Reading Assignment:
UN Document: Report of the World Commission on Environment and Development: Our Common Future, Chapter 2: Towards Sustainable Development. [1] Geneva, Switzerland, 3/20/1987.
This document summarizes a consensus on sustainable development and outlines the strategies that should enable reaching sustainability goals. Adopted in 1987, it formed the background for many future attempts to formulate the sustainability principles in very diverse areas: science, industry, economics. Reading through this chapter will provide you with the important background on how the sustainability movement began and what issues were the drivers of sustainable thinking four decades ago.
While reading, take a note of the concept of growth, how it is interpreted, and what positive and negative implications are associated with it. This context will be helpful further in this lesson as we go on to analyze and discuss the question of growth on the forum.
Three Pillars of Sustainability
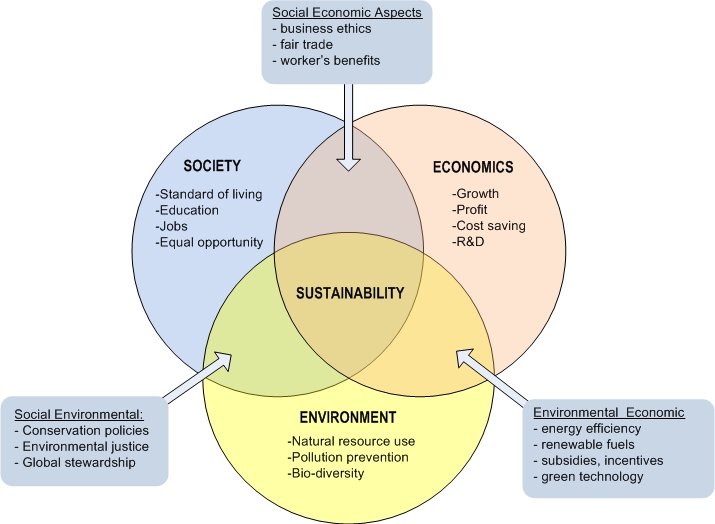
Sustainable development involves environmental, economic, and social aspects. For a particular process to be sustainable, it should not cause irreversible change to the environment, should be economically viable, and should benefit society. An illustration of the interplay among these three spheres is schematically provided in Figure 1.1. Sustainability is represented as the synergy between society, economics, and environment. The environmental aspects include use of natural resources, pollution prevention, biodiversity, and ecological health. The social aspects include standards of living, availability of education and jobs, and equal opportunities for all members of society. The economic factors are drivers for growth, profit, reducing costs, and investments into research and development, etc. There are more factors that will affect sustainability of a social system - these few are listed as examples.
Interaction of social and economic spheres result in formulation of combined socio-economic aspects. Those are, for instance, business ethics, fair trade, and worker's benefits. At the same time, combination of economic and environmental interests facilitate increasing energy efficiency, development of renewable fuels, green technologies, and also creation of special incentives and subsidies for environmentally sound businesses. Intersection of social and environmental spheres lead to creation of conservation and environmental protection policies, establishment of environmental justice, and global stewardship for sustainable use of natural resources. This framework is in some way a simplification, but it proved to be helpful in identifying key areas of impact and set the basis for objective analysis. Further in this course particular processes and technologies will be often evaluated in terms of social, economic, and environmental impacts, although we should understand that those three pillars are never fully isolated from one another.
Dimensions of Sustainability
The above-mentioned three pillars of sustainability are very common terms in the literature, media, and communications and convey a simple idea to grasp. However, the interconnections between these three pillars are not at all simple and can actually occur in different planes of thinking. Three fundamental meanings or dimensions of sustainability were defined by Christian Becker in his book "Sustainability Ethics and Sustainability Research" as continuance, orientation, and relationships. To understand what those dimensions exactly mean, please refer to the following reading. As discussed in this chapter, the multi-dimensional nature of sustainability is something that often results in confusion and miscommunication between different entities and spheres involved. For example, an environmentalist, economist, and politician can discuss sustainability as a project goal, but actually having three different goals in mind. So, new project developers in the sustainability era should certainly seek to broaden their perspective and at the same time develop sufficient depth in articulation of their sustainability vision. Enjoy the reading:
Reading Assignment:
Book chapter: C.U. Becker, Sustainability Ethics and Sustainability Research, Chapter 2: Meaning of Sustainability, Springer 2012, pages 9-15. (Available through E-Reserves in Canvas.)
When reading, pay special attention to the various dimensions of sustainability and why they need to be recognized. Think – how would you define the term "sustainability" in your own words?
Check Your Understanding - Reflection Point
Now, as you have read C. Becker's text, think which of the three meanings of sustainability mentioned is the closest to your mindset. When you hear people talking about sustainable economy, or sustainable society, what comes to your mind first? Also reflect what dimension of sustainability has been lacking from your vision. Do you agree with the author of the chapter that all three dimensions must be equally included in discussion?
Write a few sentences summarizing your thoughts and keep them in your notes. You may need to go back and use your reflection later in the introduction or discussion in your course project.
Note: this is ungraded assignment - you are making this reflection solely for your own reference.
If you completed the short reflection note in the box above - good job! You will find it very beneficial to write down some of your own thoughts while you are still fresh off your reading.
United Nations’ 17 Sustainable Development Goals (SDG)
In September 2015, the UN General Assembly adopted the 2030 Agenda for Sustainable Development [5], which converged in setting 17 sustainable development goals. These goals link the conceptual understanding of sustainability to specific focus areas, where actions are needed.
These goals became the common framework for governments and organizations developing sustainability plans, assessing new initiatives and emerging technologies, and tracking progress. So, it would be wrong not to include them here:
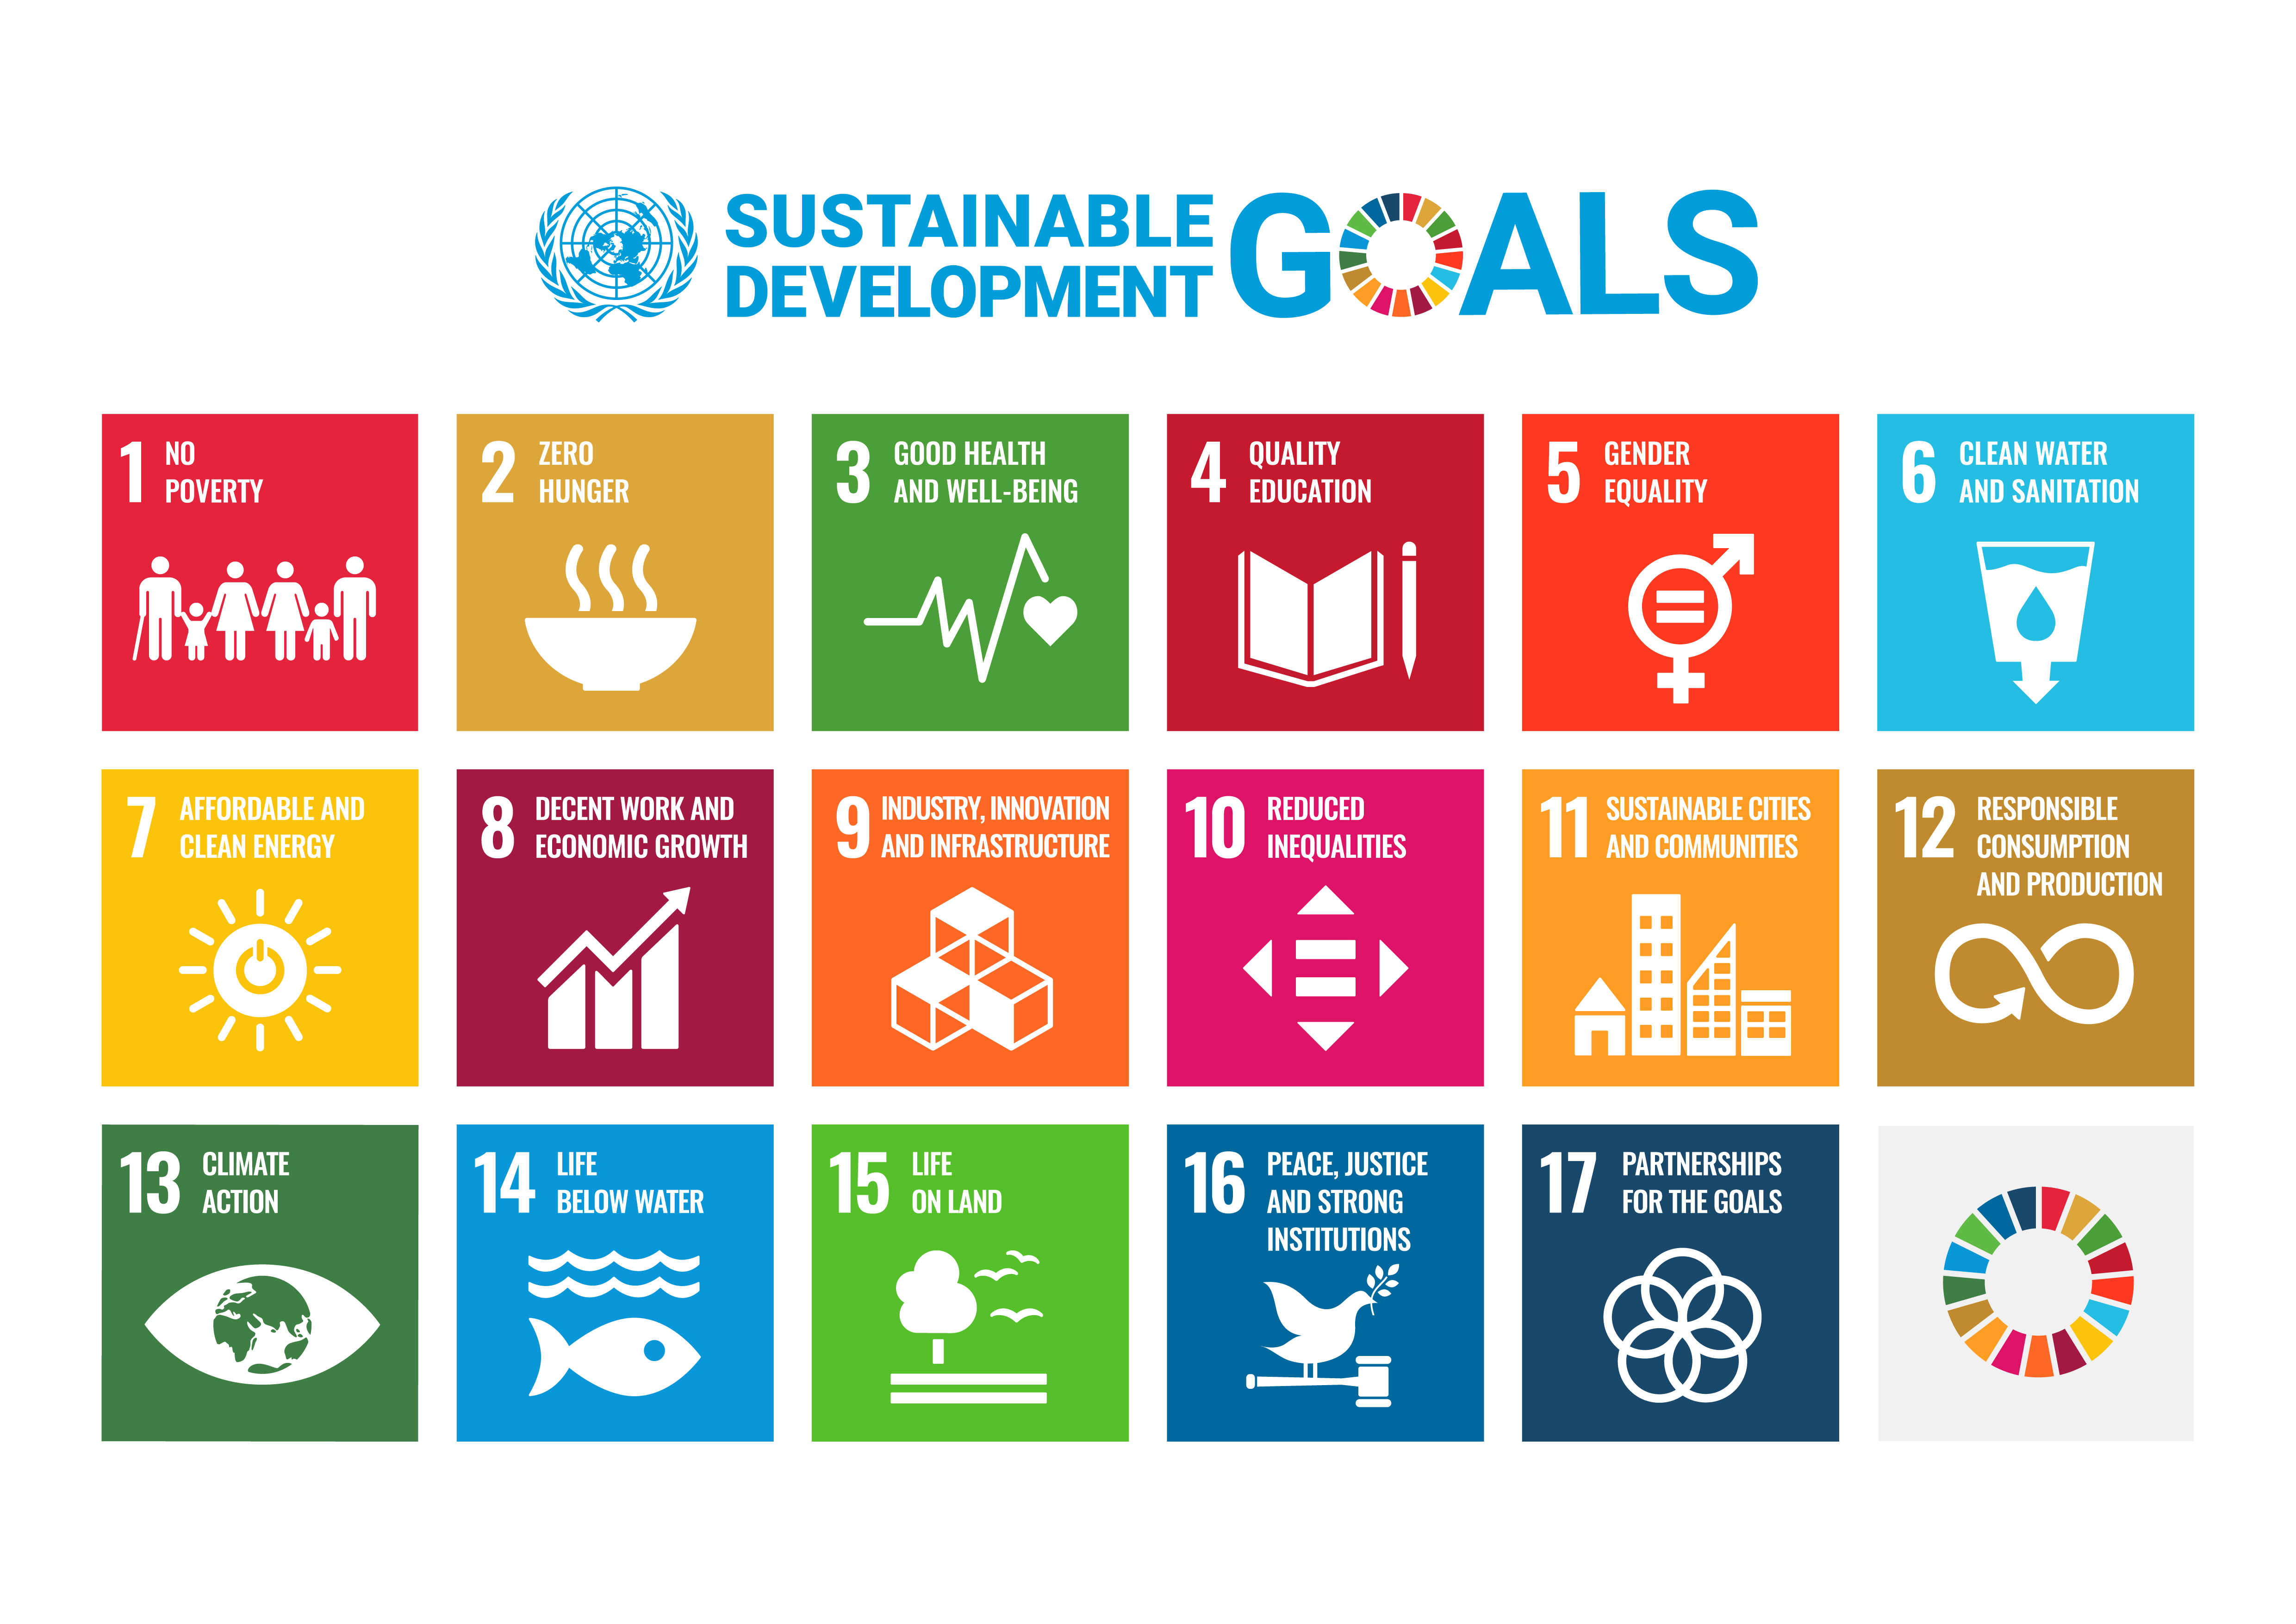
I do have to note that most of these goals still sound very general and would require specific measures (or metrics) to assess their achievement.
Further in this course, we will occasionally revisit the definitions and interpretations of sustainability. This is one of the concepts that sets context for our main focus in this course - technology role and assessment. In the next section of this lesson, we will start seeing how technology is sometimes considered the cornerstone of the society development and survival. While some theories heavily bet on technology as the universal solution to society's ever-growing needs, others are much more skeptical. So, prepare for some controversy.
Supplemental reading on sustainable development
UN Document: Report of the World Summit on Sustainable Development [7], Johannesburg, South Africa, 26 August – 4 September 2002.
This document provides a more detailed outline of the goals of the global community for sustainable development. You are not required to read the entire document, but it may be interesting to scan through it and see how it follows up on the initial guidelines adopted in 1987.
1.2 Growth / No Growth Dilemma
1.2 Growth / No Growth Dilemma

Steady State Economy
Herman E. Daly (1938-), a renowned expert in ecological economics, who has been a longtime proponent of the concept of sustainable steady state economy (as opposed to economic growth), formulated several basic rules for sustainable society, known as Daly Rules:
- Renewable resources - e.g., groundwater, biomass - must be used no faster than the rate at which they regenerate.
- Nonrenewable resources - e.g., minerals, fossil fuels - must be used no faster than renewable substitutes for them can be put into place.
- Pollution and wastes must be emitted no faster than natural systems can absorb them, recycle them, or render them harmless.
Sustainable steady state theory states that human societies can grow to a special state, where resource supply and consumption are balanced. This should be considered a sustainable steady state. After this balance point has been reached, only refinement of societies (via better use of available resources through more efficient technologies) instead of growth (increase in supply and consumption of resources) should be pursued.
According to Daly’s theory, economic growth cannot be forever maintained because the planet and its resources have finite physical dimensions and capacity:
“If resources could be created out of nothing, and wastes could be annihilated into nothing, then we could have an ever-growing resource throughput by which to fuel the continuous growth of the economy. But the first law of thermodynamics says NO. Or if we could just recycle the same matter and energy through the economy faster and faster we could keep growth going. The circular flow diagram of all economics principles texts unfortunately comes very close to affirming this. But the second law of thermodynamics says NO.” [Daly, 2009]
But is reaching a sustainable steady state in fact realistic and practically achievable? Daly argues that there is a practical alternative to economic growth paradigm. That would rely on a number of critical economic steps and policies. Daly's measures may seem controversial and somewhat radical at a national or international scale, but they touch an important scaling question: how large can a system be and keep its potential for sustainability?
Reading Assignment
Please click on the following link to review Daly's proposals: "From a Failed Growth Economy to a Steady-State Economy [2]".
Note: This this the first article that will be related to the topic of our first forum discussion.
If you are interested in learning more about Dr. Daly's views on economic growth and steady state economy, check out his interview below.
Video: "Herman Daly on the Economy and the Environment" (51:06)
Oscillating Steady State
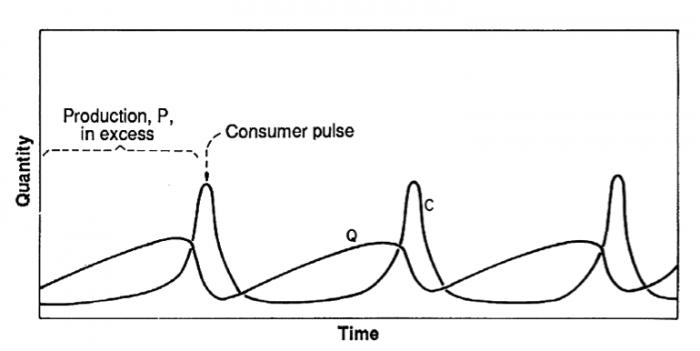
Contrary to the steady-state paradigm, an alternative view expressed in works by Howard T. Odum and collaborators (for example “Environmental Accounting: Emergy and Decision Making” 1995) considers the whole planet a self-organizing system, where storages of resources are continuously depleted and replaced at different rates, and matter recycling and reorganization is driven by solar, geothermal, and gravitational energies. It is hypothesized that one of the possible reasons for oscillating systems to be preferable over steady state systems is that they are governed by the system feedback to changing environmental conditions or depletion of one or other storage. The system should be able to tune its performance according to the changing environment.
As the diagram in Figure 1.2. illustrates, net primary production and storage of resources (expressed as Quantity Q) develop faster than consumer assets (expressed as Quantity C) until the system reaches a threshold where autocatalytic and higher order pathways are accelerated. At the threshold, consumer assets show a sudden increase at the expense of the environmental storage (consumer pulse). As the resources are used up quickly, consumer assets drop, allowing a new cycle of building resource storage to begin. In the case of global economy, the storages can be represented, for example, by oil, minerals, topsoil, and other slowly renewable resources, while the consumer assets are human economies and civilization. The theory presumes that this kind of pulsation can be sustained over time.
Anthropogenic Ecology Theory
Some contemporary scientists find Daly's arguments overly pessimistic. For example, Erle Ellis, an associate professor of geography and environmental systems at the University of Maryland, Baltimore County, and a visiting associate professor at Harvard’s Graduate School of Design, argues that over the course of the anthropogenic history, humans have almost never relied simply on the carrying capacity of natural ecosystems, but rather created specially engineered ecosystems. Such artificial eco-niches utilize intelligent approaches and technologies for extracting more usable resource from the nature. So, essentially, Ellis infers, there is no problem of limiting carrying capacity due to creative transformative powers of humankind.
Within the anthropogenic ecology theory, the emergence of new sociocultural niches in human society is represented as a novel evolutionary process in the Earth system. These niches are the result of re-shaping the biosphere into new organizational level which allows virtually unlimited upscaling of societies through culturally mediated changes.
Please click on the following link to read more about Erle Ellis views in the New York Times article: "Overpopulation is not the Problem [3]"
Note: This is the second article that will be related to the topic of our first forum discussion.
To better understand and to analyze the dynamics of feedback and oscillations within socio-ecological systems, it would be useful for us to look at the basics of the systems thinking approach. This thinking framework is especially important to sustainability science, because it allows tracking logical interconnections between natural factors, economic factors, social motifs. More details are given further in Sections 1.5-1.8 of this lesson.
1.3 Principles of Sustainable Design
1.3 Principles of Sustainable Design
The next question for us to explore is how the meanings of sustainability extend into technical spheres, specifically engineering, design, and technology development.
The term design is normally referred to the "way of doing things or making things" in various areas of human activity. Design is always driven by a specific objective, such as making the product or system most efficient, or most profitable, or most aesthetically impressive, etc. Such objectives can be drastically polar and to reach them, designing phase may require change of thinking and high level of creativity. So, what is sustainable design?
This concept was largely advocated by William McDonough, an American designer, architect, author, and thought leader, who espouses a message that we can design materials, systems, companies, products, buildings, and communities that can continuously improve over time.
"If design is the first signal of human intention, our intention today can be to love all ten billion people who will live on our planet by 2050. We can do this. If we imagine and embrace our cities as part of the same organism as the countryside, the rivers and the oceans, then we can celebrate ourselves, all species and the natural systems we support and that support us. This is our design assignment. If we are principled and have positive goals, we can rise to this occasion. It will take us all; it will take forever—that is the point." (McDonough, 1992)
The concept of sustainable design is supplied with some lively illustrations in McDonough's TED Talk
Watch this video: William McDonough's TED Talk (19:46)
McDonough crafted sustainable design principles for Expo 2000, The World’s Fair, which became known as "The Hannover Principles: Design for Sustainability." This document has wide philosophical and ethical dimensions and should be seen as a living document committed to the transformation and growth in the understanding of our interdependence with nature and future generations.
THE HANNOVER PRINCIPLES [McDonough, 1992]
- "Insist on rights of humanity and nature to coexist in a healthy, supportive, diverse and sustainable condition.
- Recognize interdependence. The elements of human design interact with and depend upon the natural world, with broad and diverse implications at every scale. Expand design considerations to recognizing even distant effects.
- Respect relationships between spirit and matter. Consider all aspects of human settlement including community, dwelling, industry and trade in terms of existing and evolving connections between spiritual and material consciousness.
- Accept responsibility for the consequences of design decisions upon human well-being, the viability of natural systems and their right to coexist.
- Create safe objects of long-term value. Do not burden future generations with requirements for maintenance or vigilant administration of potential danger due to the careless creation of products, processes, or standards.
- Eliminate the concept of waste. Evaluate and optimize the full lifecycle of products and processes, to approach the state of natural systems, in which there is no waste.
- Rely on natural energy flows. Human designs should, like the living world, derive their creative forces from perpetual solar income. Incorporate this energy efficiently and safely for responsible use.
- Understand the limitations of design. No human creation lasts forever and design does not solve all problems. Those who create and plan should practice humility in the face of nature. Treat nature as a model and mentor, not as an inconvenience to be evaded or controlled.
- Seek constant improvement by the sharing of knowledge. Encourage direct and open communication between colleagues, patrons, manufacturers and users to link long term sustainable considerations with ethical responsibility, and reestablish the integral relationship between natural processes and human activity."
It is a philosophy that can be applied in the fields of architecture, landscape architecture, urban design, urban planning, engineering, graphic design, industrial design, interior design, fashion design, human-computer interaction, and many other areas depending on modern technologies.
In the consideration of the above principles, a strong emphasis is put on #6 [waste elimination], since it perhaps has the most profound impact on environment and human health as well as contains possible solutions for smart use and reuse of limited natural resources. A good waste prevention strategy would require that everything brought into a facility or process be recycled for reuse or recycled back into the environment through biodegradation. This would mean a greater reliance on natural materials or products that are compatible with the environment. Any resource-related development is going to have two basic sources of solid waste — materials purchased and used by the facility and those brought into the facility by visitors. The following are some waste prevention strategies that apply to both, although different approaches will be needed for implementation:
- Low-impact materials: Choose non-toxic, sustainably produced or recycled materials which require little energy to process.
- Energy efficiency: Use manufacturing processes and produce products which require less energy.
- Emotionally Durable Design: Reduce consumption and waste of resources by increasing the durability of relationships between people and products, through design.
- Design for reuse and recycling: "Products, processes, and systems should be designed for performance in a commercial 'afterlife'."
- Biomimicry: "redesigning industrial systems on biological lines ... enabling the constant reuse of materials in continuous closed cycles..."
- Service substitution: Shift the mode of consumption from personal ownership of products to provision of services which provide similar functions, e.g., from a private automobile to a carsharing service. Such a system promotes minimal resource use per unit of consumption (e.g., per trip driven).
- Renewability: Materials should come from nearby (local or bioregional), sustainably managed renewable sources that can be composted when their usefulness has been exhausted.
Here are some of the examples how design approaches attempt to promote the sustainability principles:
Emotionally Durable Design
 Credit: Liz Nehdi /
  Credit:
 The concept and philosophy of Emotionally Durable Design was pioneered by Jonathan Chapman, Professor of the University of Brighton (UK). According to this philosophy, increasing the resilience of relationships established between consumers and products reduces the consumption and waste of natural resources. Chapman states that "the process of consumption is, and has always been, motivated by complex emotional drivers, and is about far more than just the mindless purchasing (and discarding) of newer and shinier things". For example, these couple of images illustrate personalized design of products, when in addition to their normal function, the objects also help the owner to make a statement or express their style of life. To this end, 'emotional durability' can be achieved through consideration of the following five elements:
- Narrative: How users share a unique personal history with the product.
- Consciousness: How the product is perceived as autonomous and in possession of its own free will.
- Attachment: Can a user be made to feel a strong emotional connection to a product?
- Fiction: The product inspires interactions and connections beyond just the physical relationship.
- Surface: How the product ages and develops character through time and use.
As a strategic approach, "emotionally durable design provides a useful language to describe the contemporary relevance of designing responsible, well-made, tactile products which the user can get to know and assign value to in the long-term."
Biomimicry

Biomimicry is the imitation of the models, systems, and elements of nature in design, engineering, and science primarily for finding new solutions to scientific or technological challenges. The biomimicry has given rise to new technologies created from biologically inspired engineering at both the macro scale and nanoscale levels. In fact, humans have been looking at nature for answers to both complex and simple problems throughout world history. Nature has solved many of today's engineering problems such as hydrophobicity, wind resistance, self-assembly, and harnessing solar energy through the evolutionary mechanics of selective advantages. Here are several examples (out of many) showing using biological subjects as models in technology.
Because natural systems are a priori sustainable, designs observed in the nature can be viewed as prototypes of smart technologies for potential anthropogenic sustainability systems.
- A. The morpho butterfly (shown in [10]the image above from Wikipedia) gains its color due to special structural orientation of scale in its wings. Incident light is reflected at specific wavelengths to create vibrant colors due to multilayer interference, diffraction, thin film interference, and scattering properties. Now, some companies (Qualcomm) use this principle in manufacturing colored displays at much lower power consumption (as compared to production of dyes).
- B. Researchers studied the termite's ability to maintain virtually constant temperature and humidity in their termite mounds in Africa despite outside temperatures that vary from 1.5 °C to 40 °C (35 °F to 104 °F). Researchers initially scanned a termite mound and created 3-D images of the mound structure, which revealed construction that can influence human building design. The Eastgate Centre, a mid-rise office complex in Harare, Zimbabwe (image on the left), stays cool without air conditioning and uses only 10% of the energy of a conventional building its size (Source: Biomimicry [12]).
- C. Holistic planned grazing, using fencing and/or herders, seeks to restore grasslands by carefully planning movements of large herds of livestock to mimic the vast herds found in nature where grazing animals are kept concentrated by pack predators and must move on after eating, trampling, and manuring an area, returning only after it has fully recovered. Developed by Allan Savory, this method of biomimetic grazing holds tremendous potential in building soil, increasing biodiversity, reversing desertification, and mitigating global warming, similar to what occurred during the past 40 million years as the expansion of grass-grazer ecosystems built deep grassland soils, sequestering carbon and cooling the planet (Source: Biomimicry [12]).
- Paper wasps' nests are made out of cellulose (or chewed up wood) and wasp saliva. The wasp uses saliva that has a lot of protein in it and that protein mixed with the cellulose creates a water insoluble but also waterproof covering. It is interesting that in rainy environments, wasps are found to use more protein in their saliva in order to make the nest more waterproof. And because protein is quite expensive from a wasp’s standpoint because they have to go get more insects to get more protein, they are only going to use it if they really need it. So, if this is in a dry environment or protected from overhead, they are not using as much protein. This idea can be borrowed to make non-toxic, waterproof paper, or other biodegradable materials (Source: Biomimicry Case Examples [13])
 Credit:
 Supplemental reading on sustainable design:
Book: McDonough and Braungart, M., Cradle to Cradle. Remaking the Way We Make Things, North Point Press, NY 2002.
Engaging book on philosophy of sustainable design with numerous examples and stories. Authors explain how products can be designed in such a way that after their service life, they become not waste, but nourishment for something new..
Journal article: Chapman, J., Design for (Emotional) Durability [14], Design Issues, v.25, Issue 4, 29, 2009.
This paper elaborates on the concept of emotionally durable design and overviews avenues for change.
Web article: Cohen, S., Economic Growth and Environemntal Sustainability [15], Columbia Climate School, Jan 27, 2020,
This article discusses how sustaible design may help marry the economic growth with the environmental protection and lead to better quality of life in both developed and developing world.
1.4 Principles of Sustainable Engineering
1.4 Principles of Sustainable Engineering
"Engineering in context, engineering with a conscience, engineering for a finite planet and the indefinite future"
-Benoit Cushman-Roisin
Sustainable engineering should be based on principles that support sustainable development, as defined in the upper sections of this lesson. Engineering forms an interface between the design (i.e., the idea how to provide a sustainable solution to a technical problem) and implementation and production. In case of technology development, engineering phase is linked to almost every level of technology readiness spectrum. Sustainable engineering principles should be contemplated and applied early to ensure that technology development and scale-up follow the environmentally benign route. It will be hard to turn back to redo and redesign things from later stages! In that sense, the sustainable engineering principles should be taken into account in decision making for both research and industrial projects, as well as in policy making and decisions regarding funding of technological research.
There have been multiple attempts by academic and industrial institutions to formulate sustainable engineering principles. All of them fall within the triangle with Environmental, Social, and Economic values as cornerstones. The overarching goal is to generate a balanced solution to any engineering problem. If an engineering project benefits one of these three aspects but ignores the others, we have a lopsided system which creates tension, instability, and new problems in the long run.
Here are some of the aspects that differentiate the traditional and sustainable approaches in engineering:
| Traditional Engineering | Sustainable Engineering |
|---|---|
| Considers the object or process | Considers the whole system in which the object or process will be used |
| Focuses on technical issues | Considers both technical and non-technical issues synergistically |
| Solves the immediate problem | Strives to solve the problem for infinite future (forever?) |
| Considers the local context | Considers the global context |
| Assumes others will deal with political, ethical, and societal issues | Acknowledges the need to interact the experts in other disciplines related to the problem |
The diagram in Figure 1.3. presents a consolidated framework for sustainable engineering principles, which are in part adopted from the work of Gagnon and co-authors "Sustainable development in engineering: a review of principles and definition of a conceptual framework [16]" (2008) and from the green engineering principles established by Sundestin Conference (2003).
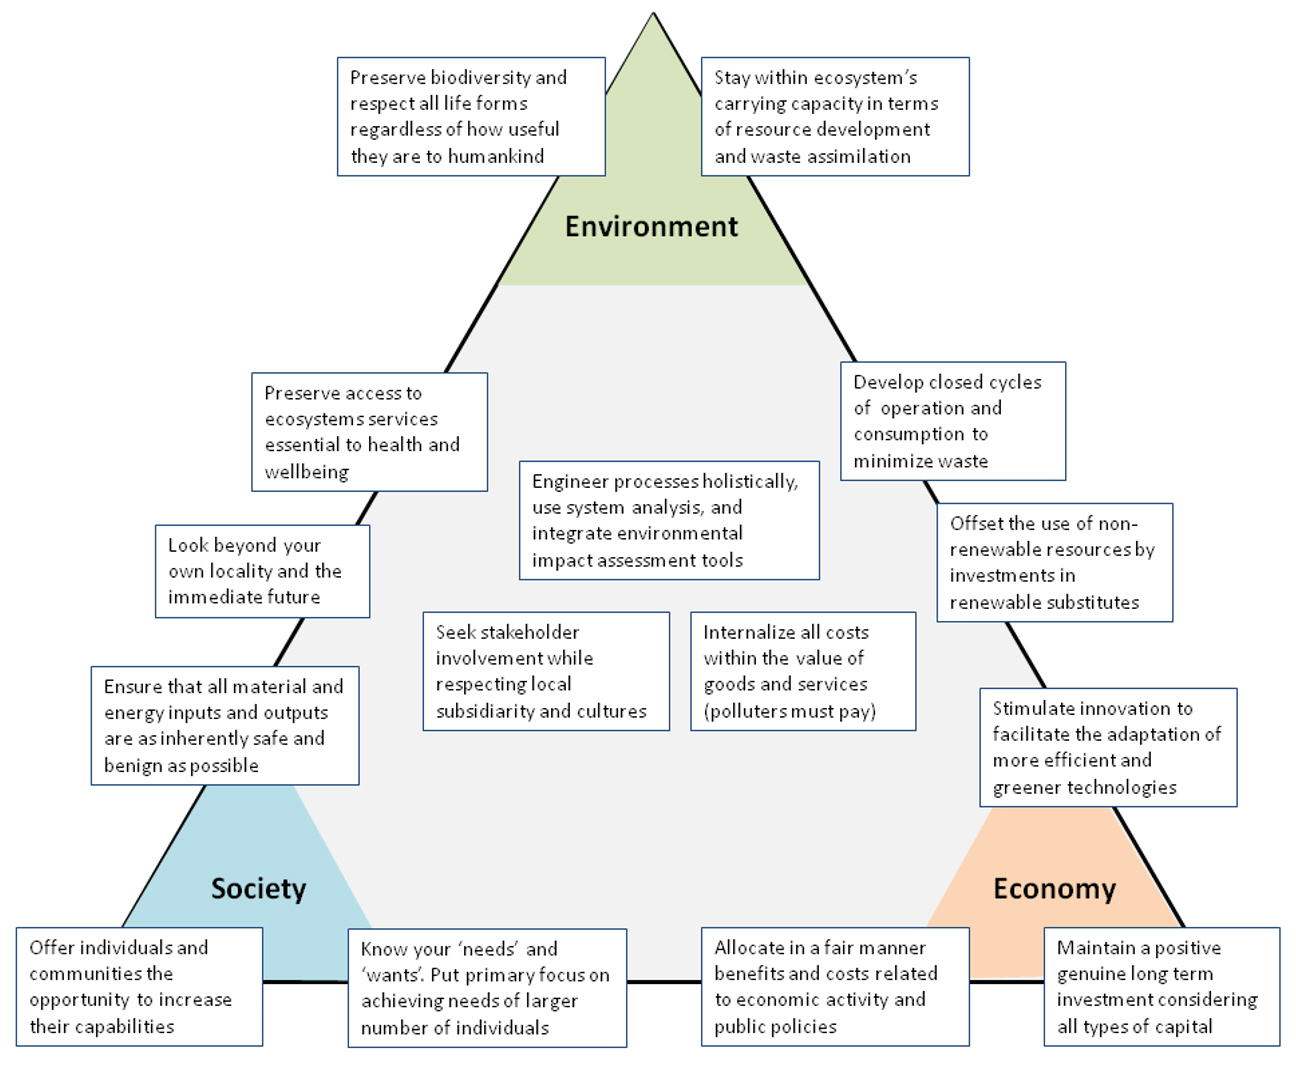
Figure 1.3 text description
Various principles of sustainable engineering are placed on the perimeter of the triangle. On the triangle's bottom edge are the Society pole (left) and the Economy pole (right). From left to right, the four principles shown are as follows:
- Offer individuals and communities the opportunity to increase their capabilities.
- Know your "needs" and "wants." Put primary focus on achieving needs of larger number of individuals.
- Allocate in a fair manner benefits and costs related to economic activity and public policies.
- Maintain a positive genuine long term investment considering all types of capital.
On the triangle's left edge are the Society pole (bottom) and the Environment pole (top). From bottom to top, the four principles shown are as follows:
- Ensure that all material and energy inputs and outputs are as inherently safe and benign as possible.
- Look beyond your own locality and the immediate future.
- Preserve access to exosystems services essential to health and wellbeing.
- Preserve biodiversity and respect all life forms, regardless of how useful they are to humankind.
On the triangle's right edge are the Environment pole (top) and the Economy pole (bottom). From top to bottom, the four principles shown are as follows:
- Stay within ecosystem's carrying capacity in terms of resource development and waste assimilation.
- Develop closed cycles of operation and consumption to minimize waste.
- Offset the use of non-renewable resources by investments in renewable substitutes.
- Stimulate innovation to facilitate the adaption of more efficient and greener technologies.
The principles shown at the center of the triangle are as follows:
- Engineering processes holistically, use system analysis, and integrate environmental impact assessment tools.
- Seek stakeholder involvement while respecting local subsidiarity and cultures.
- Internalize all costs within the value of goods and services (polluters must pay).
Figure 1.3 lists the various principles of sustainable engineering versus environmental, social, and economic poles. Some of these principles clearly gravitate towards one of the corners of this triangle and thus address particularly societal, environmental, or economic concern. But some others, which are placed along the sides of the triangle, have connections to two of the poles of the diagram and address both societal and economic, or both economic and environmental concerns in some proportion. Those principles placed in the center of the diagram combine all three aspects of sustainability to a certain degree and hence their implementation would benefit all societal, environmental, and economic stakeholders. We should not consider this collection of principles set in stone. Many sources and organizations build on the existing documents and provide their own visions. I invite you to reflect on this diagram and provide your comments for making it more complete and more concrete for our future consideration.
These principles can be viewed as guidelines for a specific engineering project. We are going to look at a specific example where the engineering solution was able to address the need and benefit sustainability, not sacrificing one for the other.
Jubilee River Case Study
Reading assignment
Venables, R., Civil Engineering - Jubilee River [17], in Engineering for Sustainable Development: Guiding Principles, Royal Academy of Engineering, Dodds, R., and Venables, R., Eds., 2005. pp. 11-14.
Note: I ask you to read the case study on pages 12-14 only! After that, please answer the self-check questions below.
This example presents a success story about how sustainable engineering has been applied to address a critical community need. The need is always placed in the center of an engineering project and directs design efforts. In this case, the need was a flood prevention system. While the traditional approach of creating the concrete trapezoidal channel [18] would address the need perfectly and cost-effectively, it would have environmental and social trade-offs. For example, construction would destroy or disturb natural vegetation and wildlife, cause high soil erosion, create a large amount of construction waste, and have a negative aesthetic impact.
The alternative approach was to convert these problematic trade-offs into benefits. That required some additional investment and a wider range of collaboration among civil engineers, ecologists, and landscape architects. The result was creation of a permanent, landscaped, ecologically compatible relief channel, with amenities and environmental features of a natural river (Figure 1.5), which eventually became an asset to the community and increased rather than decreased the quality of life.

To summarize the information in this reading, please provide answers to the following questions:
Self-check questions:
1. What was the key to making the Jubilee River channel stable under high flow conditions?
Click for answer.
Established vegetation (e.g. shrubs, trees) was necessary to fix the banks and to avoid excessive erosion.
2. What sustainable construction measures were implemented in the project?
Click for answer.
First, the routes for removal of excavation waste were established prior to the construction; second, the excavated gravel and soil were used for landscaping along the river banks.
3. What technology was used to plan and control excavation works and to prevent over-digging?
Click for answer.
Geographic positioning system (GPS) was used for careful planning and for optimizing the position and depth of excavation.
4. What were the key benefits of the Jubilee River project?
Click for answer.
(a) flood prevention (main need);
(b) better quality of life;
(c) maintained wildlife environment;
(d) protected land and soils;
(e) wise use of natural resources.
The goal of an engineering project can be to create a system, a device, a process, or any other outcome that would provide a certain service or benefit to society. One of the important outcomes of an engineering project is the creation of technology.
Role of Technology
Role of technology can be actually viewed as the interface that provides connection of an idea realized through design and engineering effort with practical and consumable outcomes, such as products or services. The latter would affect and shape societal lifestyle over time. Figure 1.4 presents a hierarchical view of these connections in the sustainability context.
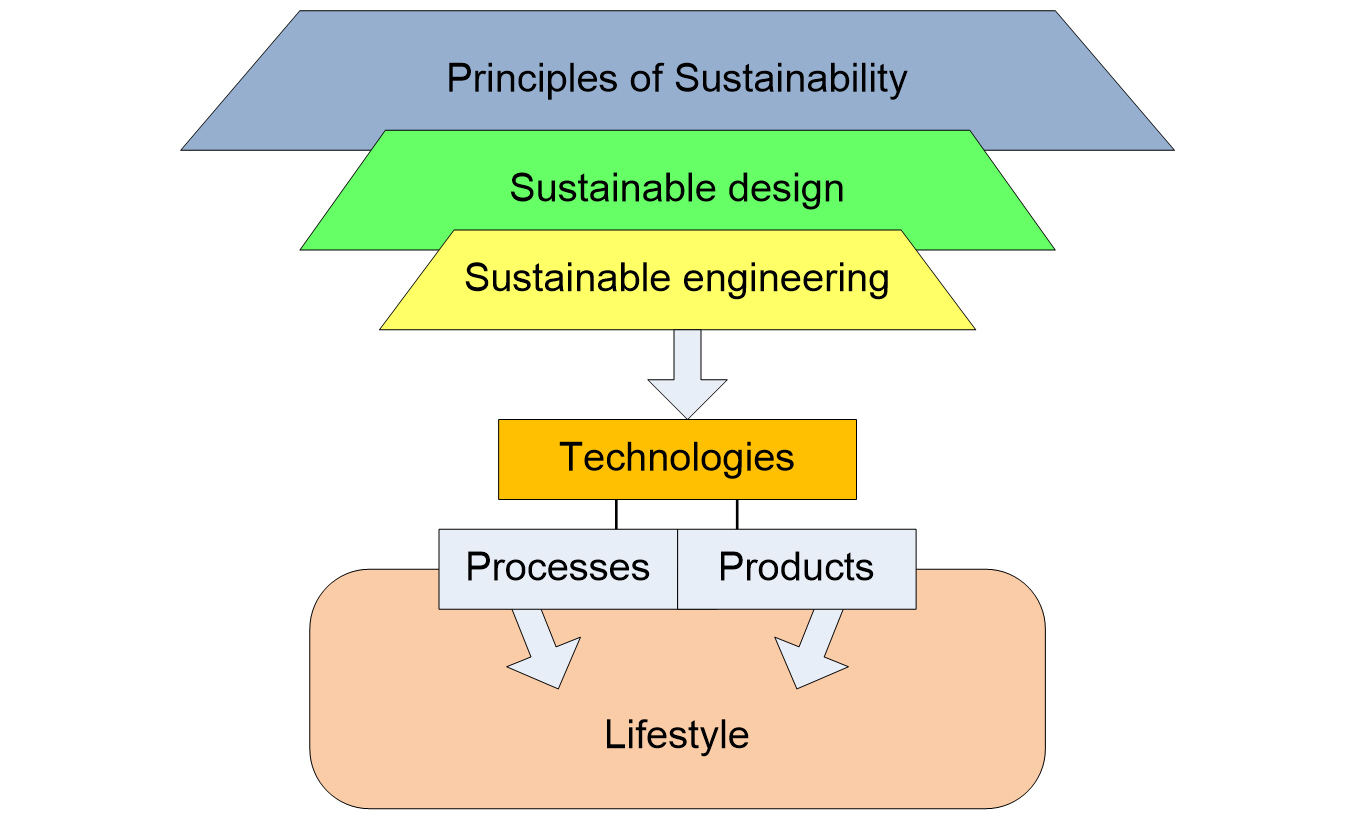
Figure 1.5 shows how the most general sustainability principles are narrowed down to specific material outcomes for the society. The principles of sustainability guide the sustainable design, the process of thinking. This stage determines how things are supposed to be made and how they will function over their whole lifecycle. Further down the funnel, the sustainable engineering stage deals with technical implementation of ideas. Sometimes it is not an easy process, and some aspects of design may be changed or compromised. When eventually the design and engineering routes practically converge, we may have a technology created. Technology provides processes and products. Only then the benefits of new ideas and new engineering developments become available to society. Here we can identify the role of technology as some sort of portal through which the established principles of sustainable design and engineering may affect people’s lifestyle. Because of people's strong dependence on multiple technologies, those become the factors that can facilitate change in society and can even become tools of manipulation and initiation of global trends.
Technology serves as a portal through which the established principles of sustainable design and engineering can reach the society and affect societal lifestyle.
This way of thinking emphasizes the importance of technologies in the whole hierarchy of causes and factors that regulate the sustainable development.
Supplemental Reading
Engineering for Sustainable Development: Guiding Principles, Royal Academy of Engineering, [17] Dodds, R., and Venables, R., Eds., 2005.
This additional reading on this section provides you with some examples of sustainable engineering projects. These demonstrate the wide application of sustainable engineering thinking in such spheres as water management, chemical industry, and electronics.
Gagnon, B., Leduc, R., and Savard, L., Sustainable development in engineering: a review of principles and definition of a conceptual framework [16]. Cahier de recherche / Working Paper 08-18, 2008.
1.5 Fundamentals of Systems Analysis
1.5. Fundamentals of Systems Analysis
To build the contextual framework for applying the sustainability principles, we need to develop some background in systems. We often hear terms like “systems thinking” or “systems approach”. Or in some cases, to initiate a sustainable and long-lasting change, we need to change the “system” rather than trying to change the final result. The material in this section is the tip of a bigger iceberg – system analysis is applicable to a very broad scope of problems, from economics to climatology, and it very often becomes a powerful tool in strategic decision-making. In this course, the systems approach will be essential when we consider technology trends and implementation in a broader societal context, where multiple forces – economic, environmental, political, educational, and psychological - come into play. It is not about simple ‘yes/no’ questions – it is our way to explore the complexity and possibly to find answers to ‘why’ questions for the most part. Let us start with some definitions.
Are we dealing with a system?
A system is an interconnected set of elements that is organized in a way that achieves a purpose. Three distinct entities of any system are elements, interconnections, and purpose (or function). These ensure system’s integrity and often determine such system’s properties and behaviors as development, resiliency, self-organization, self-repair, and eventually - sustainability. You can tell that you are dealing with a system, not a random collection of components, if you can identify the mutual impacts between the components and observe the outcome or behavior over time that is different from the outcomes or behavior of the separate components on their own.
For example, a forest is a system consisting of trees, soil, multiple species of flora and fauna – all of which are interconnected via food chains, nutrient flows, energy exchange, and many other chemical and physical processes. Its function is to provide environment and nutrition for sustaining living organisms and also to produce oxygen via photosynthesis. If one takes an element out of the system (e.g., taking a certain tree species and planting it in an isolated environment, or taking an animal and placing it in a zoo), those elements would behave differently, the same as the system deprived of a certain element will be affected and will react to the change.
In a social context, for example, a village is also a system, not a simple aggregation of houses and people. Houses may be connected through the utility networks, people are connected through trade, collaboration, and social relationships. Disruption of life and function on one side of the village would cause system’s reaction and change.
In the technical world, system functions can be even more obvious, since many engineering systems are designed by people for a specific purpose. Thus, a power plant system has a purpose to produce electric power and distribute it to a community or facility. It consists of equipment, workers, transportation means, fuel stocks, etc., all of which are interconnected in power production cycle.
How do you know that you are dealing with a system, not just a bunch of random things?
Answer these questions:
- Can you identify the connections (mutual influences) between parts?
- Do the parts working together produce a different result from that of each of the parts separately?
- Does the behavior persist over time or trend in a certain direction (not random)?
If the answer is 'yes' to one or more of these questions, chances are you are dealing with a system, and you can expect systemic response if you try to change it.
System elements
Next, we are going to cover three types of elements that will be used in system analysis further on. Specifically, those include: stocks, factors, and decision points.

Stocks
Stocks can be represented by sort of matter, commodity, or good. Stocks are cumulative and are characterized by measurable amount. They can accumulate (increase), deplete (decrease), or stay steady. In system diagrams, we are going to show each stocks as a box.
Examples of stocks:
- Money on the bank account
- Number of trees in the forest
- Number of people living in a town
- Amount of food stored for winter
- Amount of energy stored or generated at a power plant
Very often, the stability of a system depends on the maintenance of its stocks. If the bank account is stable or growing, we believe that whatever system maintains it is working well. If there is no decline in tree population, we assume the forest is healthy.
Factors
Factors can be represented by processes, flows, phenomena, actions, and even feelings that have influence within a system. Factors are measurable, but not necessarily cumulative, and are typically characterized by rates or intensity of process rather than countable amounts. Rates are important since they will affect the variations of stocks. In system diagrams, we are going to include factors in ovals.
Examples of factors:
- Rate of tree growth in the forest
- Air temperature at the forest location
- Electricity price at local market
- Solar irradiance at a specific location
- Number of cups of coffee you drink per day
Almost anything can be included as a factor in a system, as long as its variation influences the system state or other elements.
Decision Points
Decision points are very special elements that represent deliberate controls of the system by humans. Humans make a variety of decisions, which may or may not be dictated by the system behavior, and can be based on knowledge, personal choices, feelings, political views, conscience, etc.
Examples of decision points:
- Adopting a policy
- Decision to invest in growth of business (or not)
- Decision to restrict construction or practice
- Decision whether the stock level is dangerously low
In system diagrams, we are going to depict decision points as diamonds.
There may be other elements that are distinguished in various system models. But for the sake of simplicity, we are going to mainly operate with the three elements described above.
System Connections
In a system, elements are interconnected and may influence one another. If connections are not identified, the collection of elements you have, may not be a system after all. The following types of connections are most important.
Positive Coupling
Positive coupling is when an increase in A results in an increase in B.
- Increase in sunlight leads to higher solar panel output
- Increase in coal combustion results in growth of CO2 emissions
- More chickens, more eggs
This will also work backward: Fewer chickens, fewer eggs, etc.
This type of connection can be shown with a regular arrow:

Negative Coupling
Negative coupling is when an increase in A results in a decrease in B.
- Increase in mileage decreases car’s service life
- Amount of food consumed decreases the feel of hunger
- Increase in spending decreases amount of money in the bank account
And again, vice versa, in case of a negative coupling, a decrease in A would increase B. You can check if this opposite connectivity works with the above examples (it is not always the case).
This type of connection can be shown with a circular arrow:

It is important to understand that the connection drawn from A to B is not at all identical to the connection from B to A. We cannot simply put the arrow both ways automatically. For one of the example of positive coupling, we said: “increase in sunlight leads to higher solar panel output”. Obviously, the reversed relationship will not work: increase in solar panel output will NOT increase the amount of sunlight, and in fact it will not affect the amount of sunlight at all. So, before drawing the arrow from B to A, we need to think first if there is actually a reverse impact, and if yes, then whether it is a positive or negative coupling.
Feedback Loops
Feedbacks are very interesting properties of systems. Feedbacks are higher in the hierarchy of causal connections than couplings. While a coupling simply denotes the influence of one system element on another, feedbacks go further to show how those other elements impact the original cause. A feedback is always a loop, and therefore must contain at least two, but often more couplings in it. Here are some examples.
- More chickens, more eggs. But if we have eggs that can hatch and produce more chickens, we have a reverse connection: more eggs, more chickens. This is feedback.

- More stuff bought, less money left. That is a negative coupling. However, the less money is available, the less stuff we can further buy. This is a positive connection on the way back. And again, using these two couplings, we can identify a feedback loop between these two elements.

We can see from these two simple examples that feedback always “backfires” to the original element and affects any other element in the loop via circular impact.
Feedbacks are interesting internal mechanisms that can either stabilize or destabilize the system. In the next section of this lesson, we will consider two main feedback types – positive and negative – and see what effects they can cause.
Self-Check Questions
(There are three questions. Click on dots at the bottom to switch between questions. Click "check" at the bottom left of each question to check the answer)
1.6 Types of Feedbacks and Their Effects
1.6 Types of Feedbacks and Their Effects
Positive feedbacks
Imagine that you have some money in your bank account. The more money you have, the more interest you earn annually. That interest is added to your account balance, which earns you even more interest. So we can definitely see how A affects B, and B affects A in this case:

As the two positive couplings act in circles within this loop, your account balance keeps growing. Such a feedback loop is called positive or reinforcing (here is the “+” sign in the loop), because the system sort of feeds itself continuously, amplifying the impacts over time. In the beginning, the growth may seem slow, but year after year, it goes faster and faster (see typical growth in savings in Figure 1.12). The more money is there, the more is added. This kind of growth is called exponential in mathematical terms (and there is an equation to describe this curve as a function of time).
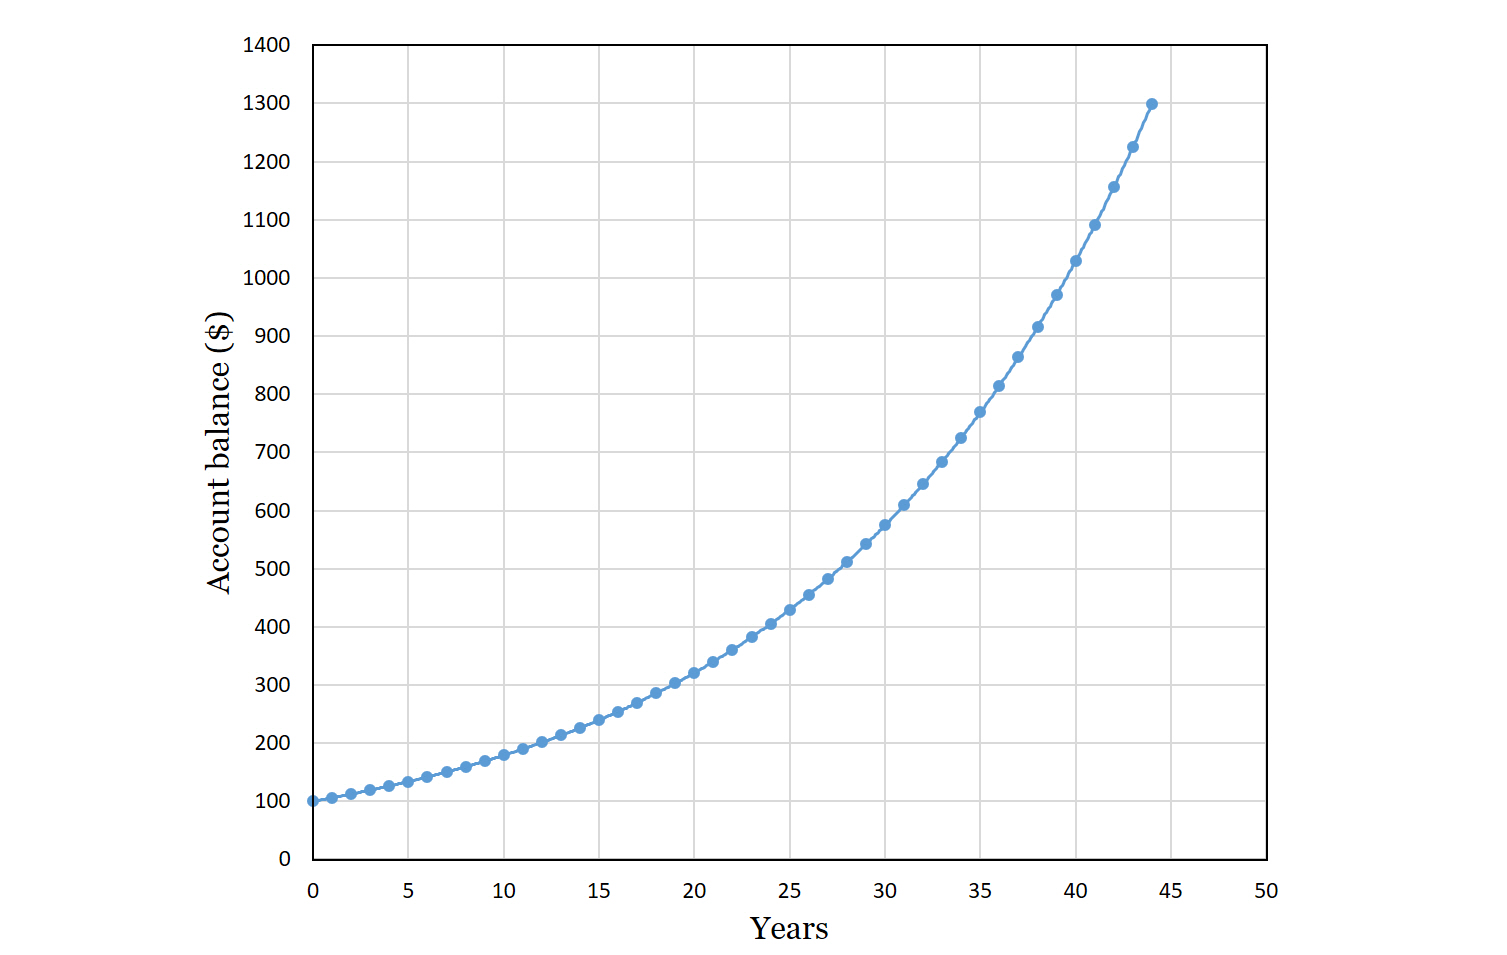
Evidently, exponential growth can be a good thing or a bad thing, depending on what stock is growing. Here are some other examples of growth stimulated by positive feedbacks:
- The more chickens there are in the barn, the more eggs they can lay. The more eggs there are to hatch, the more chicks will be produced that will grow the population of chickens.
- The more soil is eroded, the fewer trees are able to grow on it. The fewer trees are there to stabilize the soil, the more erosion will occur.
- The more individuals are infected with a virus, the more people they can potentially infect. The unrestricted dynamics of virus spread follow the infamous exponential curve.
- In war or conflict, the more damage one side causes to the other, the more hatred and resistance is generated from the other side back to the first. Stronger pushback causes even harsher aggression, thus escalating the conflict.
- The more a child plays a musical instrument, the more pleasure she gets from the sound, and the more willing she is to practice more.
Now think and add a couple of examples to the list. Can you draw a system diagram for any of these examples?
The positive feedback reinforces any change in whatever direction it goes. For that matter, it can be the reason for growth, and it can be the reason for decline and collapse. For example:
- Profits fall because investments fall, but investments fall because profits fall…
- The poorer people are, the harder for them to get an education. The less education they have, the harder for them to get out of poverty.
In the context of sustainability, positive feedbacks are classic de-stabilizers, often catering to short term gains. Although called “positive”, ironically, these feedbacks can be responsible for “runaway” and “snowballing” effects throwing the system out of balance and often leading to crisis, especially when system growth starts to push against system boundaries.
Negative feedbacks
Consider this example. The population of deer in the area leads to a higher rate of road collisions. The collisions kill a certain number of deer, thus reducing its population. Once the population of deer goes down, the road collisions become less frequent.

We can still clearly see here how the result of the first positive coupling affects the initial stock. Such a feedback loop is called negative or balancing feedback (here is the “—“ sign inside the loop), because it does not allow the deer population to grow out of control. Of course, it is a simplified example, and in reality, there may be other ways of regulating the deer population (e.g. hunting) and minimizing collisions (e.g. fences, driver alerts).
Negative feedbacks are mechanisms of stability. They work both ways, not allowing the stock to go too low or too high. These feedbacks are very common in the natural world, where many systems are homeostatic. Some more examples:
- Warmer weather induces more evaporation from rivers and lakes, thus creating clouds, which cool the air temperature. Once the temperature is cooler, evaporation is reduced, thus resulting in fewer clouds and a sunnier sky.
- Carbon dioxide concentration in the atmosphere stimulates plant growth. More plants consume carbon dioxide from the atmosphere due to photosynthesis. Thus, bringing its concentration down.
- Market price variation: if any product becomes of very high demand, its price grows until the supply meets the demand. If the price rises too high, fewer customers would buy it, so the price would go down again.
- An office worker has to work, but feels sleepy, so he may drink some coffee to get his energy up. But drinking too much coffee can cause some health effects from too much caffeine, and he may decide to limit his coffee consumption. Here, the human decision to drink or not to drink coffee attempts to bring the energy level to the optimal level.
Now think and add a couple of examples to the list. Can you draw a system diagram for any of these examples?
When considering system resilience - the ability to bounce back from disturbances – look for negative feedback loops. Negative feedbacks are also culprits of resistance to change. Sometimes, changing undesirable existing practices is difficult because of feedbacks acting within the system.
Remember, in the case of positive feedback, any induced change accelerates; in the case of negative feedback, on the contrary, change slows down with time as the system reaches the optimum state.
How to determine the sign of feedbacks
Here is the rule of thumb for determining whether a feedback loop is positive or negative: combine signs of all couplings involved in the loops. For example: a loop of 2 positive couplings results in a positive loop:
(+1)(+1) = (+1)
A loop of 1 negative and 1 positive coupling results in a negative loop:
(+1)(-1)=(-1)
This is the same rule that we use in math when multiplying negative and positive numbers. If you count an odd number of negative couplings in the closed loop, the feedback is negative. If you count an even number of negative couplings in the loop, the feedback is positive.
This rule becomes especially useful when you analyze the feedback loops consisting of multiple couplings. Let us check out a couple of examples.
Examples of how feedbacks work in systems
Example 1: Albedo feedback in climate science.
Here we will consider the connections between four natural elements: solar energy absorbed by the Earth, atmospheric temperature, polar ice, and Earth albedo (reflective ability) (Figure 1.14). Polar ice caps play an important role in controlling the amount of solar energy obtained by the Earth. Due to the high reflective ability of ice, overall Earth’s albedo increases with the expansion of polar ice and decreases when ice melts. Here is the positive coupling between polar ice and albedo. When albedo is high, a large fraction of solar radiation is reflected back to space and is not absorbed by the Earth. Therefore, we can draw a negative coupling arrow from albedo to solar energy absorbed by the Earth’s surface. Next, we will establish the positive coupling between the solar absorption and surface temperature. The more energy is absorbed by the earth’s surface, the more heat will be emitted off the ground into the atmosphere, thus raising the atmospheric air temperature. Finally, higher global air temperature will result in a decline in polar caps by causing ice to melt – hence the negative coupling arrow to close the loop of connections. We have a feedback in the system!
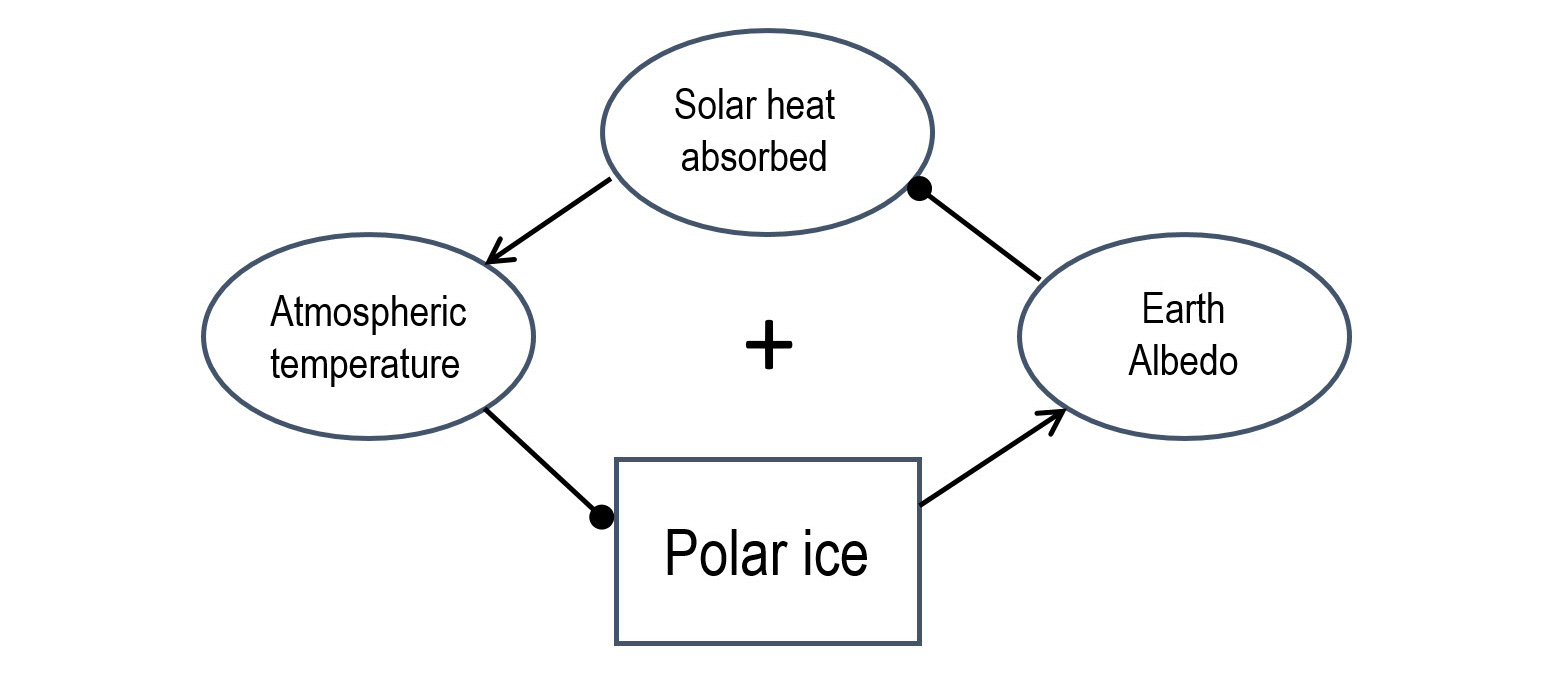
To decide whether this feedback loop is negative or positive, we need to count all couplings involved:
(+1)(-1)(+1)(-1) = (+1) this is a positive feedback!
What does it mean, and what development can we expect from this system?
As we previously learned, positive feedbacks are destabilizing forces, which often lead to the accelerated shift of system from its current state. Indeed, the currently observed rise in global atmospheric temperature (global warming) is responsible for shrinking the polar ice caps. The fast decline in polar ice is observed in both poles and Greenland. This change gradually decreases the Earth’s albedo, and that makes the planetary surface absorb more solar radiation, thus pushing the atmospheric temperature further up. That secondary warming causes more ice melting etc. The more this process continues, the more warming is intensified, and the faster ice melts.
There is strong scientific evidence that the cause of the currently observed global temperature rise is anthropogenic CO2 emissions. And albedo feedback is an additional amplifier that can act fast and push the warming to much higher rates than CO2 alone.
This positive feedback can work in reverse as well. In the history of the Earth, the albedo feedback played a big role in establishing the “ice ages” on Earth, which were accompanied by very fast expansion of glaciers (polar caps) towards the continents.
Check Your Understanding
Probing Question
Consider how you would answer the question below, then click on the question to view the answer.
Example 2: Fish Pond
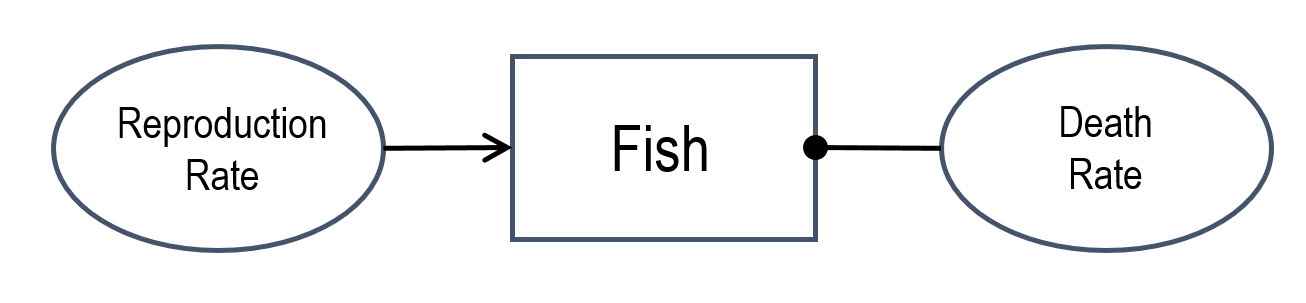
This example presents a much smaller system that is a very typical example of ecosystem that has reaching its carrying capacity. Imagine a small pond with a certain population of fish in it. To survive, the fish needs some food and oxygen in the water. The stock of fish is regulated by the factors such as reproduction rate and death rate. Let us identify some key couplings:
- Reproduction rate is positively coupled with the number of fish. The higher the reproduction rate, the high the fish population
- Death rate is negatively coupled with the number of fish. The high the death rate (for any reason, e.g. environmental conditions, disease, predators), the lower the fish population
We can depict these relationships in the system notation as follows:
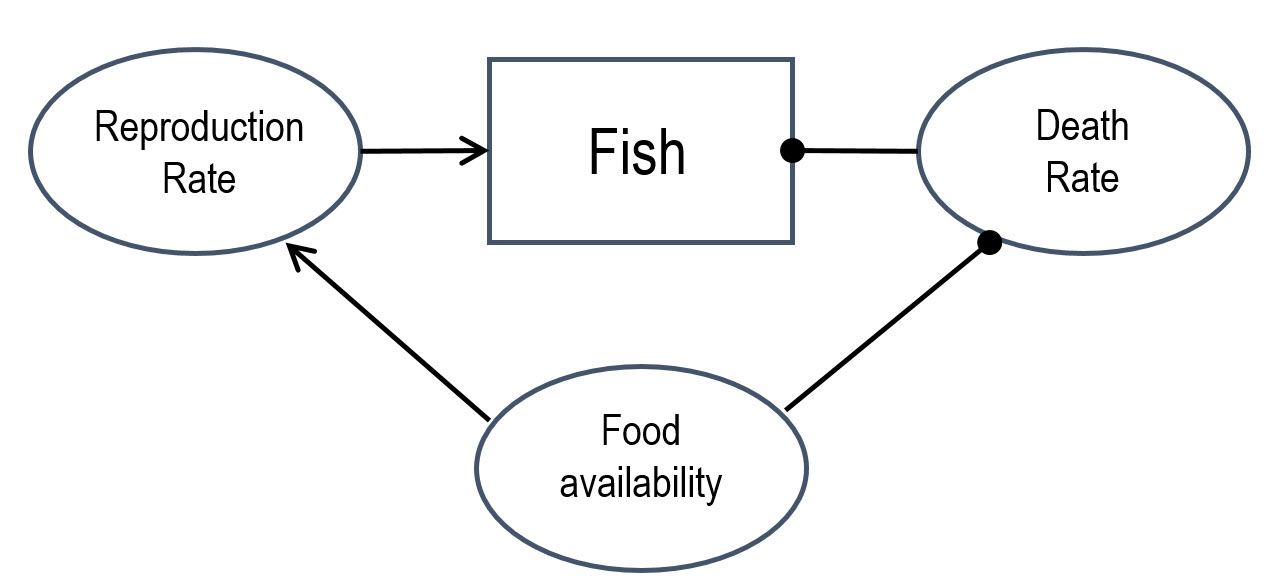
- Food availability in the pond favors fish growth and reproduction rate. So this is a positive coupling.
- In a finite-size system like a pond, the food supply can be limited, so if it is too low to support all the fish, fish will starve and die. Hence we can assume the negative coupling with the death rate
Let us add it to the diagram:
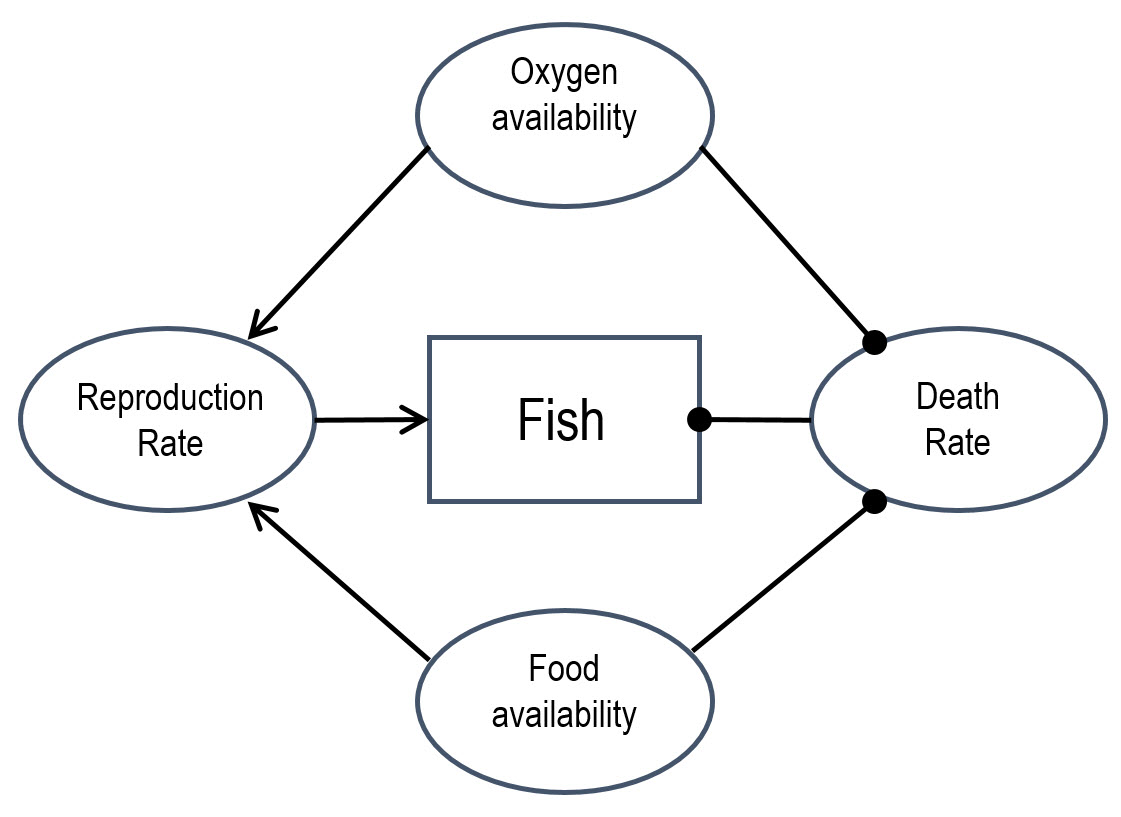
- The same as with food, oxygen supply is important for fish population health and growth – this is another positive coupling.
- The limited oxygen supply due to any factors (e.g., eutrophication, overpopulation, etc.) will stress the fish, limits its reproduction, and possibly increase the death rate as well – this another negative coupling.
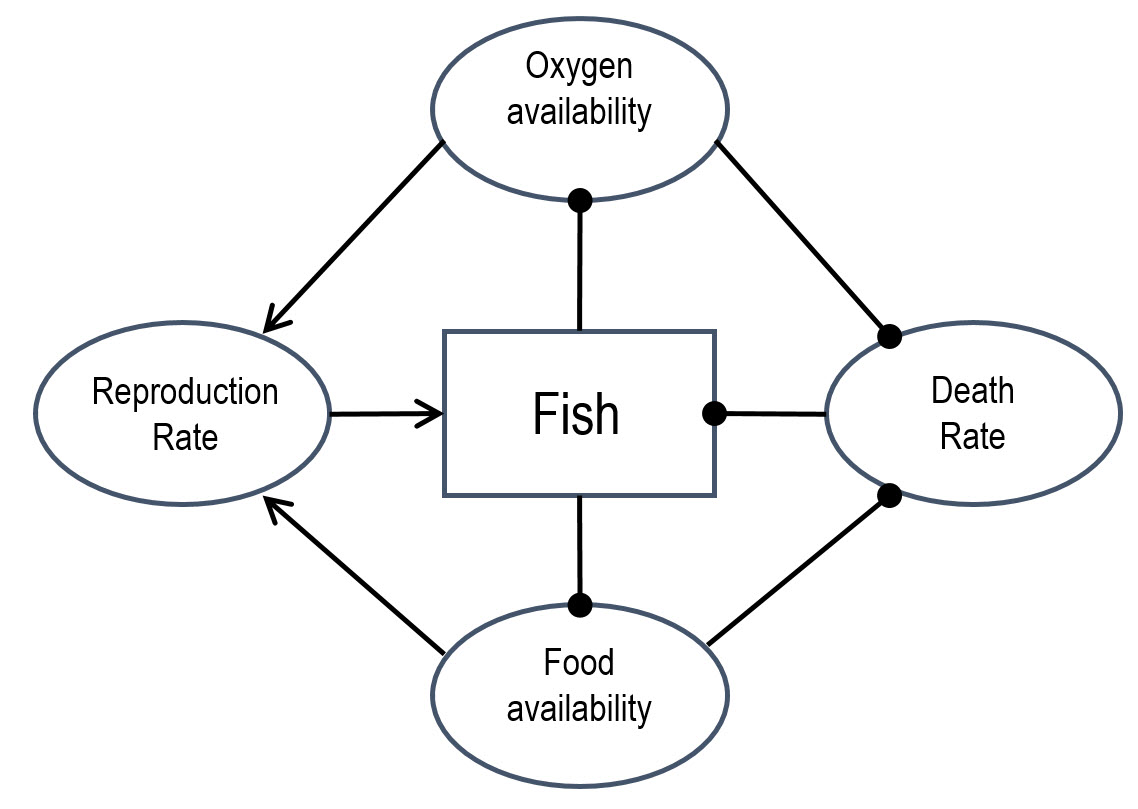
There are a couple more important arrows to add:
- The more fish are there in the pond, the less food remains available (food is not unlimited). This is the same situation as we have in any ecosystem, including humans – you need more and more food to feed a larger population. So we will draw a negative coupling between Fish and Food availability.
- The more fish are there, the less oxygen is available. While the atmosphere can be considered unlimited compared to the size of the pond, oxygen has a limited and quite low solubility in water. Fish will consume it by breathing, but also dead fish decomposition will consume some of it. So there is definitely a negative coupling between the Fish and Oxygen.
Putting these final two connections onto the diagram, we obtain:
Now let us identify the feedbacks. Are there any closed loops in the diagram? To have a complete feedback, we must be able to trace the couplings in one direction.
Check Your Understanding
Self-Check
Now let us determine whether each feedback is negative or positive using the rule of thumb explained in the previous sections. For example, for the upper left loop, starting with Fish, we have:
(-1)(+1)(+1) = (-1) - It is a negative feedback!
We can do the same to identify the other three loops in the diagram:
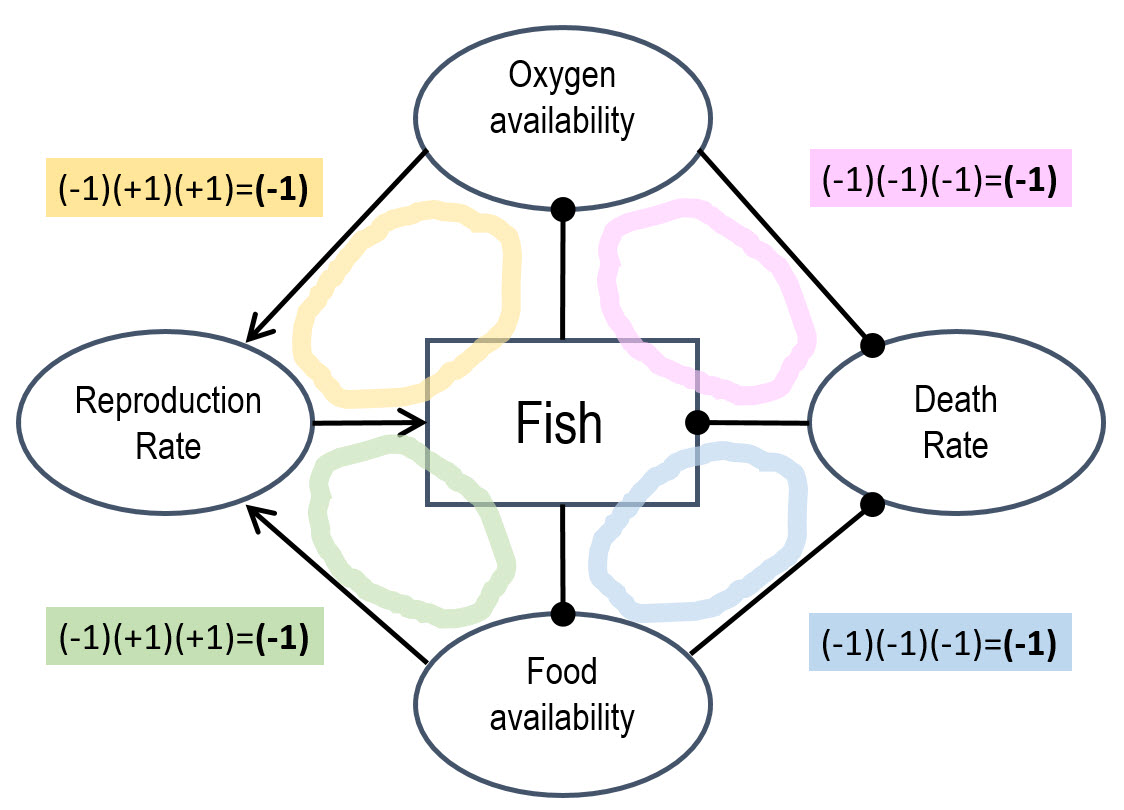
This system appears to be full of negative feedbacks, and that is quite common for natural ecosystems. There are many regulating factors that keep the population of biological species in check. Once the system starts growing out of its capacity limits (food, oxygen supply), the feedbacks start dialing the numbers down until the optimum state (homeostasis) is restored. This example is a demonstration of how negative feedbacks tend to maintain the stability of the system at a certain level. Here we have as many as four mechanisms that help the system execute this goal.
Feedback loops with human decisions
The beauty and power of the system approach is that it can help explore inter-domain connections. Many systems currently exist at the interface of the natural and technological worlds and hence can include factors of economic, social, and environmental nature.
Many causal connections in the environmental systems are sort of predetermined and dependent on the laws of nature. For instance, if temperature increases, gas solubility in water decreases. If a ton of coal is burned, a certain amount of heat is released. If the ocean becomes more acidic, carbonate shells do not form. Those things are just physics and chemistry – there is no intelligent ruling behind them. However, causal connections may be different in human systems, because very often humans have a choice: to turn left or right; to approve or reject a policy; to invest or not to invest; to start the war or negotiation. Those decisions can make an impact within the system, but it does not mean they control the system. In fact, some intelligent (or dumb) decisions can very much be a product of system behavior. In other words, people may take decisions without realizing that they are being controlled by the system itself!
We mentioned before that one of the important system’s properties is function or purpose. The word purpose is more linked to human thinking, so systems can be created to fulfill a particular purpose. The word function is more typical for non-human systems, and function is often visible from the system’s behavior. Please note that human decisions can be made with a purpose in mind, but that purpose in the mind of an individual (perceived or apparent purpose) does not necessarily coincide with the purpose of the system (actual purpose). This is an important distinction. Here are some examples of such dual-purpose dilemma:
- A musician may initially perceive their career in the music industry as art and a way of self-expression (perceived purpose), but the system may steer them towards songs that gain most popularity and make the most money (actual purpose);
- A parent chooses to punish their child for bad grades with the purpose to make them work harder and to improve learning (perceived purpose), but punishment may cause the child to hide their grades or cheat for the sake of a better grade (actual purpose);
- Cat meows loudly in the middle of the night to demand food from the owner. The owner gives the cat the food so that it let her sleep. But guess what – the cat comes back to meow every night now! Perceived purpose = keep the owner happy, actual purpose = keep the cat happy.
Understanding the system behavior can actually help us make smart decisions and steer the system purpose in the desired direction, even those decisions are not always intuitive.
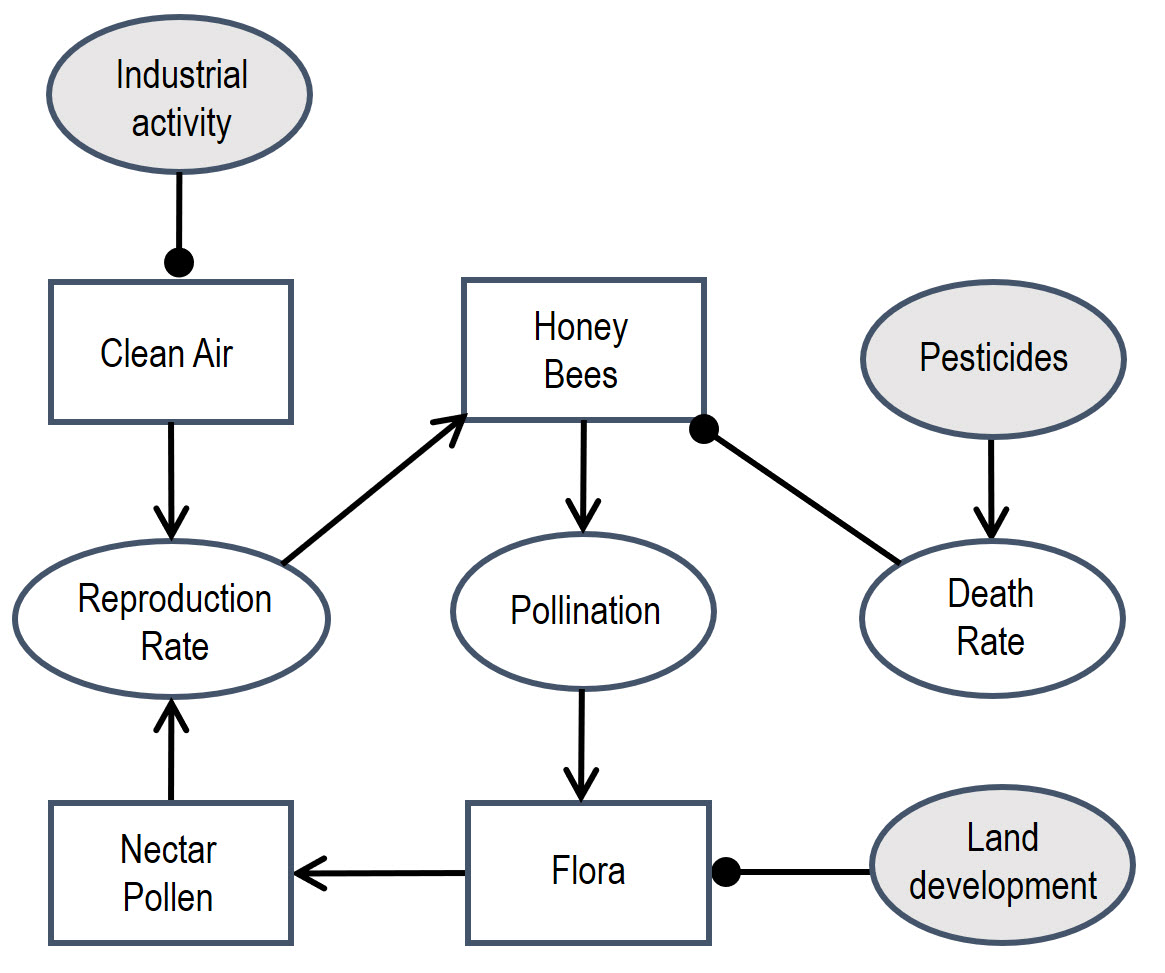
Example 3: Honey Bee Hive
There are a number of environmental factors that sustain the purpose of the honey beehive. It needs a specific habitat with natural flora that provides bees with sources of nectar, clean air and water, which sustain vegetation. Human activities, such as agriculture using pesticides, industrial development, and water and air pollution can be highly disruptive to honey bee populations. We will try to put those factors onto the system diagram (Figure 1.16).
You can identify the positive feedback in this system, which is responsible for ecosystem growth under healthy environmental conditions, with bees and plants mutually benefitting each other. The anthropogenic (human activity) factors, shown by shaded circles, are negatively coupled with different factors in the system. We know that when a positive feedback exists in the system, it can work both ways. A drastic decrease in any of the factors in the loop can result in a fast decline of the entire system.
Human decisions can interfere. For example, a decline in the main stock – honey bee population - below a certain critical level can be an alarm signal for the local conservation agencies, who can work with policy makers to protect the natural habitat and resources from excessive exploitation or pollution. That additional factor, when introduced to the system, creates several negative feedback loops that forcefully regulate the industrial factors and keep the system in balance (Figure 1.21).
Check Your Understanding
Probing Question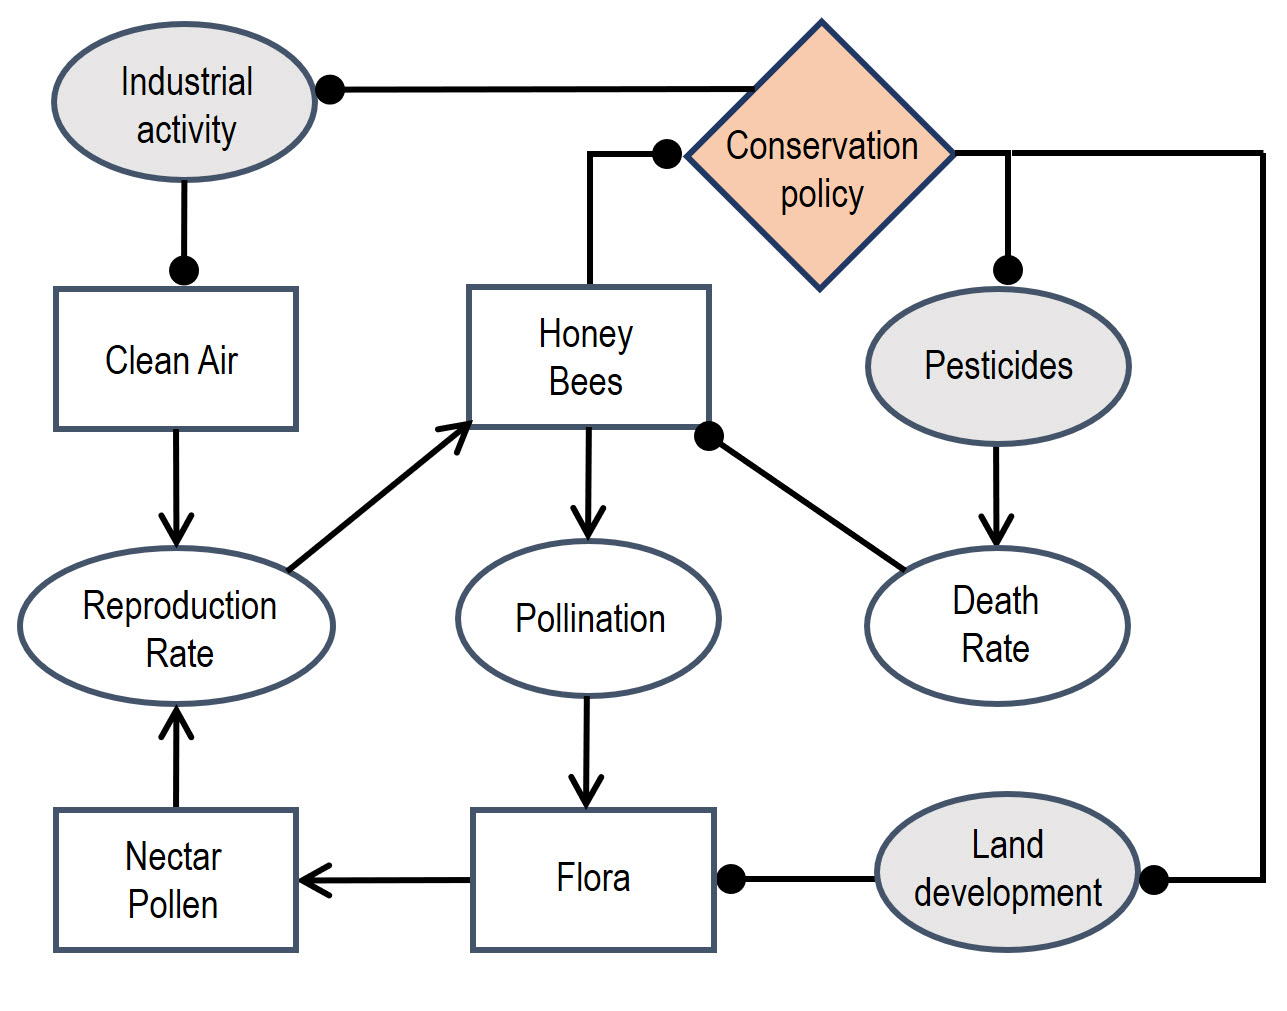
Consider how you would answer the question below, then click on the question to view the answer.
Sustainability in system thinking
So, what would make the system like the ones exemplified above sustainable? A simple answer within the arbitrarily identified boundaries would be: the balance of the main stocks. The balance does not mean constancy, but rather refers to a range where system can recover from stock fluctuations through internal mechanisms. We already saw how stocks can be regulated by feedback loops that involve both physical forces (natural laws) and intellectual forces (human decisions). Here, we come to an important observation: human decisions need to conform with the natural processes. Natural and human forces must work with each other, not against each other, to support the capacity of the life-providing stocks. This takes us back to the first Hanover Principle of sustainable design. Systems thinking brings us to the right mindset for applying sustainability principles to a variety of case studies we will discuss in the remainder of this course. To extend your learning of the systems approach, you can refer to the additional reading materials:
More reading on systems
Book: D. Meadows, Thinking in Systems, Chelsea Green Publishing, 2008.
This book is a really great reading regardless your professional area – it starts with the basics and leads through the fascinating gallery of systems covering a variety of areas and providing some good examples. It uses slightly different terminology in diagrams than we use in this lesson, but emphasizes the same key ideas.
1.7 Growth, Delays, and Tipping Points
1.7 Growth, Delays, and Tipping Points
Growth
Since this lesson has some analysis and discussions of growth, it would be interesting to see how growth happens in system dynamics. Two types of growth we want to pay attention to are linear and exponential. Linear growth is when a value grows at a constant rate (slope). Positive couplings in systems are a usual cause of linear growth. For example, more product sold means higher profit; more fuel burned, more energy is released – those are simple observations. Exponential growth is different – it goes at an increasing rate – it accelerates! Systems with positive feedback loops often exhibit exponential growth, because the initial stock is continuously compounded by the positive couplings included in the loop.
Mathematically, these two types are schematically represented in Figure 1.22.
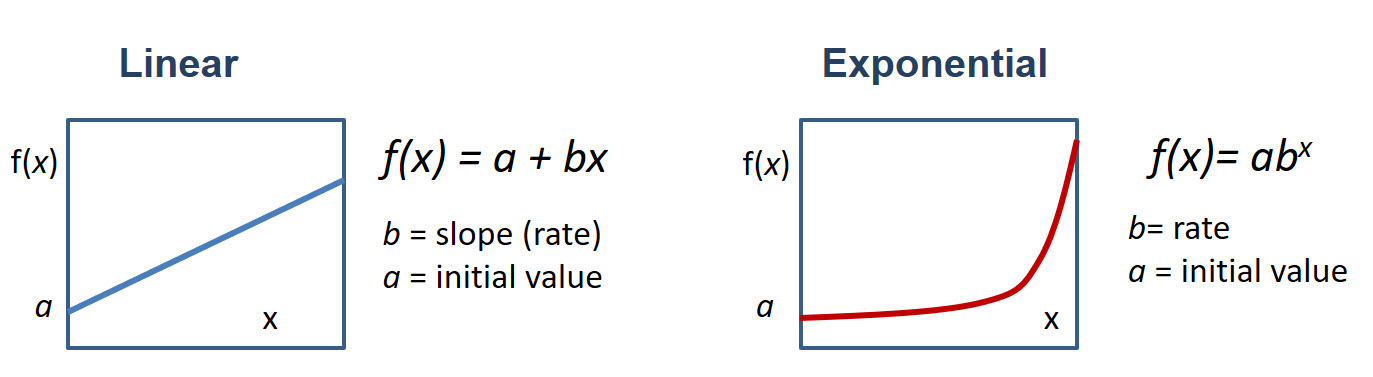
One of the examples shown in the previous section was about the bank account with interest. Adding interest to your balance increases the initial stock and thus earns you higher interest. This illustrates how a positive feedback works. Another example is population growth. When unhindered, the positive feedback loops are expected to cause exponential changes in system stocks.
Example: How to Use Exponential Formula
f(x) = abx
This mathematical expression generically represents an exponential process. In this formula:
f(x) is a function – the amount we try to track over time. In the case of a bank account, it will be the account balance, or in case of population growth - the number of chickens, bacteria, or people.
a is the initial value, e.g., the account balance to start from or starting population of species.
b is the base, which indicates the factor by which the initial amount changes per unit of time. For example, if the number of bacteria doubles every hour, b=2. Or if the bank account grows by 6% every year, b=1.06.
x is an exponent, which acts essentially as a time coordinate. For example, if you try to calculate the function for 10 hours ahead, x=10.
Starting with 1 bacteria (a=1) and hourly doubling increase (b=2), in 10 hours we will have f(x) = 1 x 210 = 1024 bacteria.
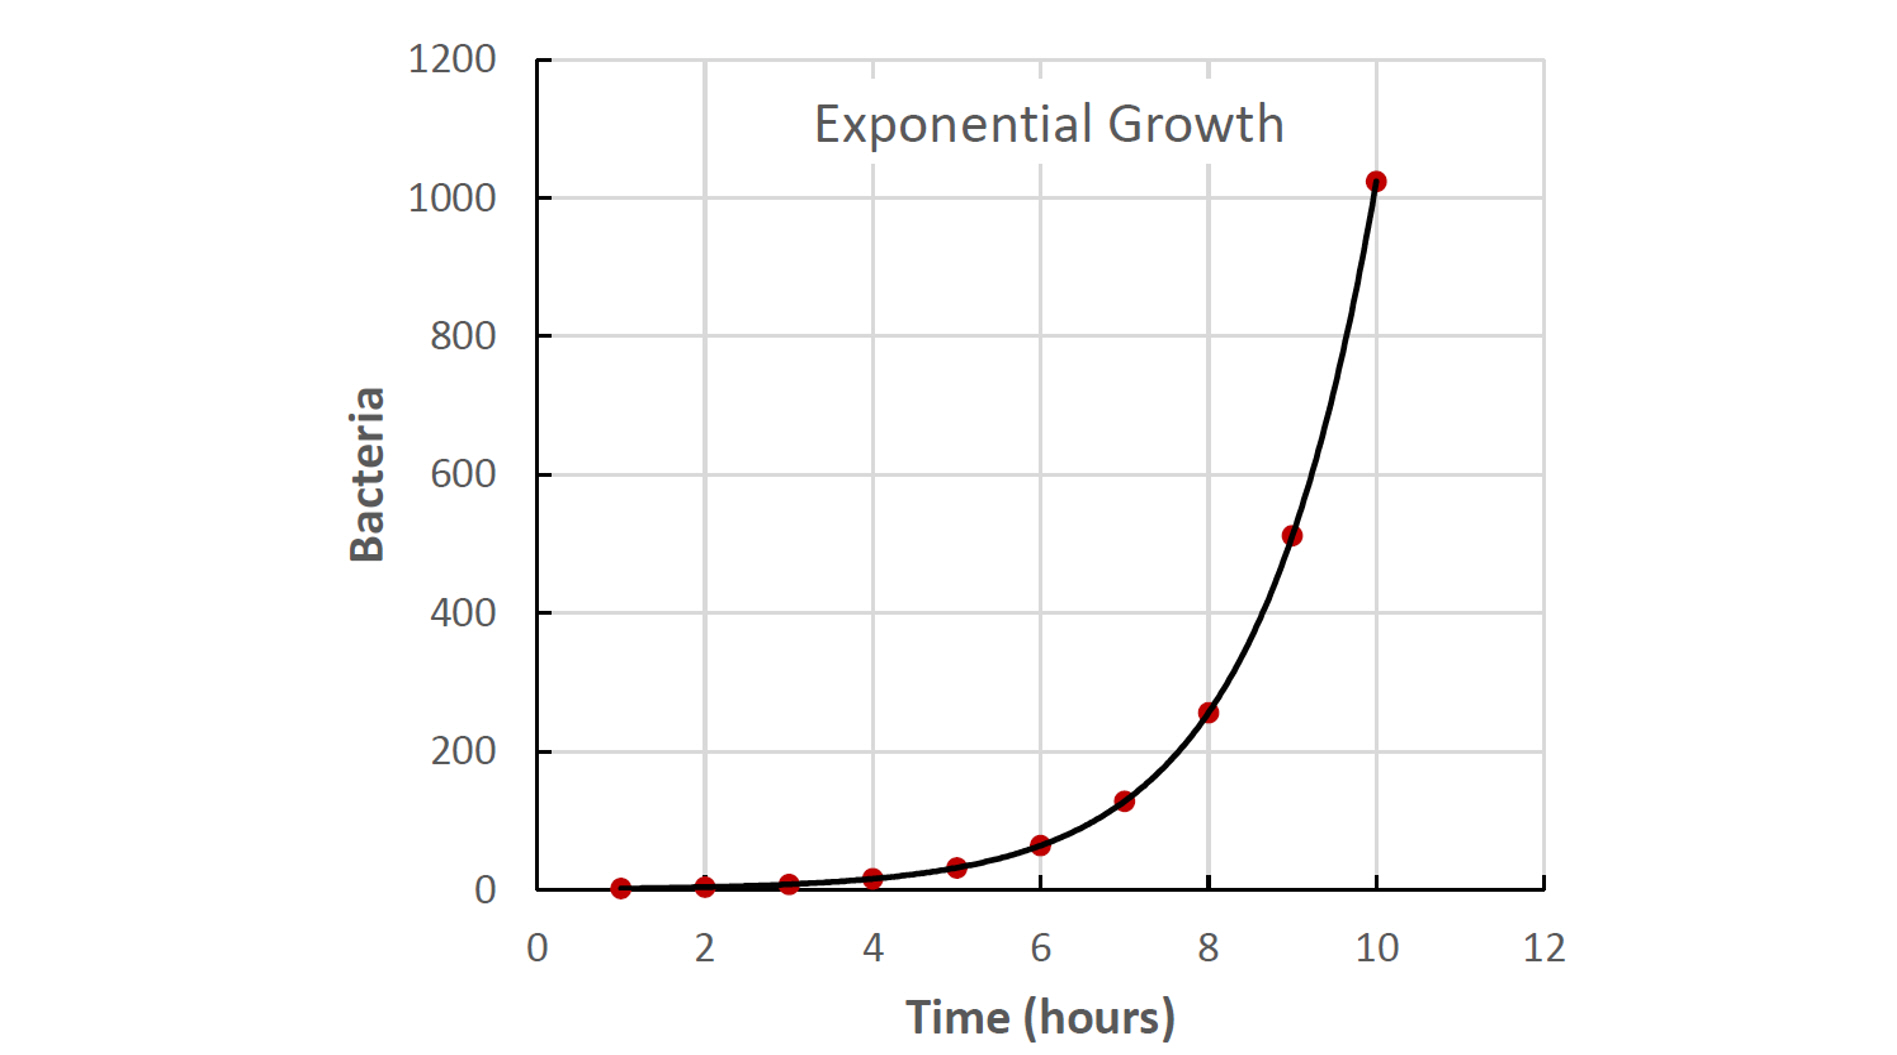
Self Check Questions
(click on dots below to switch between questions)
From the above examples, we can make a few interesting observations:
- Exponential growth starts slow, but it becomes fast very fast.
- The result of exponential growth is very hard to predict intuitively because we are used to thinking linearly
- Very often, exponential growth is the result of positive feedback in the system
- Negative (balancing) feedbacks are one way to limit system growth
- Exponential growth cannot be sustainable within a finite-size system and reaching capacity crisis is only a matter of time.
Linear growth is typically a result of a positive coupling. Exponential growth is typically a result of a positive feedback loop. There are, of course, exceptions to this rule.
TRY THIS! Activity
Shortcut on exponential prediction.
The time over which the exponentially growing stock doubles in size is called “doubling time”. You can estimate the doubling time by dividing 70 by the growth rate (in %).
Example 1: The bank account having $1000 and 6% interest rate will double (to $2000) in 70/6 = 11.7 years.
Example 2: The Earth's population is currently close to 7,832,000,000 and is growing at ~1.05% annually. When will it double if the rate stays the same? Answer: 70/1.05 = 66.6 years
Delays
When we discussed couplings in systems, we mentioned that such causal connections exist when A affects B in either a positive or negative way, but we did not pay much attention to how fast that happens. Some changes can be almost instantaneous (or at least seem like that). For example, clouds moving across the sky immediately change the flow of solar energy coming down to earth, and suddenly we feel cooler, or if the sunlight is used for electric generation, the voltage of the solar panel quickly drops. But other changes may take minutes, hours, days, years, and even millennia. That essentially means we have a delay between the cause and its effect.
Examples of systemic delays are multiple. Here are just a few:
- Incubational period of a viral disease – time between virus entering the body and symptoms
- Forest growth – time between seeds germinate in the soil and trees reaching a certain height;
- Greenhouse effect in climate – time between atmospheric carbon dioxide concentration increase and global temperature increase
- Prices in the market – time between supply or demand grow and decision to adjust the price for a product.
The larger the system, the greater the volume of the stock, the longer it takes for it to respond to change. That is why planetary system often experiences changes (climate, ocean chemistry, geochemical cycles) with significant delays - at the scale of thousands and millions of years. That is why technological, economical, and cultural changes often happen much faster at the community level than at the national level.
Delays are important to take into account in system analysis, since they impact system behavior and resilience. Delays in every coupling in the negative feedback loop would add up, thus postponing system response to perturbation. When uncompensated, the perturbation lasts longer, pulling system further off balance.
One of the favorite examples of systemic delay is shower. Have you ever experienced this situation: the water feels too cold and you adjust the hot water knob to make it warmer, but nothing happens, so you adjust it even more, and a little bit more… and then you feel it! It finally gets warmer, but soon enough it feels too hot, and you jump aside and start adjusting the knob in the opposite direction. It takes quite a bit before it is comfortable to stand under water again, but once you think you finally got it, water gets too cold again, and the fine-tuning continues..
We can also depict this process in a system diagram if you wish:

In this process, the temperature of water goes up and down, only bypassing the optimal comfort temperature, resulting in oscillation. Eventually, understanding the delay, you start being more patient, wait for the change and make smaller adjustments. With a few more overshoots, you finally reach the optimal temperature. The system is stabilized!
Why are you able to stabilize the system eventually? In the process of regulating water temperature, you learn – you get information about how long the delay is between the knob turn and actual water temperature change. You also learn how much the temperature changes per certain degree of knob turning. Of course, you process this information almost subconsciously, and it takes a little bit of trial and error.
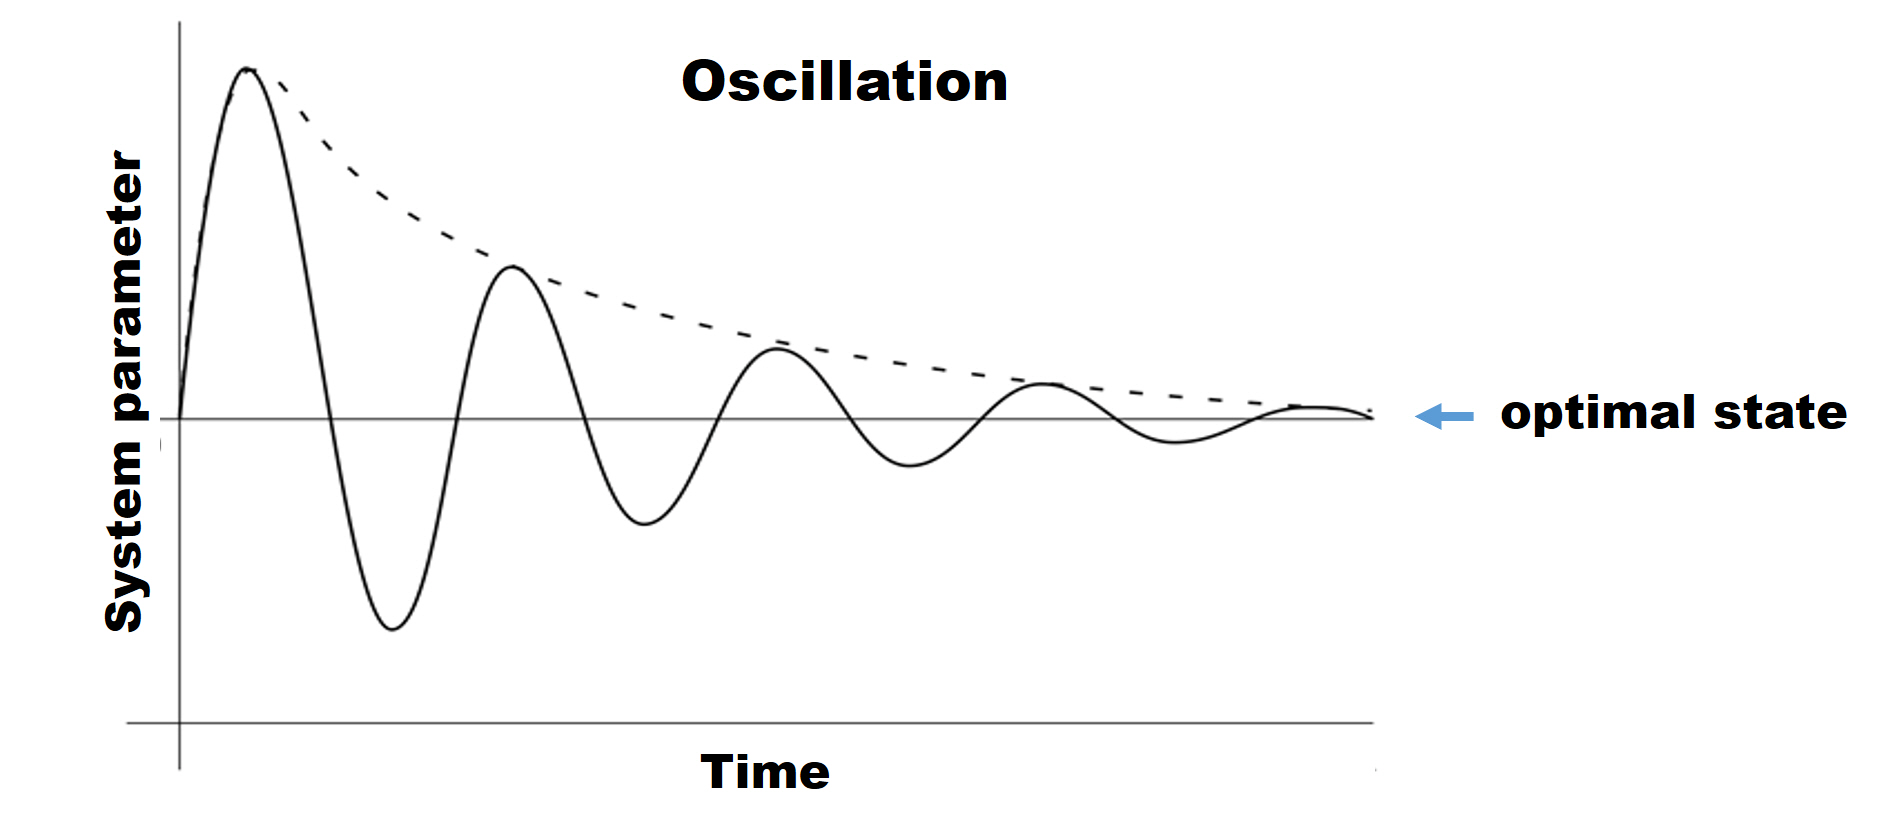
Many other systems with negative feedbacks – for instance, regulation of inventory stock based on supply and demand, regulation of earth climate by biota – may exhibit similar oscillations that complicate the system behavior.
Very often, regulating the system operation to improve its performance comes down to managing its delays. Interestingly, acting fast in the system with delays may only exacerbate the situation and make negative impacts and further delays even more dramatic. Instead, understanding delays and letting them run their course may be a better strategy to optimize system performance [Eakes, 2018 [19]].
In summary:
- Delays may significantly affect the system behavior and stability.
- As a rule, the larger the system, the longer the delays.
- Delays often result in disbalance, overshoots, and oscillations in systems.
- Uncovering and understanding delays can help improve system performance.
Tipping points
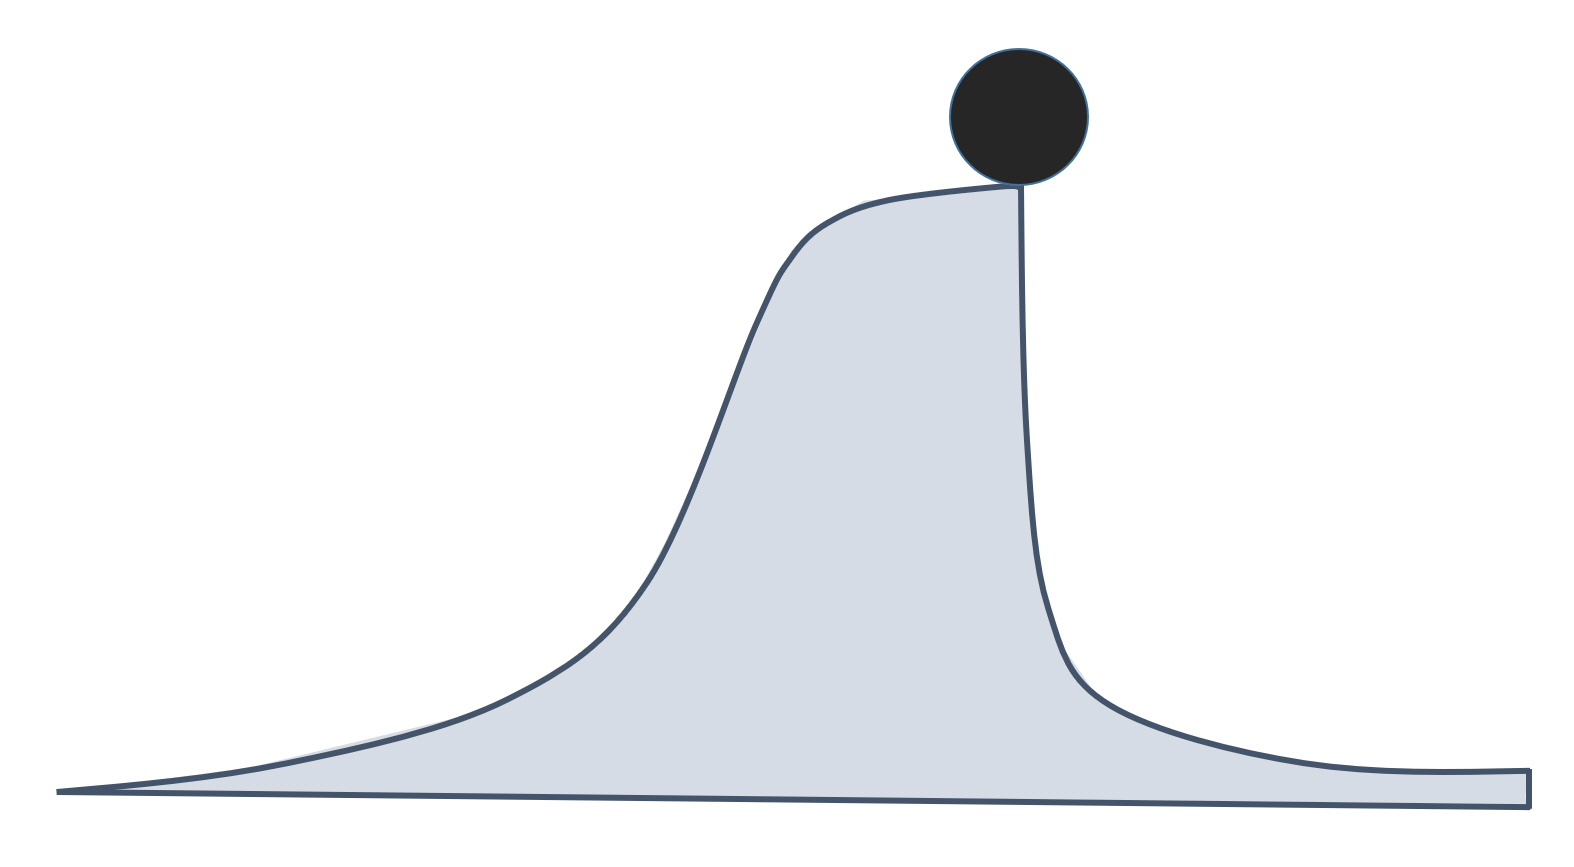
Tipping points is another interesting phenomenon that occurs in some systems. This topic can certainly be a subject for a deeper discussion, but it is worth mentioning it here at least briefly.
Tipping point is a special condition in a system, at which a very small perturbation or causes a large or even catastrophic change. Obviously, the small change is not the main cause, but only a trigger, the last drop in a long and sometimes complicated chain of interactions and events that lead the system to this condition. The term “tipping point” originated in the mathematical catastrophe theory [20] and only recently started to be used in the global environmental context. Most frequently, tipping points are investigated in the relation to climate science and ecology.
Tipping points are frightening because they are not easily predictable, and when the tipping events are triggered, there is no way to reverse the process. Also the events that occur when a system passes through a tipping point are usually dramatic, proceed at a high rate, and have no forewarning. Therefore, understanding the nature and the actual causes behind the tipping points is important for designing preventive measures. Tipping points are very characteristic of systems with counteracting negative and positive feedbacks.
If you are compelled to read more about this concept, additional explanations and some good examples are given in the following reading:
Optional Reading
Review Article: Lenton, T.M., Environmental Tipping Points, Annu. Rev. Environ. Resour. 2013. 38:1–29.
URL: https://www.annualreviews.org/doi/pdf/10.1146/annurev-environ-102511-084654 [21]
It should be understood that tipping points are not results of external forces, which can also cause dramatic shifts and catastrophes, but are rather internally justified. Another take-away is that, like any other systemic phenomena, tipping points can happen in both natural and social worlds – they are not only confined to the physical processes. Tipping points are observed in societal systems and can be marked by major paradigm shifts, dramatic changes in thinking, decision making, and political transformations. It is very possible that passing of the human society from the current state to a new state with a higher degree of sustainability may also require passing through a tipping point when some traditional worldviews are rejected, and new ones are adopted. Hence, the tipping points do not only present risks, but also opportunities in socio-economic evolution.
Boundaries and system hierarchy
It should be noted that any system model is always a simplification, and system analysis has to be iterative to identify the most significant controls and relationships that determine system operation and stability. Although limited, system analysis can provide interesting insights into system behavior, helps understand the trends in social and technological development, and provides grounds for short-term and long-term predictions.
While real systems are often complicated, making the system model overly complex is not practical - it is important to set boundaries, which would help constrain the analysis and provide answers to practical questions. Boundaries are defined by the observer. Boundaries do not mean that the system is isolated from the outer world, they simply set limits; any entities beyond system boundaries are assumed to be of minor relevance and are not examined in detail until the current model requires. For example, in the honey bee hive system described earlier, we do not consider the factor of climate, even though it is important. In the short term analysis, we simply assume it is constant. Also, we do not include economic factors such as the honey market or artificial beekeeping, etc., leaving them outside the system boundaries and just focusing on the health of the natural ecosystem.
Virtually any system is a hierarchy. That means that any system consists of smaller subsystems, and any system, in turn, may be considered as an element of a bigger system. The tree itself is a system; the soil bed is a system; any biological organism is a system with its own control factors. At the same time, the forest can be considered as a sub-system of eco-region, which is, in turn, may be perceived as a sub-system of the planet, etc. This is another reason for setting boundaries and choosing system scale before engaging in system analysis.
1.8 Global Sustainability System
Global sustainability system
To set the framework for applying sustainability principles to engineering activities and technologies, let us for a while widen the angle of our view and first look at the global interconnections. Later on, when zooming in to particular processes and technologies, some of these global elements and loops may remain beyond the boundaries of our viewfinder. However, it will be important to keep these large-scale connections in mind.
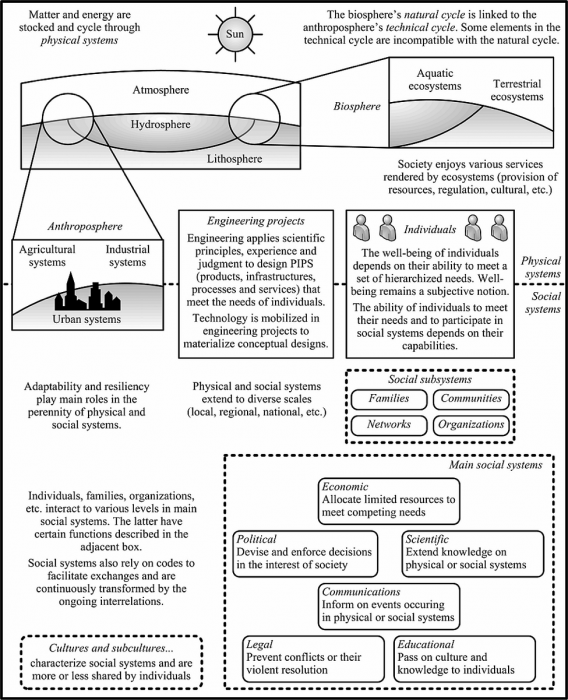
The scheme in Figure 1.20 includes both physical and social systems in consideration. Physical systems are shown by several overlapping spheres in the upper part of the diagram: the first one is biosphere (which includes the aquatic and terrestrial ecosystems), the second one is the anthroposphere (which encompasses the agricultural, industrial, and urban systems); both of these are positioned at the triple boundary between the atmosphere, lithosphere, and hydrosphere of the earth. The sun symbol above indicates the unlimited light resource. We can expand the anthroposphere box, indicating the significant role played by engineering projects as human activity. Design and engineering result in creation of products, infrastructures, processes, and services, which all increase the extent and influence of the technical cycle. The Engineering Projects box is linked to Individuals box, meaning that technical progress is incurred by and benefits individuals in the social sphere. The feedback we can assume here is possible disturbance of the natural systems due to expansion of the anthropogenic technical systems. This expansion, in turn, can jeopardize the benefits human beings and societies derive from the environment. Individuals are given a central place in the framework since physical and social systems both contribute towards their well-being. The Social Systems box at the bottom of the diagram provides a more detailed representation of those benefits, which include economic, political, scientific, legal, educational values and communications. Shown social sub-systems, such as Families, Communities, Networks, and Organizations, interact to a various degree with the main social systems and fulfill certain functions. This framework diagram is very broad, and each box could be presented as a separate sub-system with its own internal connections. But this is the big picture, which allows us to contemplate on the diversity of the factors that contribute to the sustainability of human society.
Now, think where technology fits into this diagram. Virtually, it fits anywhere at the connections of the anthropogenic spheres with the physical systems. For example, through technologies, society can utilize natural resources. We also understand that technologies can do both: reconcile the processes and matter flows between the anthroposphere and environmental spheres and create conflicts between them. Thus, engineering projects undermining the resilience or adaptability of ecosystems, social systems, or individuals might bring benefits in the short term but are likely to have long-term negative outcomes. What we call sustainable technologies are designed to render the feedbacks and connections mutually harmless or mutually beneficial in the best-case scenario. To assess technologies from this angle, we need to learn to recognize the feedbacks and effects they create on a large scale.
Summary & Activities
Summary & Activities
Lesson #1 started introducing you to the sustainability context, reviewing the main philosophical principles of sustainability as well as practical guidelines applied to sustainable design and engineering. From these philosophies, we can clearly see that any analysis of engineering projects, technologies, and processes from the standpoint of sustainable development must be done in a wider framework, which includes environmental, economic, and social forces.
Here, we also browsed through the important background of systems approach, which emphasizes interconnections and feedbacks as controls of system stability or instability. Based on this review, we started to determine the role of technology in the dynamics and function of anthropogenic systems. We can see that technologies work at interfaces between the physical world and society. Technologies can be efficient tools regulating the system inputs and outputs, and also can serve as drivers of change and lifestyle builders in society. This prepares us for the next step – developing the metric system and methods for technology evaluation in the next lessons.
Assignments for Lesson 1
| Type | Assignment Directions | Submit To |
|---|---|---|
| Reading | Complete all necessary reading assigned in this lesson. There is a lot of reading, but it provides essential background for us to move forward towards practical objectives. | |
| Discussion |
Growth / No-growth Dilemma. We will start off with a debate on the growth / no-growth dilemma. Read the two web articles referred in Section 1.2: Daly's article "From a Failed Growth Economy to a Steady-State Economy" and Ellis's article "Overpopulation is not the Problem". Make a forum post (limit to 250 words) expressing your opinion to the questions: (1) Is sustainable society achievable? (2) Do you think that sustainability and economic growth are conflicting paradigms? (which of the authors do you agree more with?) (3) What are trade-offs, alternatives, or breakthroughs that may be needed in solving the sustainability puzzle? Just express your opinion. Please read others' posts and comment on at least two of them. Follow up on any comments made to your post. Deadline for initial posting – this Sunday. Post your comments to other threads by the end of the lesson Wednesday. |
Canvas: Lesson 1 Discussion |
| Activity |
Systems thinking exercise (see Lesson 1 Activity Sheet on Canvas):
Schematic can be either hand-drawn and scanned to file or made with a graphic software. Please type your annotation. Submit your assignment in a single PDF or MS Word file. Deadline – Wednesday night 11:55 pm (your local time!) |
Canvas: Lesson 1 Activity |
References for Lesson 1:
Becker, C.U., Sustainability Ethics and Sustainability Research, Ch. 2. Meaning of Sustainability, Springer 2012.
Chapman, J., Design for (Emotional) Durability, Design Issues, v.25, Issue 4, 29 (2009).
Daly, H., From a Failed Growth Economy to a Steady-State Economy [2], in The Encyclopedia of Earth, 2009.
Eakes, S., Managing Delays, System Thinker, Leverage Networks, 2018. URL: https://thesystemsthinker.com/managing-delays [Accessed [22] 01/2021]
Ellis, E., Overpopulation is not the Problem [23], New York Times, Sept.13, 2013.
Gagnon, B., Leduc, R., and Savard, L., Sustainable development in engineering: a review of principles and definition of a conceptual framework [16]. Cahier de recherche / Working Paper 08-18, 2008.
Kump, L.R., Kasting, J.F., and Crane, R.G., The Earth System, 3rd Ed., Prentice Hall, 2010.
Lenton, T.M., Environmental Tipping Points, Annu. Rev. Environ. Resour. 2013. 38:1–29.
McDonough, W., The Hannover Principles.Design for Sustainability [24], William McDonough Architects, 1992.
McDonough and Braungart, M., Cradle to Cradle. Remaking the Way We Make Things, North Point Press, NY 2002.
Meadows, D.H., Thinking in Systems, Chelsea Green Publishing, White River Junction, VT, 2008.
Odum, H.T., Self-Organization, Transformity, and Information, Science 242, 131, 1988.
Rodriguez, S.I., Roman, M.S., Sturhahn, S.C., and Terry, E.H., Sustainability Assessment and Reporting for the University of Michigan Ann Arbor Campus [25], Report of the Center for Sustainable Systems, No. CSS02-04, 2002.
UN Document: Report of the World Commission on Environment and Development: Our Common Future [1], Chapter 2, Geneva, Switzerland, March 20, 1987.
Venables, R., Civil Engineering - Jubilee River [17], in Engineering for Sustainable Development: Guiding Principles, Royal Academy of Engineering, Dodds, R., and Venables, R., Eds., 2005. pp. 11-14.
Lesson 2: Technology Development and Lifecycle Assessment
2.0 Overview
Overview
In this lesson, we will discuss the role of technology in society and how it develops on its way to commercialization. You will review the technology readiness level (TRL) scale adopted by a number of government agencies and see what kind of information is needed to estimate it. This lesson also sets the background for using the life cycle assessment methodology (LCA), which allows us to view a bigger picture of a technological process, with its multiple pros and cons and impacts on other parts of a sustainability system. Life cycle assessment is a complex approach, which requires extensive data digging and process expertise. While you will not be asked to perform the complete analysis on your own, some LCA-related exercises in this lesson will help you develop a big-picture mindset about technologies and products. Both TRL and LCA assessment methodologies will be useful in your individual course project, so take notes of the resources provided on those topics.
Learning Objectives
By the end of this lesson, you should be able to:
- explain the role of technology in society and in feedback loops of anthropogenic systems;
- articulate the technology readiness levels and identify the data needed for TRL analysis;
- apply the fundamentals of the life cycle assessment (LCA) and draw LCA scope and flow diagrams.
Readings
Journal article: J.B. Guinee et al., Life Cycle Assessment: Past, Present, and Future, Environ. Sci. Technol., 2011, 45, 90-96. (see Canvas)
US EPA Document: Life Cycle Assessment: Principles and Practice [26], EPA/600/R-06/060, 2006.
Questions?
If you have any questions while working through this Lesson, please post them to our Message Board forum in Canvas. You can use that space any time to chat about course topics or to ask questions. While you are there, please feel free to post your own responses if you are able to help out a classmate.
2.1 Technology as a part of anthropogenic environment
2.1 Technology as a part of anthropogenic environment
How do we define technology? In this course, specifically, we need to look at a particular technology, process, or product as an active part (component) of an anthropogenic system. In such context, a technology is not simply a piece of human knowledge implemented through design and engineering principles, it is considered a "living" part of a bigger organism. Here, we use the word "living" because our interest will be to assess the entire lifecycle of a technology: development, adaptation, operation, interactions with natural and technical environment, aging, and death (in some cases). Further on, we will try to understand how technology development impacts the viability of the whole system.
The common definition of the term technology is quite broad and multi-colored. The most simplistic one is application of scientific knowledge for practical purpose. And as an extension of it, the tool or device enabling that application is typically also referred to as technology. You can read more on the history and usage of this term in a Wikipedia article on Technology [27]. You may recognize that the meaning strongly depends on the context and the professional area you are in. However, in this course, we need to distill this broad perception of technology to a more specific entity that can be used for practical analysis.
Energy and matter conversion
The most important ability of almost any technology is conversion. A technology uses inputs of energy or matter to create outputs of energy or matter of a different quality. In a general case, any technology can be represented by the following scheme (Figure 2.1):
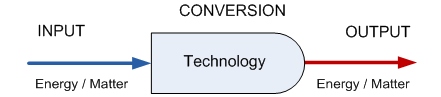
So, technology typically serves as a conversion portal in a system. We use energy to produce materials; or use raw materials to produce some more complex products; or we use matter to convert forms energy; etc. Note that conversion can also be performed by natural systems or mechanisms; but we only define technology as a human-made conversion system.
Here are some simple examples:
- Chemical energy of fuel >>> Car >>> Kinetic energy of car motion
- Radiative energy (sunlight) >>> Solar panel >>> Electric energy
- Electric energy >>> Phone >>> Sound, light
- Contaminated water >>> Water treatment plant >>> Clean water
- Electric energy >>> Furnace >>> Thermal energy
- Flour, water >>> Baking machine >>> Bread
- Organic waste >>> Composting >>> Fertilizer
- Electricity, mechanical energy >>> Electric guitar >>> sound
You can continue this list.
Self-Check
See if you can identify the energy and matter inputs and outputs for the following technologies:
- ? >>> Coffee maker >>> ?
- ? >>> Battery >>>> ?
- ? >>> Loud speaker >>> ?
- ? >>> Microwave >>> ?
ANSWER
- Water, ground coffee, electricity >>> Coffee maker >>> Coffee Drink
- Chemical energy >>> Battery >>>> Electricity (upon discharge)
- Electricity >>> Loud speaker >>> Sound
- Electricity >>> Microwave >>> Microwave radiation, kinetic energy (rotation)
Conversion efficiency
Obviously some technologies are better converters than others, and the following metric allows us to compare different technological options and choose a "better deal" in terms of useful output and money spent.
The key characteristic of any conversion process is efficiency. Efficiency is estimated based on the amount of useful output per unit input. In that sense, it is a subjective value which depends on a particular goal or purpose of a technological process, and a particular input resource we are concerned about. Hence, efficiency has widely varying meanings in different disciplines.
For example, efficiency is a very common metric in the field of energy conversion. According to the energy conservation law, the total energy entering a conversion device should be equal to the total energy output by the device:
Ein = Eout
Some of the output energy can be considered useful (based on the purpose of conversion), and some of it can be considered not useful and attributed to "losses":
Eout = Eout(useful) + Eout(loss)
What is useful and what is not is up to us to define (nature does not care!).
So, efficiency determines the fraction of the useful energy as follows:
Efficiency = Eout(useful) / Ein × 100%
Efficiency is important in the sustainability context because it indicates how much of the resource is put to work, and how much of the resource is wasted in the process. The reasons for losses are process dependent and should be analyzed specifically for each application. A big part of the technological research is aimed at increasing efficiency of the conversion process via minimizing losses.
Example 1

A typical incandescent light bulb outputs both light and heat. If you ever touched the working light bulb with a bare hand, you know that there is a good amount of heat generated in this kind of energy conversion.
If I use the bulb to lit my dining area, the useful energy I collect is obviously light, or radiant energy, and efficiency of the conversion process would be defined as:
Efficiency = (Light Output / Electricity Input) x 100%
But if I use the bulb to warm my home incubator (with eggs waiting to hatch), the useful energy in this case would be heat. And the generated light would be in fact unnecessary, that is not useful output. In this case the efficiency of the conversion process can be defined as:
Efficiency = (Heat Output / Electricity Input) x 100%
Here we can see that efficiency is often defined in the eye of the beholder.
By the way, the efficiency of the incandescent bulb in the first case is much lower than in the second. Conversion to light is on the average 2.2% efficient, while the rest of input energy (97.8%) goes into heat.
Example 2

As another illustration of how this concept works, let us estimate the efficiency of a photovoltaic panel. Photovoltaic technology converts visible solar radiation (energy-in) into electric power (energy-out). So, for this estimation, we need to know or measure these two quantities.
Let us assume that the efficiency is measured in the middle of a sunny day, and the panel is installed perpendicular to the incident rays. Under those conditions, the typical incident radiation flux is ~1000 W/m2. We can take this number as the measure of energy-in per unit of time.
Now, let us assume that the panel outputs the power density 120 W/m2. Usually, this value can be obtained by measuring the voltage and current density of the panel (power = voltage x current).
Then, the efficiency value can be calculated as follows:
Efficiency = Eout(useful)/Ein × 100% = 120 W/m2 / 1000 W/m2 × 100% = 12%
This value means that 88% of total solar energy reaching the panel is lost, and only 12% is converted to electricity due to technology limitations or environmental factors. Just FYI, the nominal efficiency of most solar panels on market ranges between 15 and 22% (under ideal conditions). As you can see, efficiency estimations require data on technical performance of the system, so we will be paying attention to how performance of different technologies can be measured and interpreted.
Table 2.1 lists some known efficiencies of various energy technologies for comparison. These are just a few examples to demonstrate the variety of converters. We should note that generally efficiency of a process or technology is not necessarily measured in terms of energy. If the useful output of the converting technology is, for example, some form of matter (e.g., water electrolyzer in this table), the calculation can be made in terms of mass. Sometimes, efficiency analysis is also used to estimate the maximum theoretical efficiency, which cannot be practically exceeded due to inherent physicochemical limitation of the system. Finding maximum theoretical efficiency requires detailed knowledge of how the process works and what unavoidable losses occur in conversion.
| Process or Technology | Input | Useful Output | Conversion efficiency |
|---|---|---|---|
| Gas turbine | Gas flow | Electricity | 40% |
| Water turbine | Water flow | Electricity | 90% |
| Solar cell | Light | Electricity | 15-40% |
| Fuel cell | H2(gas), O2(gas) | Electricity | up to 85% |
| Water electrolyzer | Electricity | H2(gas), O2(gas) | 50-70% |
| Combustion engine | Fuel (gasoline) | Motion (kinetic energy) | 10-50% |
| Geothermal electric plant | Heat | Electricity | 10-23% |
| Solar thermoelectric generator | Sun radiation | Electricity | 15% |
| Electric motor | Electricity | Motion (kenetic energy) | 30-90% |
| Electric heater | Electricity | Heat | up to 100% |
| Refrigerator | Electricity | Negative heat | 20-40% |
| Fluorescent lamp | Electricity | Light | 8-15% |
| Photosynthesis | Light | Biomass, O2(gas) | 3-6% |
| Muscle | Metabolic energy | Kinetic energy | 18-25% |
Probing Question
Can energy conversion efficiency be more than 100%? Click on answer below.
YES
NO
Yes, but only in an ideal zero-loss system
Probing Question
Can you calculate the efficiency of an electric motor that consumes 150 W of electrical power and produces 120 W of mechanical power? Click on answer below.
8%
65%
80%
125%
Technology Adaptation
To become part of society life, technology needs to be adapted. Not all technologies invented go through successful adaptation, and there are several critical barriers that need to be overcome in order to create a working interface between technology and society.
Consider the following stages of technology adaptation:
- Technical Adaptation. Research and development, design, and demonstration. (yellow)
- Adaptation to the natural environment: matter and energy exchange, use of resources, and absorption of the impact (green).
- Adaptation to the technical environment: development of infrastructure and supporting technologies (brown).
- Market Adaptation. Development of economic algorithm. Proof of profit and long-term feasibility (peach).
- Social Adaptation. Acceptance by target society groups, based on ethical, environmental, cultural, and economic considerations (blue).
The first three stages of adaptation can be reflected in more detail through the Technology Readiness Level scale (TRL) on page 2.2 of this lesson. The fourth stage of adaptation is closely related to economic assessment, which should answer the question if the technology can support itself and make a profit in the short term or in the long term. Finally, the fifth stage of adaptation includes multiple social factors - how ready consumers are to accept this new technology, and what socal benefits it promises (for example, higher standard of living, job creation, convenience, faster service, improved health, etc.). The sustainability analysis should be comprehensive enough to cover all of these layers of adaptation and recognize connections and feedbacks between them.
2.2 Technology readiness levels (TRL)
Technology readiness assessment is a systematic, metrics-based process that evaluates the maturity of, and the risk associated with, critical technologies under development. It is a commonly accepted approach used in a number of industry and government organizations to assess the maturity of a technology (e.g., device, material, component, process, etc.) on an entire scale - from its invention to commercialization and wide-scale application. TRL rating actually determines how far a particular technology is from being deployed by industry or public. That, in turn, determines the amount of resources - time, funds, intellectual potential, facilities, etc., - necessary to bring this technology to life. We can illustrate the term 'readiness' with a simple example like the one below.
Example
For example, I am a researcher at a National Lab working on a small-size methanol fuel cell - a device that can convert the chemical energy of the fuel (methanol in this case) to electricity. I have my fuel cell stack operating in the lab and producing some great data in terms of power density. “It really works!” – I think. But can I put that fuel cell stack on my bike and have a ride home? Well... not right away, at least. The fuel cell system, the way it is set up and operates in the lab, is not ready for immediate use on a bike. I can possibly spend a few more months to work on the adaptation – fixing the fuel cell system on a bike, attaching an electric motor that would transfer the electrical power from the cell stack to the wheel, finding the regulators that would allow me to control the output during a ride, figuring out the position of the methanol fuel source and lines connecting it to the cell… it is quite an engineering project.
But let us imagine that finally I make it work! But can I offer this technology to bikers around town? I used my special knowledge to make all the technical adaptations and to solve multiple challenges, fixing shortcomings. If something is wrong, I know where to find a problem. But a general biker would not like to do all the work I have done and learn all the details I have learned. They would like it simple and fool-proof. I think, the technology, again, is not ready for public yet at that point. And, again, more resources and time are needed to make it user-friendly and more reliable for marketing.
Addendum: I worked on the methanol fuel cell systems in 2001. Years after some companies (Yamaha is one of them) actually managed to create some slick prototypes of fuel cell scooters, like the one shown here [28]. However, it is unclear if any of those made it to the market. If you find any information or references to it, please let me know!
There are many other examples of technology going through many years of adaptation prior to reaching its broad applicability. What you see in the left-side image below may seem like a hardly recognizable mechanical device. What is on the right side is its contemporary version. The first computer mouse prototype was invented in 1964 by Douglas Engelbart of Stanford Research Institute. The mouse device remained an subject for further development, modifications, demos, and pilot projects for two decades before it was finally adapted for broader use with the personal computer Mackintosh 128K in 1984 (Wikipedia [29])

How do we evaluate the maturity or readiness of a particular technology?
Technology Readiness Level (TRL) scale was first employed by NASA in 1974 to evaluate the maturity of technologies for spacecraft design as part of risk assessment. It was demonstrated that transition of emerging technologies at lesser degrees of maturity results in higher overall risk.
Later, the TRL scale developed by NASA was also adopted in the U.S. by the Department of Defense (DOD), Department of Energy (DOE), Air Force, Oil and Gas Industry and also in Europe by the European Space Agency (ESA). The main rankings in the TRL method for technology readiness assessment are classified in the table below.
| Stage of Development | Technology Readiness Level | Description | Outcomes/Supporting Information |
|---|---|---|---|
| Basic technology research | TRL0 | Unproven idea | No analysis/testing performed. |
| TRL1 |
Basic Principles observed and reported Scientific research begins to be translated into applied research and development. |
Published research that identified the principles that underlie the concept. | |
| Research to prove feasibility | TRL2 |
Concept formulated Practical application is invented based on TRL 1. Potential of the applications is speculative and is inferred from general assumptions or some analytical data. |
Published research that outlines the application and initial analysis of underlying principles. |
| TRL3 |
Proof-of-concept Analytical and experimental studies are performed on a lab scale to validate analytical predictions. Work is done on various components of the potential technology (which are not yet integrated). |
Experimental data, measured parameters of interest in comparison with analytical predictions. | |
| TRL4 |
Lab-scale demonstration (“low fidelity”) Basic technological components are integrated to establish that they will work together. This is relatively “low fidelity” compared with the eventual system. |
Results of laboratory testing. Comparison with system performance goals. | |
| Technology demonstration | |||
| TRL5 |
Lab-scale demonstration (“high fidelity”) The basic technological components are integrated with reasonably realistic supporting elements so they can be tested in a simulated environment. |
Results of laboratory testing in simulated environment. Identified barriers for target performance goals and plans to overcome them. | |
| System development | TRL6 |
Prototype system designed The system is integrated with support elements, and model design is created to be tested in simulated or operational environment. |
Results of the prototype testing in simulated lab environment. Data are close to target expectations. |
| TRL7 |
Prototype system tested in operational environment Prototype near or at planned operational system. Represents a major step up from TRL 6 by requiring demonstration of an actual system prototype in an operational environment (e.g., in the field, on aircraft, in a vehicle, or in space). |
Results of the prototype testing in operational environment demonstrate success. | |
| System launch and operation | TRL8 |
Actual system completed The system is qualified through test and demonstration. Technology has been proven to work in its final form and under expected conditions. |
Results of testing in its final configuration. Assessment of it meeting its operational requirements. Plans, options, or actions to tune and finalize the design. |
| TRL9 |
Actual system proved successful Actual application of the technology in its final form and under mission conditions or on market. |
Reports on real application performance. |
TRL approach proved to be useful as a tool for:
- general understanding of technology status;
- risk assessment and management;
- decision making with respect to technology funding;
- decision making with respect to technology transfer.
In the context of this course, it will be important to understand the technology readiness levels in order to properly assess the timeline and cost of its development and implementation. When applied to a particular technology, the above listed TRL ranks should be customized for better relevance. Such customization would identify specific milestones as criteria to advance to the next level.
Watch This!
Please watch this 15 minutes and 47 seconds video in which Dr. Sean McCarthy (Hyperion Ltd) elaborates on the TRL concept, provides some examples, and examines the ties of TRL assessment to the decision making and choosing partners for a project. This video is made in the context of the european innovation and technology implementation landscape, but many of those insights are completely transferable to the US soil as well.
In this module, we're going to look at the concept of technology readiness level. And at the bottom of the first slide, you can see a web link that we've made. so any of the links I mentioned in the presentation you'll find them on this particular webpage. So,first of all, I want to look at just a quick overview of technology readiness level to see what it is. Then I want to talk about technology readiness level in Horizon 2020 and how technology readiness level can be used when you're selecting partners for the project. And finally, in the impact section of your proposal, you'll see me repeating the use of TRL so I just introduced the concept of TRL an impact here.
Now, the organization called EARTO has written an excellent report on technology readiness level. EARTO is an organization representing over 350 of the top research and technology organizations in Europe and you can see their website on this webpage. Now the concept of technology readiness level originated in 1977 and the aerospace industry introduced it as a way of expressing the level at which technology was evolving. So, there are nine levels to it which I'm going to explain in the following slides. In the eighties, it was then adopted by the Aeronautics industry and then other industries like electronics and pharmaceutical industry started to adapt it for their own needs and today most industries use it. So, the concept of TRL is not a European Commission concept. It's concept of industry but it has now been brought into Horizon 2020 and we look at in module two.
Now, the concept of TRL one, which is the basic principles are observed, so this is obviously the whole territory of basic scientists where's TRL nine means the product is ready to go on the market. So, in this presentation I’m going to use a computer mouse as an example of how you know how TRL can explain the evolution of the computer mouse. So initially the concept, somebody had this concept, that you can you move an icon across the computer screen and the technology concept was formulated. Somebody tried to decide how it will be done so this is TRL two. TRL three is laboratory experimentation, and you expect an experiment with many many different concepts, and you look at different concepts and you prove them but TRL four means it's working at laboratory level. So, let's have a look at TRL four mouse. So here is the official photograph of the first mouse. You can see it's made of wood. It's probably very heavy and probably if you move that, an item moved across the screen so it was pretty fundamental you couldn't sell this thing. And the 1984, I found this quotation that one of the top computer people in America said, that they didn't think that this will have much of the future. Now TRL five is where the technology is validated in a relevant environment, so it's tested but it's not power to the environment. TRL 6, it means it's demonstrated in a relevant environment, again it's not part of the system but it's being demonstrated. Now here in TRL seven it's demonstrated, and the key word here is in an operational environment, so it goes into a real system. Now in TRL 8, it means the system is working and the new component is integrated into the system. So, it's completed and here you could be looking at meeting standards meeting regulations and so on. And, in the TRL nine, the product is on the market. So, Logitech, which is one of the biggest producers of the mouse and it's said in their website that they've shipped over 500 million mice and that only represents about half of all the mice shipped over the last 20 years. So, it's an example of how technologies evolve.
Now, if you look at the pharmaceutical industry, that whole chain could be twenty years. If you look at the software industry, that chain could be 18 months. In energy, it might be 78 years from initial concept to having something on the market and, it varies between technologies, so TRL 1 to TRL 9 is a way of expressing the level at which your technology is at any moment. Now, this slide shows the more common terminology where basic research, laboratory research, technology research, technology demonstration, so those terms are sometimes used, and it just puts them in the position of the TRL table. Now, if we also look at the biotechnology sector and on the art or document, they discuss this comparison. So, you can see that phase one trials is about TRL 5 6. Phase two trials is TRL 7 and so on. Now, in Horizon 2020, they've adopted TRL as a way of expressing and where a folding scheme is focusing and what they've actually published is a general annex and annex G of the general annex on the participant portal contains the definition of the TRL and it is actually in the definition I have used in the previous section of the presentation and section one. Now, here's an example of a topic in column number one of Horizon 2020. So, we can see here it's NMP 1 2014 and we can see here that implementation of the proposed is intended to start at TRL 4 and target here at TRL 6. So, it means that the funding is focusing on projects that operate in this area. So, it's not funding basic science. It's not from the close to the market and it's telling the scientists so we're looking at technologies that have been developed in the laboratory. We want to focus on demonstration prototyping and so on. Of course, if you look at another program the transport program under aviation, and we can see the Caesar joint undertaking is focusing on TRL from one to six. That means in their ethics part of the program they've got from basic research basic concepts right up to demonstration and prototyping and so on. So, that's how would you see TRL appearing and TRL is mainly mentioned in pillar 2 which is industry leadership. Now on pillar three, which is societal challenges, they don't mention TRL too often but you have to use the same concepts when you're explaining and what lived in your project is focusing.
Now let's look at this diagram again. This zone, let's call it, these TRL's are referred to as the value of debt now academic researchers don't like TRL 5 6 & 7 basically because there's no publications in either. Industry doesn't like 5 6 & 7 because it's very expensive and it's very very risky. Now framework 7 the previous European program came to about TRL 4. But horizon 2020 is going to TRL 7. So, that's why Horizon 2020 is called a research and innovation program. Now there's a problem with their funding schemes. When national and European bodies are designing funding programs, they have to take into account that are called European competition law and international state aid rules. Basically, what they say is that the Irish government cannot fund a company to make it more competitive than a German company or an American company. So, these are very very strict rules. So, when funding bodies are designing their programs, they are restricted by competition law and stated rules to focus on approximately up to TRL 7. So that's why if Horizon 2020 is called a pre-competitive research program. So, let's look at the different programs in horizon 2020 and see where they're actually located. Now national funding goes from TRL 1 from the basic science up to demonstration and prototyping and programs like Eurostar's which is for research intensive companies bringing things close as close up in the market. That's about TRL four, five, and six. ERC phones frontier our basic research and that's roughly TRL 1 going into TRL 2. Fed future and emerging technologies is roughly TRL 2. Now, pillar two and pillar three stretch from TRL 2 up to about the end of TRL 6. Now, public-private partnerships, this is where European, national, and private funding is put on the table. Now, when your private funding put on the table, that means you can go further than the competition losses because industry is putting money on the table. but you can see the public-private partnerships are focusing on TRL 5 plus. Marie Curie fellowships they fund postdoctoral research but they also fund things like industrial PhD’s, the rise program for staff exchange between academia and industry. So, some of them are equally programs are focusing on the development of skills for people dealing with industry.
EIT, European Institute of Innovation and Technology is trying to position itself across the valley of death and accessing finance is about funding high-growth companies at TRL 6 plus. It's also used for other applications but, in the case of enterprises, it's for funding this part of the program. So, you can see here, how all the different programs and how they're related. Now, as you go towards TRL one, the main evaluation criteria becomes excellent scientific excellence. As you move in the direction of TRL four five six, the main evaluation criteria becomes impact. So, if you're at TRL, say, 2 to 4, then you have to consider both excellence and impact. Now, the different grants in Horizon 2020 address different parts of the TRL chain. The ERC grants of course are forming the ERC program. Now, in such an innovation actions, these grants cover from about TRL 2 to about the end of TRL 4 or early TRL 5. innovation actions are focusing, and demonstration prototyping living labs and they normally cover about TRL five, six, and seven. The SME instrument is mainly TRL 5 plus. So, it's looking at bringing technologies closer and closer to the market and the new type of grant fast-track to innovation is also focusing on TRL 5 plus. The public procurement, this is where public bodies demand innovation or research, that's actually getting closer at to the market. Now, coordination and support actions, these fund studies therefore networks and if cover the full range of TRL 1 to TRL 9 but it's mainly studies dealing with these particular areas.
Now, let's see how a TRL can be used when you're selecting partners for your project. The universities and research centers public research centers normally operate in the range of TRL 1 to TRL 4. Some of the research centers like Max Planck in Germany they would be operating at TRL 1 and 2. A lot of universities, you know, might be more basic research, which are TRL 1 and 2, where some research centers would be at TRL 3 or 4, but generally the public research centers are in this range. Research and technology organizations operate from about TRL 4, you know, up to TRL 7. and again, this is where EARTO, the European Association of research and Technology Organization tries to operate. So, it's getting closer to the market so it's working with universities and research centers but doing things that are more relevant to the needs of Industry. Research intensive companies now these could be big companies fairly large companies that have research departments, or they could be spin-off companies from research centers where, you know, highly qualified researchers set up their own company. They can bring results, you know, from TRL 5 onwards. Whereas, high tech companies, these are is that like to have technologies verified demonstrated piloted, and again they are normally operate maybe around TRL 7 or 8. So, when you're selecting your partners, you can see that for TRL 1 & 2 we are seeing fit, it's more suited to universities. Whereas TRL 4 5 6 is more suitable to the research and technology organizations. Now impact. Impact is asking the question what is coming out of your project and who will use those results. Now, if you're looking at an ERC project, now this is fundamental research. So, if that's operating a TRL 1 then the people that are interested in those results is the scientific community. So, if you look at the evaluation of ERC, they talk about what is the research impact of the results.
Now, if you're operating in a research and innovation grant, which is operating TRL 2 to TRL 5, then obviously the people that are interested in these results are people operating at about TRL 6 and, in that case, it would be the research and technology organizations and research-intensive companies. However, if you're looking at things like innovation actions, which is at TRL 5 and 6, then the organization’s interested in these results would be high technology companies, standards organizations, and regulatory bodies. Now if you're looking at an SME instrument, then you're getting really close to the market and the lead users here would be the early adopters of new products, new services, and business models. So, when we look at the impact part of the proposal, you will see how we will use the TRL table and, I think what we've shown in this presentation is the concept of TRL is a very useful way of describing the programs, describing the grants, describing the role of the different partners, and describing the impact.
So, I hope you enjoyed the presentation and again you can look at this website. It's an open website and you can find all the links that I described in the presentation. So, thank you very much and I look forward to seeing you in the next in the next modules. Bye for now!
Assigning a TRL rank is not a quick task. These are some serious questions that need to be answered and backed by technical data regarding the current status of technology:
- Is technology widely commercialized?
- Is technology demonstrated in the final form (in a target system)?
- Is technology demonstration in the relevant environment (field conditions)?
- What is the target performance / efficiency level (technically and economically)?
- What is currently achieved performance / efficiency?
- What are the materials involved and what is their availability?
- Is infrastructure available for deployment for this technology?
- What are the main barriers impeding the higher performance? … etc.
You can see that determining the status of technology development often requires search and knowledge of most recent advances, publications, and news releases on the technical performance, demonstration, pilot systems, and prototypes. It also requires independent expertise in subject matter along with understanding the economic criteria, which establish a threshold where the technology becomes economically feasible and is able to compete with existing alternatives.
What kind of data sources can you use for TRL analysis?
- Scientific publications in refereed journals
- Government agency reports
- Company news releases (may withhold technical details that are proprietary)
- Public news, web blogs, ads (secondary sources which may refer you to original information)
- Personal communications with experts, researchers, and entrepreneurs
Try this tool!
Check out the TRL calculation tool developed by the Advanced Energy Technology Group at University of California San Diego, which can be used to automatically retrieve the TRL value for a particular project based on input scoring on each level criteria. The calculator is in the form of MS Excel file, and you need to enable macros to make it work - it is included in Module 2 in Canvas. You are welcome to explore it and use it in your course project when determining TRL for the technology of your choice.
I hope you found content on this page useful. Different assignments in this course will tap into the TRL concept repeatedly, and you will be asked to either estimate the TRL ranking or provide some analysis of technology readiness and maturity in your course project.
Answer this self-check question:
An R&D group in a company developed the design and built a prototype of a new car engine. It has been through a set of comprehensive lab tests, which provide excellent results in terms of system performance. What technology readiness level can be assigned to this development? Click on your answer below.
TRL 2
TRL 4
TRL 6
TRL 8
TRL 10
Additional Resources on Technology Readiness Levels:
- NASA, Technology Readiness Levels Demystified, 2010, URL: https://www.nasa.gov/topics/aeronautics/features/trl_demystified.html [35]
- Disruptive Innovation, Technology Readiness Level (TRL) - Innovation Management, 2016, Youtube Video URL: https://www.youtube.com/watch?v=in4TnQZGYj4 [36]
2.3 Emerging, converging, disruptive technologies
2.3 Emerging, converging, disruptive technologies
Emerging technologies are technical innovations that breach new territory in a particular field. Over centuries, innovative technologies were developed and opened up new avenues for lifestyle and market transformation. Implementation of an emerging technology involves economic risk, but, if successful, offers a competitive advantage to a company. Some of the emerging technologies are developed via theoretical research, while others are based on commercial research and development.
Often emerging technologies are at the TRL levels 1-5 and require significant research, investment, and marketing to bring them to the commercial stage.
Here are some examples of emerging technologies at various stages of their development. [37]
The following websites post news on emerging technologies and ideas. Check these out - there are a lot of exciting examples of how technological innovations enter society. You may find these resources useful for picking examples for your studies in this course (I keep adding to this list every year:):
- Top emerging technologies for 2013 [38]
- Top emerging technologies for 2014 [39]
- Top emerging technologies for 2015 [40]
- Top emerging technologies for 2016 [41]
- Top emerging technologies for 2017 [42]
- Top emerging technologies for 2018 [43]
- Top emerging technologies for 2019 [44]
- Top emerging technologies for 2020 [45]
- Top emerging technologies for 2021 [46]
- Top emerging technologies for 2022 [47]
- Top emerging technologies for 2023 [48]
Converging technologies develop from the convergence of different systems evolving towards similar goals. Convergence can refer to previously separate technologies, which create new efficiencies when combined together.
Some examples of technological convergence can be the blend of the mobile telephone and the Internet, design of hybrid vehicles, combination of movie and game industry, combination of nano- and macro-scale science in biology, agriculture, and material design, online education…
Unlike emerging technologies, converging technologies are not necessarily based on technical breakthroughs, but rather involve already developed and commercialized technologies to achieve a new level of performance, human ability, societal outcomes, the nation’s productivity, and the quality of life.
Disruptive technologies are innovations that help create new markets and eventually go on to disrupt an existing market and value networks, displacing an earlier technology. This term, coined by Harvard Business School professor Clayton M. Christensen, is often used in business and technology literature to describe innovations that improve a product or service in ways that the market does not expect.

For example, the automobile was a revolutionary technological innovation, but it was not a disruptive innovation, because early automobiles were expensive luxury items that did not disrupt the market for horse-drawn vehicles. The market for transportation essentially remained intact until the debut of the lower-priced Ford Model T in 1908. The mass-production of automobiles was a disruptive innovation because it changed the transportation market.
Check out this "Disruptive innovation" Wikipedia page [49] which contains a list of some well-known examples of disruptive technologies. Many of these disruptions occurred within the past couple of decades, and we can relate to them. Disruptive innovations can change the way people live and work, re-arrange the values in markets, and lead to the creation of entirely new products and services. "The discovery and identification of disruptive technologies require the researcher to think like an innovator and entrepreneur in order to take full advantage of an “epiphany” moment, i.e., a moment in which you suddenly understand something in a new and potentially life-changing way. Such a moment, if properly acted upon, can accelerate your career toward recognition and long-term research funding." (KSRS, 2014)
Watch this:
The screen that you want to apply about technology is not what technologies are interesting, because there are so many that are interesting. You want to look at which ones have a chance of having a volume impact on many, many people, or large segments of the society. We’re going, in a single lifetime, from a small elite having access to information to essentially everyone in the world having access to all the world’s information. That has huge implications for privacy, communications, security, the way people behave, the way information is spread, censorship, how governments behave, and so forth. That’s the primary narrative, I think, today. It changes education. It changes the way intellectual property works, it changes the way businesses work, it changes the way the media works, on and on and on. We’re in the middle of that right now. The one that comes next is undoubtedly biology, that the same tools and techniques for combinatoric calculations, the kind of computer use, analytically, that we do today, when applied to biological systems, has an even greater impact. As we begin to say, “We’re going to take the analog world of biology—how genes work, how diseases work—put them in a digital framework, calculate for a while, do some machine learning on how things happen,” we’ll be able to not only help you become a better human being, but predict what’s going to happen to you physically in terms of your health, and so forth. Everything that we can do to build a model of how biology works, and in particular, how the human brain works, how DNA works, how protein folding works, these sorts of things, is a serious step change for humanity. So, all of the grand challenges, you know, the sequencing of the human genome. There are now firms and foundations building databases of DNA to use, to move to a model of individual diagnosis of disease; literally, you just press a button, the sequences occur, and we tell you what’s wrong. So, the use of analytical tools in a historically analog world is a very big change.
Materials and manufacturing: What’s happened in technology is that a new set of ultra-powerful, ultralight, ultra-conductive materials can now be manufactured at scale. And there’s a revolution, largely driven by a set of universities, around new kinds of these manufacturing services that will change everything. So that revolution, plus the arrival of three-dimensional printing, where you can essentially build your own thing, means that—during the rest of our lifetimes, anyway—it’ll be possible to build very interesting things from very interesting, new materials, which have all sorts of new properties. We already know that there’s a whole hobbyist area around buying these 3-D printers for plastic. Well, if you can get these new materials, you could put them in the printers, and then over time those printers will become capable of machining, mining, and producing these materials.
My computer, my friend: It’s certainly true that much of what we call innovation today is essentially routine, or evolutionary innovation. Cloud computing has been around for a long time, right? And it’s getting better, and better, and better. After all, cloud computing is just mainframe computing in a different way, which is how I learned how to compute when I was a young boy. So the fact of the matter is these ideas have been around for a long time. Is that going to change the world? It certainly makes it better, but it’s another step in the evolution of computer architecture. There’s a new generation of user-interface theory that says there should not be a user interface; the information should just be around you. We have a product called Google Now, which is available on Android1, which actually attempts (by watching what you’re doing, and with your permission, and so forth) to make some suggestions. So, it’s now figured out roughly where I live, and roughly where I work. And it tells me how long it takes me to get back and forth to work. Sort of useful. I didn’t ask it to do that. It figured out that I was going back and forth every day, and it said, “Oh, there’s a traffic jam,” and so forth. Now what are the limits of that technology? That’s an artificial-intelligence question. But it’s highly useful for it to have made a suggestion that would be good. So, I think we’re going to go from the sort of command-and-control interfaces where you tell the computer, like a dog, “Bark,” instead the computer becomes much more of a friend. And, a friend in the sense that the computer says, “Well, we kind of know what you care about.” And again, you’ve given it permission to do this. And it says, “Well, maybe you should do this,” or, “Maybe you should do that.” And the ultimate model is that the computer does what it does well, which is these complicated, analytical needle-in-a-haystack problems, and has perfect memory. And humans do what we do well, which is judgment, and having fun, and thinking about things. The relationship is symbiotic. The computer is making suggestions that are pretty good, they’re pretty helpful, but you’re ultimately in charge. 1(Since the date of this interview, Google Now has become available on iOS devices through the Google Search app. )
Man vs. machine: The race that’s not being followed in the media is the race between humans and automation. And this race is run every day, and it’s a very tough race. So, when I go to the local convenience store, they’ve replaced a low-wage worker with a machine to do my checkout. And that machine costs a great deal of money. And I’m sure it was a good business decision for them. So, what happened to that low-wage worker? Well, their low wages probably did not go up. They might have even gone down. Maybe they’re on part of government assistance. So, what’s the solution for that low-wage worker? Better education. So, in the race against automation, which is the race we’re winning, and which politicians never articulate, the answer is better education. Now, there are some other answers as well. For example, immigration of high-skilled workers; rather, we don’t have to educate everybody in America. We can also get a few educated people from other countries, and they’ll help us out, because they’ll hire all these other people here in America. And again, people are slowly beginning to understand that, in any particular country, you want an unfair share of highly educated people—in all industries, by the way—because in the race, they’re the winners.
Probing question
Which of the following technologies would you consider examples of disruptive technology over the recent decades? (Check all that apply.)
Click for answer.
Technologies (a), (e), and (h) have been disruptive to the markets mentioned in parentheses.
Technologies (d), (g), and (i) have been in fact sustaining since they did not upset, but rather developed respective markets to new values.
Technologies (b), (c), and (f) may have a future potential to be disruptive, but did not reach that level of readiness yet, i.e., existing markets are stronger.
Sustaining technology. As opposed to disruptive technology, sustaining technology relies on incremental improvements and innovations to an already established technology. Sustaining innovations or technologies do not create new markets but rather evolve existing ones with a better value, allowing the firms to compete against each other's sustaining improvements. Sustaining innovations may be discontinuous (i.e., transformational) or continuous (i.e., evolutionary).
Here, we also need to acknowledge the hierarchy of technologies. As we defined it above, technology is a human-designed system with a conversion function. At the same time, smaller parts of that system can be also considered technologies, and those can be represented as assemblies of even smaller components (sub-technologies). For example, a car may be considered a technology within a transportation system. However, smaller components within the car, such as the internal combustion engine, tire design, air conditioning, navigation, etc., are also technologies in principle. Should those be separately evaluated?
Our criterion for what level technology in this hierarchy we take for assessment is the role of the technology as a functioning element of the whole system. Our assessment targets are the systems (technologies) that can have a potentially disruptive impact on a bigger system, especially in the social and economic context. This is because progress towards sustainable development requires disruptions and seeks a shift in the existing paradigm. If technology is too subordinate to be responsible for disruption in a social and economic context, it’d be rather considered as a technical element supporting the main key technology.
Supplemental Reading
Book: Lucas, H.C. Jr., The Search for Survival: Lessons from Disruptive Technologies, Santa Barbara, CA., Praeger, 2012.
This book provides a comprehensive insight into technology development in present-day society. It is not required reading, but may be an interesting source if you have a particular interest in this topic.
Book: Johansson, F., The Click Moment: Seizing Opportunity in an Unpredictable World, Penguin US 2012, ISBN 978-1-101-60140-2.
2.4. Life Cycle Assessment
2.4. Life Cycle Assessment Methodology
Life Cycle Assessment (LCA) is a "cradle-to-grave" approach for evaluating products, materials, processes, services, and industrial systems with respect to their environmental impacts. Cradle-to-grave process begins with the extracting of raw materials from the earth to manufacture a product and ends at the point when all materials are returned to the earth in some form. LCA looks at all the stages of the product’s life one by one, estimates various environmental impacts at each stage and, as a result, allows selecting the path or processes that are least impactful based on chosen metrics.
LCA studies help decision-makers select the product, process, or technology that would be "least evil" in terms of its environment footprint, however the final judgment and interpretation of the results always depends on the key metrics and criteria that are most important to specific stakeholders. In that sense, LCA objectives should be set early in the analysis to answer the questions relevant to a particular project or application. Classic LCA deals primarily with environmental impacts, but further can be used with other pieces of information, such as cost and performance data, to find optimal solutions.
Life Cycle Assessment Objectives:
-
Support informed decision making for government, industry, and businesses
-
Provide basis for fair comparison between products and alternatives
-
Support recommendations for improving design and lowering impacts
The diagram below illustrates the main lifecycle stages to be considered in LCA:
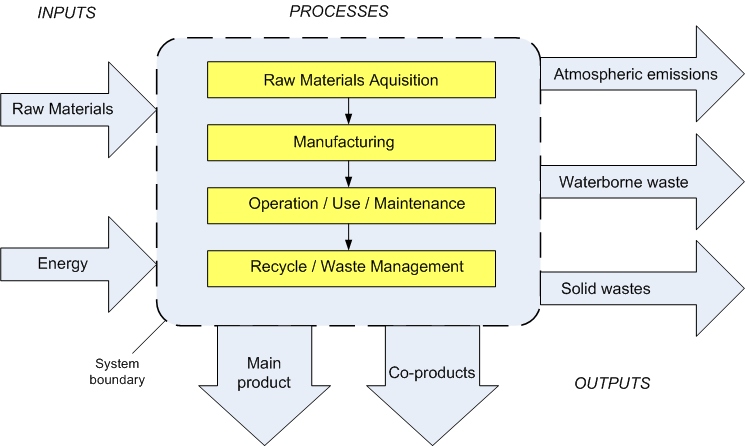
This diagram is based around a box-shaped system that includes four processes and is surrounded by a System Boundary. The four highlighted stages are:
- Raw Materials Acquisition
- Manufacturing
- Operation/Use/Maintenance
- Recycle/Waste Management
System Inputs are shown as arrows on the left of the system, outside the System Boundary. Inputs are represented by Raw Materials and Energy that flow into the system.
System Outputs shown as arrows on the right and at the bottom of the system, outside the System Boundary. Outputs are represented by Main Product and Co-Products (shown at the bottom), and Atmospheric Emissions, Waterborne Waste, and Solid Wastes (shown on the right).
As you can see in the diagram above, any product or technology would require input of some raw materials and energy at all stages: from acquisition to manufacturing, operation, and finally disposal. All of the mentioned lifecycle stages may produce atmospheric emissions, waterborne and solid wastes, simply because the efficiency of material use and energy conversion is always below 100% - there are losses and by-products, which sometimes can be highly undesirable. LCA helps to keep track of all useful and harmful outcomes, and the diagram in Figure 2.3 provides a guideline to LCA mapping.
Procedure for Life Cycle Assessment
A standard LCA study would consist of several key steps outlined below:
- Goal definition and scope: Identify a product / Set system boundaries / Develop LCA map and material flow chart.
- Inventory analysis: Collect data / Identify and quantify energy, water, and materials as inputs and emissions as outputs.
- Impact assessment: Set impact categories / Develop metrics / Perform calculations and comparative analysis.
- Data interpretation: Relate metrics to objectives / Quantify human and ecological effects / Deliver information to target audience / Issue recommendations
The standardized procedure for the LCA recommended for product and technology assessment in the U.S. is documented in the EPA guidelines referred below. Study this document carefully – some parts of this framework will be used as a basis for technology evaluation repeatedly in this course's assignments.
Reading Assignment:
US EPA Document: Life Cycle Assessment: Principles and Practice, EPA/600/R-06/060 [26], 2006.
This document provides a detailed guideline on how lifecycle assessment should be performed. This is a long document and contains a significant amount of information. While I would like you to look through the entire file, here are a few things that you may want to focus on:
- Certainly read through Chapter 1, where the basics of the LCA strategy are explained (pp. 1-7).
- In Chapters 2 and 3, try to mainly understand how the scope and flow diagrams are constructed for a particular project or product. The purpose of those diagrams is to present a big picture and list all the important elements of the life cycle before data analysis is started. Study the examples in Figures 2-1 and 3-2, as you will be asked to do something similar for this lesson assignment. You may scan quickly through the rest of these chapters.
- Chapter 4 on Impact Assessment is the core of the LCA. Read through entire chapter 4 (pp. 46-53). Take a note of the major environmental impacts that are usually considered in LCA. That will be an important piece of information when we explore different metrics in Lesson 3.
- You can quickly scan through Chapter 5, taking note of the main steps in LCA interpretation.
In this Lesson, we are going to do an exercise on LCA scoping for a simple product. That would only cover Stage 1 of the entire process. Still, it is a very important step that sets the ground for the entire analysis and provides directions for collecting data and developing metrics during the Inventory Analysis and Impact Assessment stages of the LCA. Please refer to the Canvas Module 2 for specific directions on this assignment.
Examples of LCA Projects
Website: Design Life-Cycle, University of California, Davis, Department of Design, URL: http://www.designlife-cycle.com/ [51] Accessed: May 2020.
This website presents a very versatile collection of LCA studies of consumer products, fashion, architecture, electronics, and other technologies. Studies are presented in the "nutshell" form and enhanced by infographics. Very fun resource to explore!
LCA Limitations
- LCA thoroughness and accuracy will depend on the availability of data; gathering of data can be problematic; hence a clear understanding of the uncertainty and assumptions is important.
- Classic LCA will not determine which product, process, or technology is the most cost-effective or top-performing; therefore, LCA needs to be combined with cost analysis, technical evaluation, and social metrics for comprehensive sustainability analysis.
- Unlike traditional risk assessment, LCA does not necessarily attempt to quantify any specific actual impacts. While seeking to establish a linkage between a system and potential impacts, LCA models are suitable for relative comparisons, but may be not sufficient for absolute predictions of risks.
Even for relatively small systems, LCA is a comprehensive task that requires interdisciplinary knowledge in the technical and economic areas. Hence, LCA projects are typically assigned to teams of experts and can rarely be performed by a single person with sufficient accuracy.
LCA approach has developed over decades, coming from a product-oriented model used to evaluate environmental impact to a bigger framework that elaborates on a wider environmental, economic, and social scale. At the current stage, LCA is being transformed into Life Cycle Sustainability Analysis (LCSA), which links the sustainability questions with the knowledge and research needed to address them. Check out the following article to learn more about the LCA history and background:
More Reading on LCA:
Journal article: J.B. Guinee et al., Life Cycle Assessment: Past, Present, and Future, Environ. Sci. Technol., 2011, 45, 90-96.
This article reviews the history and the most recent advances and trends in the life cycle assessment. It provides some good illustrations of method diversity, which can be both beneficial and challenging in terms of data interpretation and application. The article also exemplifies LCA being linked to policy development and decision making.
This reading is optional, but highly recommended in the context of this lesson. This article can be accessed online through the Penn State Library system database or via link in Canvas.
Summary & Activities
Lesson 2 Summary & Activities
In Lesson 2 we explored the definitions of technology and attempted to characterize its role in sustainability systems. We learned that before technology can become part of society, it has to be developed and pass through a few levels of adaptation. This process of adaptation is largely governed by social and economic factors, not simply by the technical benefits proved through research and science. Decision making as for to deploy or not to deploy a particular technology, on what scale, at which location and when, would rely on (1) technology readiness (which is determined through TRL analysis) and (2) on technology adaptation to the social, economic, and environmental spheres (which is assessed through the LCA analysis). Both types of assessments are complex, require a significant amount of factual data, and must be system-specific and location-specific. This lesson provides important background on both of the above-mentioned methodologies. The next step will be to choose metrics and to develop quantitative indicators for assessment.
| Type | Assignment Directions | Submit To |
|---|---|---|
| Reading | Complete all necessary reading assigned in this lesson. | |
| Discussion |
Define Technology. How would you define technology from your personal perspective? (What comes to your mind when you use this word?) How do you understand the expression "sustainable technology"? Provide some examples to your definition (~1 paragraph). Provide comment on at least one other post on the forum. Deadline for initial posting: this Sunday; post your comments to other threads by the end of this lesson Wednesday |
Canvas: Lesson 2 Discussion |
| Activity |
Activity 2 - Develop LCA scope for a particular product. You can use an object from the list or come up with your own choice. The goal of this exercise to apply lifecycle thinking to a simple product and map out all inputs and outputs and identify the potential environmental impacts of each lifecycle stage. You are advised to look up information on manufacturing and materials used in the product lifecycle, but you are not required to present any quantitative information. Please refer to Lesson 2 Activity Worksheet on Canvas for more details. Deadline: Wednesday (before midnight) |
Canvas: Lesson 2 Activity - LCA diagrams |
| Individual Course Project |
Become familiar with the Course Project assignments in EME 807 by looking through Lesson 12. Think of a topic that you would like to use for your Individual Course Project. The topic should focus on a particular technology of your choice, and it can be close to your professional area, or it can be a new topic you want to learn more about. You will use this technology or process for comprehensive evaluation using different concepts included in this course. Submit a brief description of the topic with an explanation why you chose it (please limit to 500 words) to the "Course Project - Topic Submission" in Canvas. Deadline: Wednesday (before midnight) |
Canvas: Course Project module |
Lesson 3: Metrics for Technology Evaluation
3.0 Overview
Overview
In this lesson, we take a step further in the evaluation of technologies from the standpoint of environmental, economic, and social compatibility. Building upon the life cycle assessment concepts presented in Lesson 2, we will learn how to develop or select the metrics that would allow us to quantify the impacts and to decide on viability of technology projects. Metrics are important analytical tools when it comes to objective decisions, but they are not something predefined and ready to use. Metrics are meaningfully designed and tuned for a particular purpose, and it is the job of the evaluator to define that purpose prior to the analysis. This lesson overviews some of the methods that are used in environmental science and economics for technology evaluation. However, we are only scratching the surface here. Those areas of science are quite extensive and can fill whole books. So, while working through the basics and studying examples, be prepared to search further and specialize when you chose the metric set for your final course project down the road.
Learning Objectives
By the end of this lesson, you should be able to:
- understand different levels of metrics and their connection with assessment goals;
- perform calculations of some environmental metrics / indicators and interpret their meaning;
- review the fundamentals of the economic analysis of technologies. Perform calculations of some economic metrics using simple payback and discounted cash flow approaches.
Required Readings
Journal article: Brown, M.T. and Ulgiati, S., Emergy-based indices and ratios to evaluate sustainability: monitoring economies and technology toward environmentally sound innovation, Ecological Engineering 9 (1997), 51-69.
Press release: National Renewable Energy Laboratory, Life Cycle Greenhouse Gas Emissions from Electricity Generation, NREL/FS-6A20-57187, January 2013.
Book chapter: Vanek, F.M. and Albright, L.D., Energy Systems Engineering. Evaluation and Implementation, McGraw Hill, 2008 –Chapter 3 Economic Tools for Energy Systems, pp. 62-75.
Questions?
If you have any questions while working through this Lesson, please post them to our Message Board forum in Canvas. You can use that space any time to chat about course topics or to ask questions. While you are there, please feel free to post your own responses if you are able to help out a classmate.
3.1. Purpose of metrics and how they are selected
3.1. Purpose of metrics and how they are selected
One of the challenges in sustainability assessment of technologies or other elements of anthropogenic systems is designing meaningful and quantifiable metrics. Because sustainability frameworks are built on very diverse sets of environmental and economic values, there is difficulty in bringing them to common terms within a unified model.
When we ask the question "Is this process sustainable?", we often do not get a "yes/no" answer. Some parts of the system may benefit sustainable development, some parts may be in conflict with it, and some parts may be rather neutral or flexible. But how can we tell where we are on the scale of sustainability assessment? Further, if we do alter certain parts of the system, how much shift do we create towards sustainability goals? Can we measure the impact of those changes?
All these questions prompted attempts to develop quantifiable metrics or indicators, which would allow researchers and policy makers to make more accurate comparisons between different paths of system development and take better justified decisions.
The existing methods for evaluating products and technologies in terms of environmental impact and sustainable development are numerous, and the scope of their applications and purposes is extremely wide. Metrics have been and continue to be developed by different agencies, companies, and researchers to address a variety of issues, which were often placed in different frameworks. As a result, those methods of assessment may use widely diverging rationale, terminology, and approaches, and often come up with contrasting results. Consistency and compatibility are most difficult issues!
In this lesson, it would be hardly possible to learn all of the methods in detail, especially because most models and evaluation approaches are subject-specific and would rather be learned in the context of a particular technology. But we will take a tour over several evaluation platforms and will try to distill the most important questions to address as we proceed to characterization of particular technological areas in further lessons of this course.
Numerous technologies existing in the world differ in many aspects (e.g., profitability, social popularity, efficiency, scale, local need, resource consumption, etc.). However, our main goal will be to distinguish and characterize the technologies in terms of sustainable development. In the long run, the main question we aim to answer: Is the technology project sustainable or not sustainable? What are the criteria for "good" and "evil" here?
How are metrics developed?
What exactly is a metric? A metric is a system of measurement that includes:
- the item being measured (what we measure),
- the method of measurement (how we measure), and
- the inherent value associated with the metric (why we measure, or what we intend to achieve by this measurement).
According to Werner and Souder [Werner and Souder, Research-Technology Management, 40(2), 1997, 34-42], the choice of an appropriate measurement metric depends on the user’s needs and purpose, the area of study, and the available data. Setting the purpose of evaluation is the key. Without it, the metrics are simply data. There should be a decision focus.
Metrics should help answer a question, and the answer in turn would justify the recommendation for future action.
Metrics are categorized into quantitative-subjective, qualitative, and integrated metrics. The type is often determined by the availability and accuracy of raw data. Data must be accessible and affordable; otherwise, assumptions and surrogate information would inevitably undermine the adequacy and validity of assessment.
Standardization and coherence in rules of construction of technology evaluation metrics are yet to be achieved. In the broad area of science and technology, the practice of creating and using metrics is in the form of a "menu." Evaluators select combination of measures, data sources, and instruments that will address their specific objectives and needs.
The following issues make metrics not a straightforward matter:
- A metric may be composed of a single quantity or by a more complex set of measures (for example, indexes and "macro" metrics).
- Metrics in science and technology evaluation are designed to measure a variety of activities, events, and phenomena—some simple and short-lived, others highly complex and durable along an extended time frame and therefore using different units and scales.
- The absence of a unique and single building-block increases the role of subjective reasons for the construction and selection of metrics, which sometimes requires better formalization.
Designing comprehensive universal metrics, which would work as "magic crystal" for decision makers, is difficult, if at all possible, because different stakeholders care about different impacts. Most analytical approaches separate contexts and rather develop multi-metric frameworks for assessment. The table below lists some examples of metrics used for technology evaluation in various contexts. This list is not exhaustive, by any means, and in each assessment project metrics must be justified and modified for specific research purpose.
| Social | Environmental | Economic |
|---|---|---|
|
|
|
[Source: National Renewable Energy Laboratory]
While working on this course, you should feel free to modify existing metrics or create new ones for the specific needs of your assessment. There are no "mandatory" criteria for evaluation - it all depends on the purpose and the message you try to deliver.
Lagging versus leading metrics
- Lagging metrics are those that indicate what has already happened (past). For example:
- amount of soil eroded
- electricity cost per kWh
- average annual temperature
- battery efficiency measured
- Leading metrics are those that indicate what may happen (future). For example:
- deforestation rate
- input / output ratio
- wind direction and speed
- Lagging metrics are mainly actual measures; leading metrics are usually indicators marking rates or trends
Complexity levels of metrics
(In parentheses, some examples of metrics are given for the case of a wastewater treatment facility.)
- Level 1 – Measure a technology’s level of compliance with regulations or its conformance with industrial performance standards (e.g., output concentration of hazardous chemicals versus EPA tolerance standards).
- Level 2 – Measure the inputs, outputs, and performance of a technology during system operation (e.g., cost of purified water per gallon, amount of solid waste generated per year, treatment efficiency).
- Level 3 – Evaluate the potential impact of the technology and associated operation on facility personnel, the surrounding environment, and communities (e.g., eutrophication, local air quality trends, carbon emission cost of facility operation).
- Level 4 – Evaluate the lifecycle effects of the technology. This will involve Level 1-3 metrics as necessary to assess the impact of technology’s manufacturing, operation, and disassembly stages (e.g., amounts of raw materials consumed for building the facility, % carbon emissions related to transportation and infrastructure maintenance, water filter life and disposal).
- Level 5 – Assess how the technology-related activities affect the sustainability balance at the scale of society, region, or planet (if the technology is scaled-up) (e.g., % renewable materials or energy used at different stages of operation, community quality-of-life indicators).
In the above hierarchy, Levels 1 and 2 may be sufficient for understanding the promise of technical performance. These levels would be primary guides in relationships between research and development sector and industry, which look for reliable and efficient systems. Ecological perspective would involve Level 3 in order to understand and track environmental impacts. Furthermore, sustainability analysis would have to involve Level 4 at the community scale and Level 5 at the economy scale, since only via thorough lifecycle assessment and system analysis is it possible to identify the correct targets for metric design.
One of the ways to understand if the choice of metric that is adequate to the purpose is sensitivity analysis [52]. By varying impact factors, see how metrics respond. Simulating a series of "what-if" and "what-if-not" scenarios will lead you to designing a proper metric model and defining the boundaries.
Probing Question:
Which of the following metrics would be suitable for comparing firewood and coal as heating fuels in sustainability analysis? (Check all that apply.)
Click for answer.
All metrics (A) through (E) would need to be included in sustainability analysis. A is a characteristic of technical performance. B is a characteristic of environmental impact. C and E are parts of economic analysis, and D is a factor affecting society well-being.
Supplemental Reading:
Web article: Geisler, E., The metrics of technology evaluation: where we stand and where we should go from here [53], 24th Annual Technology Transfer Society Meeting, July 15-17, 1999.
This reading is optional. The article provides more discussion on challenges and purpose of technology evaluation. Also, it presents a wide pool of metrics that are relevant to different categories of assessment.
Sustainability Indicators
The framework of sustainability indicators deals with much wider context than just technology assessment. It was developed for assessing socio-ecologic development of communities and associated resources and services, and technology can be certainly part of that context. Applying this framework to technology, we can see how technical performance metrics (such as efficiency and useful output) are connected to the economic, social, and environmental specifics of the locale, thus allowing us to estimate the promise of this technology in a local setting.
Systems of sustainability indicators are typically customized to a particular case study. One of the rationales is to take a more detailed approach to assessing sustainability and move beyond the traditional three-pillar approach, which conventionally classifies factors within social, economic, and environmental domains. Indicators can go through those boundaries and address specific needs of assessment.
Good indicators must be:
- relevant to the problem or system considered in assessment;
- understandable and easily interpretable by stakeholders and societies that may use the assessment;
- reliable; i.e., based on trustworthy information and also sensitive to data variation;
- built on accessible information (not something that is hidden or will become available in the future).
Collection of data and information for calculating sustainability indicators may be a big task. While much of the data can be available in local, state, and federal reports, and many of those can be available online these days, in some cases, you would need to contact respective agencies and offices to request missing information depending on your specific interest.
One of the criticisms of sustainability metrics and indicators is that they attempt to encapsulate an array of diverse processes and interactions in a few simple measures. Is that simplification fair? And what is the risk of using those simplified measures for taking rational decisions?
In fact, designing metrics can be an obvious approach to deal with the complex world in manageable bits. It is common for scientists to deal with a complex system by breaking it down and studying its components separately before studying how they work together. For example, in natural sciences, scientists have been dealing with complex ecosystems for years, and specific indicators have been long used as tools for gauging ecosystem health and development (Bell and Morse, 2008).
According to Slobodkin (1994):
"Any simplification limits our capacity to draw conclusions, but this is by no means unique to ecology. Essentially, all science is the study of either very small bits of reality or simplified surrogates for complex whole systems. How we simplify can be critical. Careless simplification leads to misleading simplistic conclusions."
To learn more about sustainability indicators, please turn to the following readings:
Supplemental Reading:
Book: Bell, S and Morse, S. Sustainability Indicators. Measuring the Immeasurable? 2nd Ed.London, Sterling VA, 2008.
This book leads comprehensive discussion on the nature and purpose of sustainability indicators and presents a number of great examples of their application.
UN Report: Indicators of Sustainable Development: Guidelines and Methodologies [54], 2007. Third Edition.
EPA Report: Fiksel, J., Eason, T., Frederickson, H., A Framework for Sustainability Indicators at EPA [55], National Risk Management Laboratory, EPA 2012
3.2. Environmental Metrics
3.2. Environmental Metrics
Environmental metrics are designed to assess the environmental impact of technology or activity. Such impacts are primarily related to using natural resources (lifecycle INPUTS) and generating waste and emissions (lifecycle OUTPUTS). The ultimate sustainability goal is to minimize the environmental impacts due to using non-renewable resources and minimizing waste and pollution. Since the complete elimination of these impacts is hardly possible (any technology has its environmental costs!), it is also important to evaluate the rate at which environment can absorb the impacts and become remediated.
There are a number of common metrics designed to characterize the lifecycle inputs and outputs. Some examples are given below:
|
Metric |
Units* |
What it measures |
|---|---|---|
| Water use | m3 |
Amount of water consumed in the process of extraction, processing, manufacturing, maintenance and use of the product |
| Land use | acre |
Land area required (not available for other needs) for extraction, processing, manufacturing, use, and disposal of the product |
| Embodied energy | J |
Sum of all energy inputs to produce the product. This metric may include both technological and natural transformations. |
| Total lifecycle energy | J |
Sum of all energy spent to produce the product, extract and process the initial materials, use the product, and dispose off the waste |
* The units in the metrics are typically normalized by unit mass, unit volume, or unit area of a material or product, depending on application. For example, for lifecycle energy, it is common to see the units such as J/kg, which indicate how many jules of energy were spent for manfacturing, use, and disposal of 1 kg of the material or product over its lifecycle.
| Metric | Units | What it measures |
|---|---|---|
| Global Warming Potential (GWP) | kgCO2-eq |
Contribution to global warming due to emissions of greenhouse gases to the atmosphere |
|
Ozone Depletion Potential (ODP) |
kgCFC11-eq |
Contribution to stratospheric ozone layer depletion |
|
Water/Soil Acidification Potential (AP) |
kgSO2-eq |
Contribution to acidification of soils and water due to the release of gases such as nitrogen oxides and sulfur oxides |
|
Smog / Tropospheric Ozone Creation Potential (SCP) |
kgNO2-eq |
Contribution to air pollution, creation of tropospheric ozone (smog) by releasing nitrogen oxides and particulates |
|
Eutrophication Potential (EP) |
kg N-eq |
Enrichment of the aquatic ecosystems with nutritional elements (nitrogen or phosphorus) |
|
Human Toxicity Potential (HTP) |
1,4-DCB-eq |
Impact on humans of toxic substances emitted to the environment (health / cancer /non-cancer impacts) |
It should be noted that input metrics primarily characterize the sources of impacts (not impacts themselves), while output metrics aim to quantify the consequences - how the extraction and manufacturing processes and technologies may affect natural ecosystems, human health, and environmental values at large.
Next we are going to take a closer look at some of the metrics and show how those can be estimated.
Emergy / Transformity
The concepts of emergy and transformity are introduced as universal measures in the environmental accounting theory. The basic approach in that theory is to use energy units for assessing inputs and outputs of various natural and industrial systems. All types of energy and real wealth products are related to the primordial source - solar energy - through transformity. It is stated that going through multiple transformations via both technological and natural converters, available energy acquires new quality, while the load on the environment due to those transformations increases.
For example, on a hot day, we use an air conditioner. The energy to power the air conditioner comes from the electricity grid. Prior to that, the electric energy is generated at a power plant via conversion of thermal energy of steam and kinetic energy of the turbine into electricity. The thermal energy is, in turn, produced by combustion of fossil fuels. Energy stored in the fossil fuels (which were originally biomass) was actually the solar energy transformed by plants to organic matter via photosynthesis. So, solar energy is indeed the original component of the final energy used by the air conditioner (Figure 3.1).

Transformations of the primary types of energy through an array of energy conversion processes and technologies described in the example above demonstrate the idea of transformity applied to a particular type of usable energy, such as electricity. In other words, transformity indicates how many transformations are necessary to obtain a particular sort of energy in a usable form and also show how “costly” those transformations are for the environment. Quantification of the energy inputs and outputs in terms of primary solar energy may be a tricky task; however, a number of studies provided such data and enabled energy flow analysis for environmental systems.
Check Your Understanding
Probing Question: Which of the following types of resources, in your opinion, has the lowest transformity based on the concept outlined above:
(A) Hydrogen
(B) Natural gas
(C) Wastewater
(D) Gasoline
(E) Ammonia fertilizer
Click for answer.
Emergy is defined as the available solar energy used up directly or indirectly to make a service, product, fuel, or another form of usable resource. This term essentially means the solar energy equivalent. Transformity, in this case, is the equivalence factor:
Emergy [seJ] = Energy stored or available [J] x Transformity [seJ/J]
Emergy is usually measured in solar energy joules [seJ], and transformity is therefore expressed as a ratio of solar energy Joules to regular Joules.
Example of transformity calculation
Here we use tree logs as an example for expressing transformity. The key energy transformation involved in the production of tree logs is photosynthesis, the natural processes that convert CO2 gas and solar radiation into biomass.
This calculation is done for 1 Ga of forest. Here, the Solar emergy flow essentially indicates how much solar energy is supplied by the sun onto that 1 Ga area. This would depend on solar insolation, which, in turn, depends on the geographic location of the forest, local weather profile, and other factors. The Energy flow, in this case, is the energy content of the wood produced by the 1 Ga forest per year. The result can be read as: 3846 joules of solar energy is used per each joule of energy stored in the logs. We understand that, in order to be accurate, transformity has to be evaluated taking into account the larger surroundings of the system and specific conditions. We also see from this example that only a part of the available solar energy is captured and converted to the usable stored energy (logs), while the rest of it is dissipated or redirected in this system.
Supplemental Reading:
Book: Odum, H.T., Environmental Accounting, John Wiley & Sons 1996. pp.1-15.
This book introduces the emergy theory and method for evaluation of environmental and economic use. Chapters 1 and 2, especially, would help you understand the basics of this approach. This is an optional reading, and the book is not provided in the electronic format. However, if you are interested in this topic and would like to use this approach in your own assessments, it is a proper resource to explore.
Embodied Energy
Embodied energy is another popular representation of the same concept. By definition: embodied energy is the sum of all the energy required to produce any material or product considered as if that energy was incorporated or 'embodied' in the product itself (Wikipedia, Embodied Energy [56]).
The main difference between the embodied energy and emergy is that the former does not include the energy content in the raw resource (e.g. energy content in growing trees), but rather just accounts for the subsequent energy expenditures associated with the extraction, processing, and manufacturing stages.
Embodied energy is often expressed in the units of energy per making a unit mass [J/kg], unit volume [J/liter], or unit area [J/m2] of material depending how the its amount is accounted. Some data are given below for illustration.
| Material | Embodied Energy, MJ/kg |
|---|---|
| Concrete | 1.1 |
| Timber | 8.5 |
| Glass | 15 |
| Stainless steel | 55 |
| Plastic (PET) | 82 |
| Aluminum | 155 |
For more complex products consisting of multiple raw materials, the embodied energy increases significantly. For instance, for a common monocrystalline silicon solar PV panel, the embodied energy was estimated at ~4750 MJ/m2.
Global Warming Potential
Global Warming Potential (GWP) is a very common way to account for greenhouse gas emissions of a project. It can be used within the Lifecycle Assessment and outside of it as a criterion for choosing the most climate-friendly solution among the alternatives. GWP scale is also commonly used to compare different atmospheric gases and pollutants with respect to their ability to cause greenhouse effect. In that sense GWP is a relative metric - it is always related to carbon dioxide CO2 as the universal benchmark.
GWP of a gas depends on:
- Heat (IR radiation) absorption properties
- Spectral location of the absorbed wavelength (specific for Earth's radiation range)
- Atmospheric lifetime (longer = more impact)
- Time span of assessment (commonly 100 years)
For example, GWP of methane (CH4) = 25. That means that a ton of methane causes 25 as much warming in the atmosphere as a ton of CO2 due to greenhouse effect over a 100-years period.
Here is the list a few common atmospheric pollutants graded on the GWP scale.
| Gas | GWP factor | Atmospheric Lifetime |
|---|---|---|
| CO2 | 1 | 50-200 years |
| CH4 | 25 | 8-12 years |
| N2O | 298 | 120 years |
| CF4 | 7350 | 50,000 years |
| Hydrofluorocarbons | 1000-12,000 | 12-300 years |
| CF6 | 22,800 | 3200 years |
It is easy to notice the correlation between the longer lifetime and GWP. Some gases are not necessarily potent IR absorbers, but due to very long persistence in the atmosphere, the overall impact is compounded in the long term.
Let us see how these GWP factors for these chemicals can be used in project assessment.
Example
Assume greenhouse gas (GHG) emissions from an agricultural project are estimated as follows:
- Carbon dioxide: m(CO2) = 5 ton/year (gasoline and diesel-based machinery, irrigation pump, electric grid emissions)
- Methane: m(CH4) = 0.1 ton/year (organic decay, on-site waste management)
- Nitrous oxide (N2O) = 0.01 ton/year (transportation emissions)
All these emissions will contribute to the greenhouse effect and global warming, but not equally. Total contribution can be calculated based on GWP metrics:

As another example of using GWP, you can look at the LCA study by Stoessel et al., 2012 [57], that assessed various crops with respect to a number of environmental metrics. Figure 2 of the paper makes an interesting illustration of environmental costs of production and sales of different types of agricultural produce.
Kaya Equation
Kaya Equation (introduced by the economist Yochi Kaya) is another example of environmental metric, which helps to estimate the total CO2 emissions of a country based on some common social and economic information, such as population, gross domestic product, energy intensity, and carbon intensity:
Where P = population, GDP = gross domestic product, (GDP/P) = GDP per capita, (E/GDP) = energy intensity per unit of GDP, and (CO2/E) = carbon intensity, i.e., emissions per unit energy consumed.
Obviously, the population is an important factor here since more people means more energy use, so it is included as the first term in this equation. GDP is commonly determined the market value of all officially recognized final goods and services produced within a country in a given period of time. GDP per capita is often considered an indicator of a country's economic well-being and standard of living. GDP per capita appears as the next term in the formula, since bigger economy means higher energy use. The next two terms - energy intensity and carbon intensity - are technology related. As we develop more efficient ways to convert energy or produce goods through technological innovation, we expect that it will take less energy to increase our GDP by another dollar. As efficiency grows, the E/GDP term should go down. Finally, the carbon intensity is primarily affected by the ways we generate energy. As we develop and gradually switch to renewable energy sources and minimize the use of fossil fuels, we should see CO2/E factor to decrease. As a result, less carbon dioxide will be emitted per kW of power produced.
The last metric in the Kaya equation is also useful to understand the real "carbon cost" of the energy converting technologies. The more fossil fuel burning is involved in the production of consumable energy (energy conversion), the higher the “carbon cost” of each bit of that energy. Renewable energy technologies, such as solar, wind, and others are characterized by lower (CO2/E), or even approach zero carbon in an ideal case. However, from the systems perspective, zero emission is not always achievable, since manufacturing, maintenance, and support system operation of such energy conversion systems may still require a certain amount of energy from fossil fuels.
Consider this example: A “green bus” uses a hydrogen fuel cell stack as an engine and emits only water from H2 + 0.5O2(air) = H2O reaction. Its operation is totally carbon-free, as we see no C letter in that reaction. However, manufacturing of such a bus requires equipment operated from the grid, which distributes electricity from a local fossil fuel power plant. Furthermore, maintenance of this bus over its lifetime may require other non-renewable resources. Therefore, its carbon “footprint” may be quite low, but still non-zero (at least until the moment we entirely decarbonize the grid).
The Kaya model allows estimating how changing technological solutions for energy conversion can help the economy in terms of emission reduction. Determination of the CO2/E factor provides a quantitative scale for measuring environmental impact in terms of “carbon cost”. The CO2/E metric is common in many assessment studies discussing alternative energy sources. We need to keep in mind that reported values usually reflect the lifecycle, "cradle to grave" emissions, i.e.,those related to raw material extraction, manufacturing, delivery, operation, maintenance, and decommissioning altogether (not just operational emissions).
Data Reading Exercise:
 [58]
[58]Take a look at this example of a National Renewable Energy Laboratory (NREL) study [58] that had a goal to compare the lifecycle greenhouse gas emissions of various energy technologies. The study took into account the total estimated emissions from more than 2100 LCA publications and related those to the total amount of energy generated by those systems during their lifetime operation. The carbon intensity results are summarized on the bar graph (p.2 of the fact sheet). Interpreting the graph, answer the following questions for yourself and write answers in your notes:
- What units are used to express the CO2/E metric?
- Energy from which technology (out of those studied) has the highest "carbon cost"? Which one has the lowest "carbon cost"?
- Which stage of the technology lifecycle does result in the most CO2 emissions: in case of renewable energy systems and in case of fossil fuel energy systems?
In summary, a review of the Kaya equation indicates that the development of technologies can lower the global and country's carbon emissions in two ways: (1) increasing conversion efficiency and (2) decreasing carbon content in the lifecycle.
Try this: Estimate Your Ecological footprint
Various internet sites use combinations of environmental metrics to calculate the so-called ecological footprint. This is an illustration of how environmental metrics can be used to compare human lifestyles, which essentially comes down to the comparison of technologies people use. These calculators are far from being specific and use generalized information on environmental impacts. Here are a couple of calculators you can check just for fun:
- Easy to take quiz to calculate your ecological footprint [59]
- Household Carbon Footprint Calculator [60]
- Calculator of the ecological impact of foods [61]
Do you get similar results from different calculators?
3.3. Economic Metrics
3.3. Economic Metrics
When a systems approach is used for technology evaluation, the financial dimension of the system life cycle cannot be omitted. While it is not the purpose of this course to teach the entire theory of economic assessment, reviewing some fundamentals and practical tools for economic evaluation should be useful here.
The purpose of economic metrics is to provide the quantitative information needed to make a judgment or a decision on deployment of a new technology or to select alternative options. The most complete analysis of an investment in a technology or a project requires the analysis of each year of the life of the investment, taking into account relevant direct costs, indirect and overhead costs, taxes, and returns on investment, plus any externalities, such as environmental impacts that are relevant to the decision to be made.
The main questions to answer are:
- Is the technology / process cost-effective?
- Is deployment of the particular technology project financially viable?
- What would be the cost of the technology products and services to the public?
Cash Flow Analysis
Cash flow is a tool used to show how the project expenses and revenues vary over the term of the project - it is a financial timeline. For the basic cash flow, the following terms need to be defined:
- Term of the project – for how many years the process, technology, or facility will be deployed.
- Initial cost (capital investment) – one-time expense at the beginning (e.g., purchase of major assets - land, equipment, buildings, labor).
- Annuity – annual increment of cash related to the operation of the technology:
- positive, if it brings revenue;
- negative, if it brings expense;
- Note that net (expenditure vs. revenue) balance should be positive in order to repay the investment cost.
- Salvage value – one-time positive cash flow at the end of the planning period (if everything is sold in its actual condition). Usually, salvage value is low compared to initial cost.
General cash flow scheme can be visualized as follows (Figure 3.3):
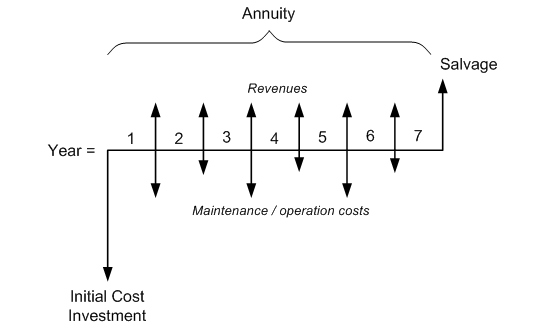
Modeling the cash flow helps assess the financial viability of a project and answer some of the important questions before the decision is made to start the project.
In this section, we are going to consider two basic approaches to cash flow analysis for a project: (1) Simple Payback approach and (2) Discounted Cash Flow analysis.
The first method is attractive for its simplicity and can be used as a quick-check calculation before any further, more sophisticated analysis is performed. It is best suited to short-term projects, in which the money value is not significantly impacted by inflation. The second method is preferred for long-term projects, when the money value is expected to significantly change over time or if interest is applied to investment over an extended period of time.
Referenced below are two reading sources that provide background on the economic evaluation, which will introduce several key economic metrics. The first source is more important, and its content is linked to one of the homework assignments given in this Lesson. Additional explanations and examples to the concepts discussed in the Vanek and Albright's book are provided further in this section.
Reading Assignment:
Book chapter: F.M. Vanek and L.D. Albright, Energy Systems Engineering. Evaluation and Implementation, McGraw Hill, 2008 - Chapter 3 Economic Tools for Energy Systems, pp. 62-75. (Available via E-Reserves in Canvas.)
This reading provides an introduction and examples on the economic evaluation of technologies. Please learn the basic approaches of cost analysis and take notes on terminology. Some of the concepts introduced in this chapter are further explained below.
Simple payback approach
This approach is suitable for short-term projects with quick return on investment. In this case, discounting (for money value declining over time) may be unnecessary.
In simple payback evaluation, all cash flows into and out of the project are added up to find Net Present Value (NPV) metric. That includes initial cost, annuities, and salvage value.
NPV = – Initial Cost + S(Annuities) + Salvage Value
If NPV is positive, the project is considered financially viable.
Example
Consider a hypothetical technology project with the initial cost of $100,000, net positive annuity of $20,000 for 10 years, and a salvage value in the end of that term of $5,000. Then, its net present value can be calculated as:
NPV = -$100,000 + (10 years x $20,000) + $5,000 = $105,000
The positive NPV value indicates that the project is financially viable.
The break-even point, i.e., the year when the sum of annuities surpasses the initial cost and the initial expenditures have been paid back, is characterized by the Simple Payback Period (SPB):
SPB (years) = Initial Cost / Net annuity
SPB indicates the number of years after which the initial expenditures are paid back.
For the case described above:
SPB = $100,000 / $20,000 = 5 years
Capital Recovery Factor (CRF) evaluates the relationship between the cash flow and investment cost. This evaluation is applicable to short-term investments (within N=10 years).
CRF = ACC / NPV
where ACC = Annual Capital Cost
ACC = Annuity – NPV/N
Here, the NPV/N term is the average share of the net present value per each year of the project. So, ACC is the part of the annuity that goes each year to cover the investment; it does not go towards profit.
For the project example described above, we can calculate:
ACC = $20,000 – $105,000/10 = 9,500
CRF = $9,500/$105,000 = 0.09 (9%)
CRF factor then should not be too high for a project to be considered financially viable.
By recommendation of the Electric Power Research Institute (EPRI), CRF value should not exceed 12%.
Discounted Cash Flow Analysis
This approach is better applied to long-term projects with slow payback. Money value declines over time, so it must be taken into account.
For example, many renewable energy projects generate low positive annuity at the beginning, while having high initial costs, so it takes more years to pay back investments. In this case, the discounted evaluation should be used.
In the case of discounted cash flow, we need to evaluate how much any cash flow element would value in the future. That would depend on the interest rate (i) imposed on initial investment and the number of years (N) the project is underway. The following conversion factors are used:
Then the NPV can be calculated using the following equation:
NPV = – Initial Cost + (P/A) × Annuity + (P/F) × Salvage Value
Example
For the example used in the simple payback approach section above, if the interest rate on the initial investment is set at 5%, the conversion factors for 10-year project can be calculated as:
(P/F, 5%, 10) = 0.614
and
(P/A, 5%, 10) = 7.722
and the discounted NPV future value can be found as:
NPVfuture = – Initial cost + (P/A) × Annuity + (P/F) × Salvage value =
= -$100,000 + 7.722 × $20,000 + 0.614 × $5,000 = $57,510
So, even with depreciation taken into account, the NPV of this project is still positive, indicating its economic viability.
Another useful metric associated with the discounted cash flow analysis is Internal Rate of Return (IRR), which corresponds to the marginal interest rate that would allow the project to break even in the end of the term.
Setting the investment interest rate above IRR would render the project not viable.
By calculating NPV future value for the end of the project term at different interest rates, one can find the rate at which NPV is equal to zero. The rate corresponding to that condition is IRR (Figure 3.4).
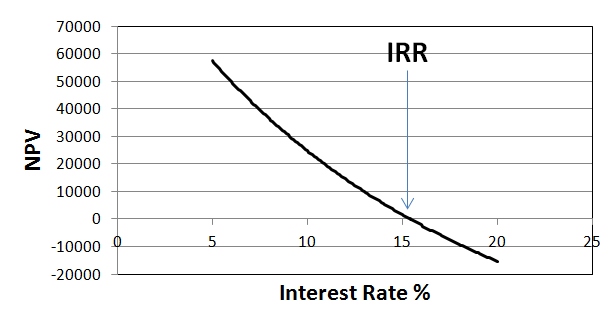
Another illustration of the comparison of the simple payback and discounted cash flow methods is given by the Example on p.67 of the book [Vanek and Albright, 2008].
Listed below are some other economic measures that can be used in different analyses as metrics to evaluate technological systems:
- TLCC = Total life cycle cost
- LCOE = Levelized cost of energy
- RR = Revenue requirements
- B/C = Benefit to cost ratio
- SIR = Savings to investment ratio
You can refer to supplemental reading source [Short et al., 1995] mentioned above for more details on how these metrics are useful and how they can be estimated.
Check your understanding:
Using the simple payback approach, estimate the net present value of a proposed technology project with the initial capital investment of $5 million, projected net annuity $500,000 per year for 8 years, and salvage value of $100,000. Is the project financially viable?
Click for answer.
NPV = -5,000,000 + 8 x 500,000 + 100,000 = -$900,000. This project is not financially viable based on simple payback evaluation, since its NPV is negative.
Supplemental Reading:
NREL Report: Short, W., Packey, D.J., and Holt, T., A Manual for the Economic Evaluation of Energy Efficiency and Renewable Energy Technologies [62], National Renewable Energy Laboratory, Golden, CO, 1995.
This report provides detailed guidelines on economic metrics and methods for technology evaluation.
3.4. Social Metrics
3.4. Social Metrics
According to the Western Australia Council of Social Services (WACOSS):
"Social sustainability occurs when the formal and informal processes; systems; structures; and relationships actively support the capacity of current and future generations to create healthy and livable communities. Socially sustainable communities are equitable, diverse, connected and democratic and provide a good quality of life."
When we talk about environmental metrics, we focus on well-being of environment; when we talk about economic metrics, we focus on well-being of economy. Hence, the social metrics should be measures of well-being of society or particular groups of people involved as stakeholders. While understanding the importance of sustainable development, people do not still want to give up wealth, capabilities, convenience of life. Although changes in lifestyles and consumption habits can be considered a necessary sacrifice, social analysis seeks to reveal the ways of social transformation that would be less stressful, yet more efficient in reaching sustainability goals. Comparison of different avenues for development would require establishing social metrics.
The following dimensions can be identified in the social context:
Quality of life - basic needs are met and a good quality of life for all members is fostered at the individual, group, and community level (e.g., health, housing, education, employment, safety).
When evaluating a technology project, one can use the following questions as a checklist to see how the development affects or improves:
- affordable and appropriate housing opportunities for the target group;
- physical health outcomes for the target group;
- mental health outcomes for the target group;
- education, training, and skill development opportunities for the target group;
- employment opportunities for the target group;
- access to transport for the target group;
- ability of the target group to meet their basic needs;
- safety and security for the target group;
- access to community amenities and facilities for the target group.
Equity - equitable opportunities and outcomes for all its members, particularly the poorest and most vulnerable members of the community.
Check how the technology project will:
- reduce disadvantage for the target group;
- assist the target group to have more control over their lives, socially and economically;
- identify the causes of disadvantage and inequality and look for ways to reduce them;
- identify and aim to meet the needs of any particularly disadvantaged and marginalized people within the target group;
- be delivered without bias and promote fairness.
Diversity – co-existence of different viewpoints, practices, ethnic, cultural, racial groups in the community.
Check how the technology project will:
- identify diverse groups within the target group and look at ways to meet their particular needs;
- recognize diversity within cultural, ethnic, and racial groups;
- allow for diverse viewpoints, beliefs, and values to be taken into consideration;
- promote understanding and acceptance within the broader community of diverse backgrounds, cultures, and life circumstances.
Interconnected/Social cohesions – establishment of processes, systems, and structures that promote connectedness within and outside the community at the formal, informal, and institutional level.
Check how the technology project will:
- help the target group to develop a sense of belonging in the broader community;
- increase participation in social activities by individuals in the target group;
- improve the target groups’ understanding of and access to public and civic institutions;
- build links between the target group and other groups in the broader community;
- result in the provision of increased support to the target group by the broader community;
- encourage the target group to contribute towards the community or provide support for others.
Democracy and governance – ensuring democratic processes and open and accountable governance structures.
Check how the technology project will:
- allow for a diverse range of people (especially the target group) to participate and be represented in decision-making processes;
- facilitate a clear decision-making process understandable by staff and stakeholders;
- have a budget sufficient to ensure adequate delivery by qualified, trained staff;
- ensure that the use of volunteers is appropriate and properly governed;
- have duration sufficient to achieve the desired outcomes;
- have Plan B - what will happen when the project ceases.
Maturity - an individual accepts the responsibility of consistent growth and improvement through broader social attributes (e.g., communication styles, behavioral patterns, indirect education, and philosophical explorations).
Check how the technology project will:
- be dependent on the responsible decisions of individuals in the target group;
- require additional knowledge and education of stakeholders.
Most of the social metrics are hard to quantify. In assessments, we have to develop a rubric that explains the low and high values on metric scale and choose a reference system for consistent comparison.
3.5. Sustainability Index
3.5. Sustainability Index
Several quantitative metrics have been constructed by Brown and Ulgiati (1997), based on the emergy theory (see system diagram in Figure 3.5). The treatment below provides a good example of how environmental metrics can be blended with economic and social aspects and link them to the system sustainability in a broader sense.
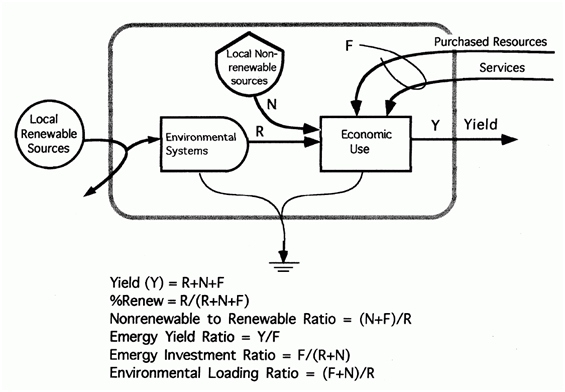
Figure 3.5 is a system diagram showing the energy flows and transformations within a generic locale (surrounded by the system boundary). The Economic Use box can be seen as a "transformer" of the available energy and resources into some Yield (Y), i.e., some product directly related to the function of this system. The inputs to the system are classified as renewable resources, non-renewable resources, local resources, and non-local (purchased) resources. In this model, it is presumed that system sustainability is favored by using renewable energy resources and local energy resources. The resources that are both renewable and local are denoted by R on this diagram. On the contrary, non-renewable local (N) and any non-local, i.e., purchased (F) resources are assumed to lower overall sustainability of the system. These assumptions set the basis for devising a few sustainability metrics in this study.
One of such metrics, which characterizes the environmental impact of an energy flow, is Environmental Loading Ratio (ELR):
ELR = (F + N) / R
From this relationship, we can see that the more non-renewable and outside resources are involved in the process, the higher the ERL index. An increase in renewable energy use in the denominator translates into a lower ELR value. As you can guess, lower ELR is beneficial for the environment.
Another index introduced here is Energy Yield Ratio (EYR):
EYR = Y / F
This metric characterizes the system's capability to exploit local resources (renewable or not). The more the system depends on imported resources or services (increasing F), the lower the EYR, and the higher the system's vulnerability.
Finally, the Sustainability Index (SI) combines both ELR and EYR as follows:
SI = EYR / ELR
Obviously, for higher sustainability “score”, we are interested in having the highest EYR versus the lowest ELR. Within this approach, SI can be used as an aggregate measure to characterize the sustainability function of a given process, technology, or economy.
Please see further explanation of this method and example calculations of metrics in the reading material referenced below.
Reading Assignment:
Journal article: Brown, M.T., and Ulgiati, S., Ecological Engineering 9 (1997) 51-69.
This paper explains the calculation of environmental and sustainability indices based on the available energy flows. It illustrates the process of devising sustainability metrics and applying them to a number of technologies and products.
Please study this article. In this lesson activity, you will be asked to perform a simple calculation of the environmental metrics based on the approach described herein.
The article is available as PDF file in the Lesson 3 Module on Canvas or can be accessed through the databases of the PSU Library system.
Note that the above-described approach to assessing a system sustainability is just a single illustration of how sustainability metrics can be devised. The parameters chosen by the authors were specific to their objectives. Calculations they provide answer some of the questions, but may not answer other questions that different stakeholders may have. In that respect, setting the objectives for your assessment and stating clear definitions and assumptions is a very important step in any assessment study in order to make the results meaningful.
3.6. Metric Balance
3.6. Metric Balance
Ideally, we would like to see the environmental, economic and social dimensions, and benefits of new technologies balanced. However, most real-life situations would gravitate differently towards those three dimensions. Results of the metric analysis need to be presented in a way that provides a clear and informative message to stakeholders and investors. Presented below are a couple of examples from sustainability assessments performed by government organizations.
The radial diagram in Figure 3.6 was presented by the National Renewable Energy Laboratory (NREL) to describe the sustainability profiles of several energy technologies. Six selected criteria plotted in 6 different directions in the form of a propeller provide an illustration of balance or lack of balance in system analysis. Note that each of the metrics is not directly comparable to others (like we saw in the case of the energy analysis, when all impacts are normalized to the same unit and scale). In this case, the scale for each metric needs to be defined independently versus boundary conditions (minimum and maximum values) so that it covers the appropriate range of evaluation.
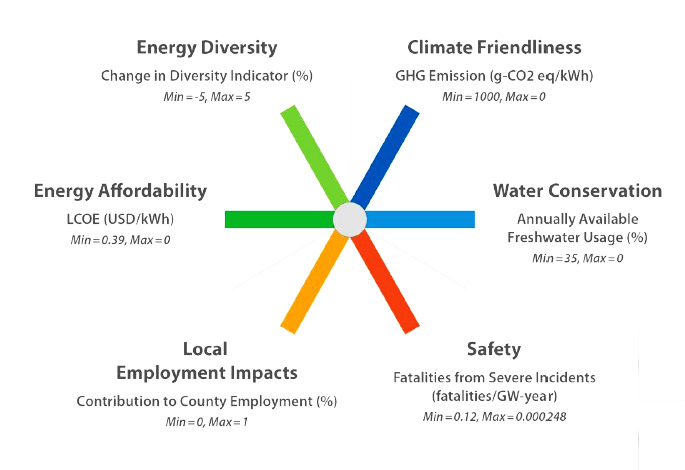
Click for a text description
- Climate Friendliness - GHG Emission (g-CO2 eq/kWh) - min=1000, Max=0
- Water Conservation - Annually Available Freshwater Usage (%) Min=35, Max=0
- Safety - Fatalities from Severe Incidents (fatalities/GW-year) Min=0.12, Max=0.000248
- Local Employment Impacts - Contribution to County Employment (%) - Min=0, Max=1
- Energy Affordability - LCOE (USD/kWh) - Min=0.39, Max=0
- Energy Diversity - Change in Diversity Indicator (%) - Min=-5, Max=5
The diagram below (Figure 3.7.) presents another example of how different categories of metrics are balanced to characterize the sustainability profile of a city. From this representation, we can immediately recognize that the most problematic areas the city may want to address first are Emission and Waste, which create a critically bad impact, and Materials and Energy flows (the lowest: red and orange scores in the pie). At the same time, Cultural Engagement and Identity is the most attractive feature of the city (the highest: bright green score). We can also conclude just from a quick glance that the ecological part of this sustainability system is most suppressed, while the cultural part is probably most developed and sound. On the political and economic fronts, some of the impacts are in the favorable range, while others are down to satisfactory. This snapshot of the disbalance provides a tool for comparison when other systems (cities) are evaluated against the same metrics.
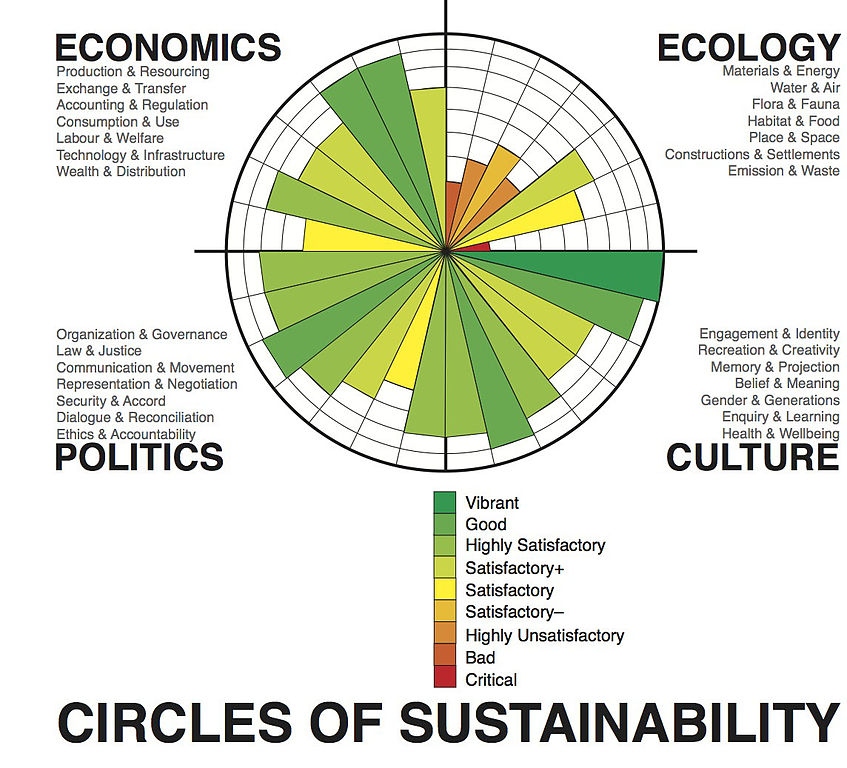
Summary & Activities
Summary & Activities
When considering specific technologies in the context of sustainability, the ideal expectation is that they score equally well on all three evaluation domains – environmental, economic, and social. The scoring metrics should be chosen wisely, with primary consideration of the main stakeholders’ interests. When comparing different technologies as alternatives for a project, go with the same set of metrics. Collection of location-specific and accurate data is critical for accurate assessment. Multi-metric assessment may not give you a simple answer, but may provide a more realistic ground for decision making. Resources listed in this lesson will be especially useful in choosing the path for the assessment study in your final course project.
| Type | Assignment Directions | Submit To |
|---|---|---|
| Reading | Complete all necessary reading assigned in this lesson. | |
| Activity |
Environmental Metrics. In this activity, you will be asked to apply the Sustainability Index method to an example household system. See more details in the Lesson 3 Activity Sheet - Environmental Metrics on Canvas. Deadline: Check Canvas calendar for specific due dates. |
Canvas: Lesson 3 Activity - Environmental Metrics |
| Activity |
Economic metrics. In this activity, you will be asked to apply basic cost analysis to a few example problems. See more details in the Lesson 3 Activity Sheet - Economic Metrics on Canvas. Deadline: Check Canvas calendar for specific due dates |
Canvas: Lesson 3 Activity - Economic Metrics |
| Individual Course Project |
Prepare an outline for your course project, identifying the technology of your choice, background information, motivation and goals of your evaluation, and ideas for technology implementation. The outline should be done in the form of PowerPoint presentation (5-8 slides) with audio commentary and will be the way of introducing your project topic to the class audience. Please see more instructions and guidance in the Lesson 12 [65] of this course. Please submit your presentation to the "Project Outlines" discussion forum in Canvas. Deadline: Check Canvas calendar for specific due dates. Further, you will be asked to review and provide feedback on other projects in the class. At the same time, you will receive peer comments on yours. |
Canvas: Course Project Module |
References and Resources:
Bell, S. and Morse, S., Sustainability Indicators: Measuring Immeasurable?, 2nd Ed., London - Sterling VA, 2008.
Brown, M.T. and Ulgiati, S, Emergy-based indices and ratios to evaluate sustainability: monitoring economies and technology toward environmentally sound innovation, Ecological Engineering 9 51–69 (1997).
Hammond, G.P. and C.I.Jones, Embodied Energy and Carbon Footprint Database, Department of Mechanical Engineering, University of Bath, United Kingdom (2006).
Odum, H.T., Environmental Accounting, John Wiley & Sons, 1996.
Short, W., Packey, D.J., and Holt, T., A Manual for the Economic Evaluation of Energy Efficiency and Renewable Energy Technologies, National Renewable Energy Laboratory, Golden, CO, 1995.
Vanek, F.M., and L.D. Albright, Energy Systems Engineering. Evaluation and Implementation, McGraw Hill, 2008.
Lesson 4: Green Chemistry
4.0. Overview
Overview
Over the past three lessons, we looked into different methods and frameworks that can be used for evaluating technologies or technology-dependent systems. Those methods involved both qualitative and quantitative metrics. The main challenge, however, is that there is no unified system of evaluation developed or recommended so far, and we have to be case-sensitive when choosing our path for the evaluation of a particular project. In further lessons, we visit different areas of industry and technology and see how the evaluation approaches are adapted to those specific topics. We will learn from real-life case studies and try to see which of the previously reviewed methods would be applicable for analysis and which would be not. Lesson 4 explores the areas of green chemistry and advanced materials. We will see how the principles of sustainable development are tuned for these areas and what steps are taken to implement them.
Learning Objectives
By the end of this lesson, you should be able to:
- understand and explain the principles of green chemistry;
- articulate the benefits and obstacles of green chemistry applications;
- evaluate the promise of alternative chemical technologies;
- explain the ways the multifunctional materials can impact the technological systems.
Readings
- Website: 12 Principles of Green Chemistry [66], American Chemical Society, 2014.
Reading materials for this lesson are mostly contained within the course website. The lesson contains multiple links to web resources, and you are alerted to open the most important ones. Some optional reading resources are referenced in blue boxes in the body of the lesson.
Questions?
If you have any questions while working through this Lesson, please post them to our Message Board forum in Canvas. You can use that space any time to chat about course topics or to ask questions. While you are there, please feel free to post your own responses if you are able to help out a classmate.
4.1. Principles of Green Chemistry
4.1. Principles of Green Chemistry

Green chemistry is the approach in chemical sciences that efficiently uses renewable raw materials, eliminating waste and avoiding the use of toxic and hazardous reagents and solvents in the manufacture and application of chemical products. Green chemistry takes into account the environmental impact and seeks to prevent or lessen that impact through several key principles outlined below.
Here are the 12 key principles of green chemistry as formulated by P.T. Anastas and J.C. Warner, in Green Chemistry: Theory and Practice, 1998.
- Prevention. It is better to prevent waste formation than to treat it after it is formed.
- Atom economy. Design synthetic methods to maximize incorporation of all material used into final product.
- Less hazard. Synthetic methods should, where practicable, use or generate materials of low human toxicity and environmental impact.
- Safer chemicals. Chemical product design should preserve efficacy whilst reducing toxicity.
- Safer solvents. Avoid auxiliary materials - solvents, extractants - if possible, or otherwise make them innocuous.
- Energy efficiency. Energy requirements should be minimized: conduct synthesis at ambient temperature and pressure.
- Renewable feedstocks. Raw materials should, where practicable, be renewable.
- Reduce derivatives. Unnecessary derivatization should be avoided where possible.
- Smart catalysis. Selectively catalyzed processes are superior to stoichiometric processes.
- Degradable design. Chemical products should be designed to be degradable to innocuous products when disposed of and not be environmentally persistent.
- Real-time analysis for pollution prevention. Monitor processes in real time to avoid excursions leading to the formation of hazardous materials.
- Hazard and accident prevention. Materials used in a chemical process should be chosen to minimize hazard and risk for chemical accidents, such as releases, explosions, and fires.
Reading Assignment:
Study this website to learn more about each green chemistry principle and what it implies. The provided examples will give you a better grasp of the concepts as well as some practical advice.
Website: ACS: 12 Design Principles of Green Chemistry [67] (Click on every principle to learn about specific recommendations)
Chemists are guided to use these 12 principles as a checklist for evaluation of a specific process or chemical technology at the stage of design and scale-up.
Initiation and development of the above-listed principles was closely tied to the Pollution Prevention Act [68] enacted in the USA in 1990. This document was a turning point in environmental policy by putting a particular focus not on environmental remediation and clean-up (i.e., fixing the damage at the end of the pipe) but rather on waste minimization and elimination of pollutants at the point of origin. This strategy of pollution prevention is also referred to as source reduction and is viewed as the first-choice measure to reduce risk to human health and the environment. Some of the attractive features of the source reduction are cost effectiveness, reduction in raw material use, pollution control savings, reduced risk to workers and the environment.
During the following year (1991), the Environmental Protection Agency (EPA) and National Science Foundation (NSF) initiated the Green Chemistry Program. A number of other similar initiatives were formed in the UK and some other countries. US Presidential Green Chemistry Challenge Award was founded in 1996. All these actions mark stepping stones in the green chemistry movement and philosophy, which gained more momentum in the following decades.
The green chemistry philosophy seeks to respond to public perceptions that chemistry and its applications via chemical technology have been primarily responsible for many of the ways the world degrades the environment. To reverse this stereotype, one of the central goals of green chemistry is to reduce risk to humans and environment from chemical synthesis, manufacturing, and application of chemical products through design of clean and closed-loop procedures.
Mitigating Risk and Hazard
Is there difference? Formally, in chemical fields, risk can be defined as a function of hazard and exposure:
Risk = f (hazard, exposure)
Traditionally, in industry and society, the reduction of risk is achieved through the reduction of exposure. By characterization of hazards (toxicity data) and knowing the effectiveness of the exposure controls ('containing the hazard'), risk can be manipulated or dissipated, especially at the early stages of the chemical chain, when it is easy to identify and measure. However, exposure controls may be not as useful downstream. The farther the hazard is from its source, the less the awareness of the potential hazard. With uncertainties in chronic effects, bio-accumulation, synergistic effects of chemicals, there is an uncertainty in risk mitigation.
The Green chemistry approach, in contrast with traditional practice, targets risk reduction through reduction of hazard. This is a safer approach because, if hazard is eliminated in the first place, there is no way risk can increase through any unpredicted spontaneous exposure increase anywhere downstream (Anastas and Warner, 1998).
Example: Fire Causes Methanol Spill
We do not need to go too far to find an example. Let us look, for instance, at the relatively recent chemical accident in Warsaw (Indiana). The Warsaw Chemical Co. plant produces car washing products and stores a number of hazardous chemicals on site. While the plant poses a potential environmental risk, that risk is mitigated by limiting the exposure: chemicals are contained in tanks, which are monitored; second containment is in place; operating equipment is regularly checked by qualified technicians; special personnel is trained to deal with leaks. The facility is also required to have a risk-management plan. The product the company makes is designed to contain only small amounts of hazardous components, which are dissipated in use. All these measures make sure any contact of the dangerous chemical with the environment or humans occurs in a small-scale, controlled manner.
This, however, does not eliminate risk itself - it is strictly controlled, but it is still there.
When accidental fire caused several explosions at the facility, the tanks containing the hazardous chemicals - mostly methanol - were ruptured, and the hazard was forced out of containment. Chemicals were apparently released to the nearby area and possibly leaked into the nearby lake via storm water stream. The immediate response included the measures such as: evacuation of public from the area, ban for using lake (for fishing or other activities), isolation of the spill and cleanup the affected soil and surfaces. Possibly, also the risk management plan will need revision to make sure that such harm is avoided in the future. In the current situation, all these measures are appropriate, but they are all again - exposure limiting. And, therefore, they are limited in effectiveness.
Green chemistry approach calls for minimizing the hazard. Instead of controlling methanol, get rid of it. Use a non-hazardous material instead. If it leaks, there is no hazard. No hazard - no risk. However, this approach clearly requires some expertise and investment from the company. Because the company, even though wanting to be green, wants to stay competitive and profitable, green approach is a technical challenge for product designers.
News source: Chemical plant blast injures 8, poses environmental concerns [69], INDYStar/ Accessed: 2/9/2015.
Green Chemistry Control Keys
So, what are possible avenues for changing the existing practices towards the minimum-risk alternatives? There are several controls that can be manipulated at different stages of a chemical manufacturing process.
Using alternative feedstock or starting materials: Selection of the starting materials has a major effect through the whole synthetic pathway. It determines what hazards will be faced by the workers extracting the substance, shippers transporting the substance, chemists handling the substance. It also predetermines possible future risks from the end-products and wastes. Using more environmentally benign alternative feedstock may improve the environmental profile of the whole process (this links to green chemistry principle #7). One of the examples of this step is choosing between the petroleum feedstock and biological feedstock. Currently, 98% of all organic chemicals in the USA are produced from petroleum. Petroleum refining is extremely energy-consuming (15% of total national energy use) and contains high-pollution oxygenation processes. Agricultural feedstocks can be a great alternative that eliminate much of that hazard. Research has shown that many agricultural products (e.g., corn, soy, molasses) can be transformed via a variety of processes into textile, nylon, etc. (Anastas and Warner, 1998).
Using alternative reagents: Reagents are needed to transform the starting molecules into a target substance. Reagents are not necessarily consumed and are often recycled, but can still bear harm to people and environment exposed to the process. At this point, a chemist must balance the criteria of chemical efficiency and availability with potential hazards. This practice taps into green chemistry principles #2, 4, and 5.
Using alternative solvents: Solvents are a very common focusing point because a wide range of syntheses are performed in the liquid media. Many of the currently used solvents are volatile organic compounds. Many of those are responsible for air quality problems (smog, etc.) when released to air. While the traditional organic solvents are easily available, well characterized, and regulated, there is a push for alternative systems that are more environmentally benign in the long run – aqueous solvents, ionic liquids, immobilized solvents, supercritical fluids, etc. (Principle #5) The choice of an alternative solvent requires careful and specific analysis, which determines if the new process would be as efficient or as cost-effective. How such trade-offs are resolved is discussed later in this lesson.
Changing target product: Chemistry is function oriented – the target chemical is needed to perform a certain function or possess certain properties. This avenue is related to the search of the alternative final product, which may require radical change in the way synthesis is done (Principle #3). Through chemical research, it is possible to identify those parts of a molecule that provide the chemical with a desired function as well as those parts that provide toxicity. Maximizing the former and minimizing the latter is a worthy challenge for chemical design.
Process monitoring: Real time measurements (sensing) of process parameters and concentrations sometimes provide valuable information and hints how the process should be tuned to avoid adverse effects or risk (Principle #11). Also, process monitoring may open avenues for making the process more cost-effective.
Alternative catalysis: Catalysis bears enormous benefits, not only from the standpoint of technical efficiency. Environmental benefit results from the use of a much smaller amount of reagents in catalyzed reactions, which otherwise would contribute to the waste stream. Using less chemicals is also economically profitable. It should be noted, though, that many classes of catalysis (e.g., heavy metals) are very toxic. Hence, the challenge of alternative catalysis is to develop environmentally benign options (Principle #9).
As you can see, most of these measures are oriented towards reducing hazard in the first place. Eliminating, minimizing, or neutralizing toxic components at earlier stages of the process allows for more relaxed exposure control at later stages. Item 5 is more universal, as sensing can help monitor and control both toxicity and exposure at both inlet and outlet of the chemical system.
The green chemistry principles are also important as guidance for designing metrics for chemical technology evaluation. Some examples of those metrics are discussed further in section 4.3.
Supplemental Reading - Want to learn more about green chemistry principles?
Anastas, P. T., Warner, J. Green Chemistry: Theory and Practice; Oxford University Press: London, 1998.
This book provides more explanation on the green chemistry principle and desired impacts, overviews the methods to design safer chemicals, and describes a handful of good examples of how the green chemistry principles are implemented in real-life scenarios. This book is not a required reading, but is recommended as a resource for design sustainability assessment of green chemistry projects.
4.2. Mitigating Environmental Risk
Case of Dead Fish - Lake Ariel
The following Video is text set to music. The text of the slideshow can be found in the transcript in the caption below.
Video: Intro to Lake Ariel Case (1:01)
What’s happening? A lake I Wayne County is under investigation for an abundance of dead fish. The state department of Environmental protection was notified of what they call a “fish kill”.
How many fish? Authorities believe about 10,000 fish are dead in the lake. They said of the dead fish, most are minnows, but there was some larger game found dead.
Where? Located in Northeastern Pennsylvania, Lake Ariel is a 300 acre spring fed motor boating lake.
When? This fish kill was reported on July 24th 2013.
Causes? Allied Biological, a N.J. company hired by Ariel Landowners, performed pesticide applications to treat algae blooms at Lake Ariel on July 19 and 22. The fish kill was reported on July 24. Solution. Since the firm did not follow proper application procedures for copper sulfate. Now they must respond within 30 days with the steps they are going to take to make sure it doesn’t happen again.
Residents’ Opinion. “We love our lake, there were many dead fish, but we would go in the water now” says Mollie Conway
Lake Ariel fish kill. Credit:
Zoe Link via Prezi 2014
Another example we can look into is the chemical incident on Lake Ariel in Wayne County, Pennsylvania. In 2014, the owners of the land where the recreational lake is located, contracted a New Jersey company to help clean the lake of algae. Accelerated algae growth is believed to be the result of lake pollution due to illegal septic systems flushing their waste into the lake. The contractor applied two algaecide treatments of copper sulfate to the lake, which resulted in killing around 10,000 fish. The Department of Environmental Protection issued a fine stating that copper sulfate applications should be spaced 7 to 14 days apart, whereas the company made two applications spaced only 3 days apart. The owner argued that the extremely hot day during that summer was what ultimately caused the fish death. Nevertheless, the shortened time in between applications was considered negligence.
Check the link below to collect additional facts about this case, then work through a few questions to analyze the situation:
Probing question #1:
What do you think was the main risk the owners failed to mitigate in this case?
Click for answer.
Probing question #2:
What would you identify as a chemical hazard in this incident?
Click for answer.
Probing question #3:
What are the controls to be used to limit exposure in this case?
Click for answer.
Probing question #4:
Based on the information available, what factor was primarily responsible for fish kill? Click on your answer below.
(A) Chemical exposure
(B) Heat
(C) Low Oxygen Content
(D) Organic Water Pollution
(E) All of the above
Probing question #5:
What would be the optimal approach to the problem, best aligned with the green chemistry principles?
- (A) Strictly follow the protocol of copper sulfate application (7-14 days apart)
- (B) Start with lower dosage of chemical and monitor the fish response
- (C) Wait for a cooler day to perform treatment
- (D) Minimize the septic tank flushing into the lake
- (E) Leave the system as is and avoid using chemicals at all costs
Click for answer.
Other alternative measures could include: developing fish-tolerant chemicals to treat algae (Principles ## 3 and 4) and monitoring the health of the lake prior, during, and after treatment to tailor the application procedure to the specific ecosystem (Principle #11).
From this example, we see that dealing with sensitive ecosystems requires extra diligence when chemical flows are involved. Quite often, certain aquatic species are only tolerant to a very narrow range of chemical parameters, such as ligand and metal concentration, alkalinity, and pH. Even small fluctuations may turn out lethal for sensitive species and can result in quick and irreversible ecological damage.
This example also provides an opportunity for exercising system thinking, during which we can try to establish multiple causal connections and understand the coupling effects, which are able to quickly amplify the ecological stress. In this case, we observed it with the heat factor. Hotter temperature not only "purges" water of oxygen (due to lower solubility levels), but also promotes algae growth, which in turn removes oxygen from water even further. The system analysis can help reveal this sort of double impact, alert us of the increased risk, and prevent hasty actions.
4.3. Frameworks for assessment of alternatives
4.3. Frameworks for assessment of alternatives
So, what does it take to change the conventional practice with possibly hazardous or harmful chemicals or processes to a more sustainable solution?
The major step is assessment of alternative solutions, which takes into account a wide range of criteria. When thinking about replacing the existing process with an innovative alternative, chemists and engineers try to avoid so-called "regrettable substitutions". In other words, avoid switching to an alternative process or chemical that either transfers risk to another point in the production chain or lifecycle or contains unknown future risks.
Ideally, in the concluded assessment, chosen alternatives must:
- be technologically feasible;
- provide the same or better value in performance and cost;
- have an improved profile for human health and environment;
- account for economic and social considerations;
- have potential to be sustainable over long period of time (look out for restrictions that may arise in the future; for example, shortage of rare elements, etc.).
We see that choosing the best alternative requires careful investigation! Such investigation must be comprehensive, i.e., would require cross-disciplinary expertise, and based on high quality data.
Let us look at some typical criteria that may be used in chemical industry and research for evaluation of various processes and reactions. In the "green chemistry" context, the main emphasis is put on the environmental profile of a chemical alternative, while economic feasibility is included in the picture at the stage of technology transfer.
Evaluation criteria
Table 4.1 below represents the set of criteria that can be effectively used for assessing alternatives in chemical and material manufacturing. On the left, the top-level criteria are listed, which are key points of concern when introducing new chemicals to the manufacturing process. The middle column lists some sub-criteria, which show how the impacts can be distributed. The right column specifies specific measures for each type of impact, which basically become guides for data search and analysis.
| Criteria | Sub-Criteria | Measures |
|---|---|---|
| Physical Chemical Hazards | - | Flammability |
| Flashpoint | ||
| Explosivity limits | ||
| Auto-ignitability temperature | ||
| Oxidizing properties | ||
| Human Health Impact | Toxicity | Acute toxicity |
| Carcinogenicity | ||
| Developmental toxicity | ||
| Endocrine toxicity | ||
| Endocrine disruption | ||
| Epigenetic toxicity | ||
| Genotoxicity | ||
| Organ, tissue, cell toxicity | ||
| Human Exposure | Volume in manufacturing | |
| Volume in consumer use | ||
| Extent in dispersive use | ||
| Sensitive sub-populations | ||
| Persistence | ||
| Bioaccumulation | ||
| Ecological Impacts | Adverse Impacts | Aquatic, animal or plant species |
| Aquatic and terrestrial ecosystems | ||
| Endangered or threatened species | ||
| Environmentally sensitive habits | ||
| Exposure | Volume in manufacturing | |
| Volume in consumer use | ||
| Extent in dispersive use | ||
| Persistence | ||
| Bioaccumulation | ||
| Environmental Impacts | Adverse Air Quality Impacts | Nitrogen oxide |
| Sulfur oxides | ||
| Greenhouse gases | ||
| Ozone-depleting compounds | ||
| Photochemically reactive compounds | ||
| Particulate matter | ||
| Fine particle matter | ||
| Adverse Water Quality Impacts | Biological oxygen demand | |
| Total dissolved solids | ||
| Thermal pollution | ||
| Adverse Soil Quality Impacts | Chemical contamination | |
| Biological contamination | ||
| Loss of organic matter | ||
| Erosion | ||
| Natural Resource Use Impacts | Non-renewable material use | |
| Renewable material use | ||
| Water Use | ||
| Energy Use | ||
| Waste generation and end-of-life disposal | ||
| Reusability and recyclability | ||
| Technical Feasibility | - | Functionality |
| Reliability | ||
| Usability | ||
| Maintainability | ||
| Efficiency | ||
| Economic Feasibility | - | Manufacturer impact |
| Purchaser impact |
The list of criteria given in Table 4.1 has been proved effective for some case studies. While it puts the main emphasis on the hazard assessment and environmental impact, the technical and economic criteria are also included and can play a significant role even at the stage of selection of particular chemical reagents for the process. Note that the above list of criteria and sub-criteria is not something written in stone. It is presented here as an illustration. For each specific assessment project, choice of criteria needs to be justified through expert and stakeholder involvement and will depend on the goals of assessment. Depending on the assessment team decision, some criteria can be added, some – removed, and weights of all factors can be tuned. Clear identification and justification of the selected criteria is critical.
Data collection
In any assessment project, clear and consistent requirements should be set for the sources of data to be used. Information should meet specific data quality criteria for inclusion into the assessment. Quality of data will determine their utility. Data selection should follow the internationally recognized definition for reliable information: "Reliable information is from studies or data generated according to valid accepted testing protocols in which the test parameters documented are based on specific testing guidelines or in which all parameters described are comparable to a guideline method. Where such studies or data are not available, the results from accepted models and quantitative structure activity relationship (QSAR) approaches may be considered. The methodology by Organization for Economic Cooperation and Development (OECD) [72] can be used for the determination of reliable studies." (Principles of Alternative Assessment, 2012)
Preferably, data should be obtained from authoritative bodies, those referenced by US government agencies (e.g. EPA). The following are links to some of such resources:
- U.S. EPA PBT Profiler software [73] can be used to gain information on persistence, bioaccumulation potential and toxicity of organic substances.
- Government Toxicology Data Network [74]
Technical data sources
Information should be obtained from published studies or directly from technical experts or users of the alternatives. In other cases, information can be requested from product manufacturers. The specific performance information (reactions, energy effects, thermodynamic analysis) available from experimental labs may be needed to draw conclusions about technical feasibility for each individual application. Clear referencing of the data sources is important.
Economic data sources
Data sources for financial information may include manufacturers, stakeholders, the Chemical Economics Handbook [75], and other standard reference sources. For many emerging alternatives, hard cost information may be unavailable. Cost comparisons today may not be directly extrapolated to emerging technologies because learning curves, scaling, and other factors can affect costs over time. Assumptions and use of surrogate data should be clearly explained in the assessment.
Ranking the alternatives
Quantification (scoring) of the impacts based on the criteria listed above is typically done via a multi-criteria analysis (MCA) model, appropriately build for the project. MCA provides techniques for comparing and ranking different outcomes of existing and alternative processes. When setting up an assessment project, it is important that the scoring system is transparent and is consistently applied to all scenarios under consideration.
MCA is a great tool for comparison of different options, but it is hardly objective because choice of criteria and metrics to quantify impacts varies from case to case. In contrast, cost analysis is aimed at providing objective measure of economic feasibility based on predicted cash flow. Cost analysis requires impacts to be expressed in monetary terms. MCA can use both monetary and non-monetary measures, as well as both quantitative and qualitative measures.
In MCA, ranking of chemicals or processes with respect to the listed criteria can be done in a variety of ways. One way is to assign each criterion a score that spans from 0 to 1, with the value of 1 corresponding to the best (most preferable) choice and the value of 0 corresponding to the worst (least preferable) choice among the available. The rest of the choices would score in between.
Example
For example, if substance A performs better than substances B and C on acute toxicity criterion, and substance B performed the worst of the three choices, then A will receive a score of 1, B will receive a score of 0. In case of qualitative assessment, substance C receives a score of 0.5 (linear dependence). In case of quantitative assessment, the utility values may be connected to the acute toxicity measure and will place substance C on the relative scale (i.e. taking into account how much more toxic it is compared to substance A and how much less toxic it is compared to substance B). This approach will be illustrated in one of the case studies further in this lesson.
Another possible approach for assigning scores is outranking. There is no relative scoring, but instead, alternatives are compared by each criteria in pairs (two at a time). This way, we try to identify the extent to which one alternative out-performs the other. In the end, the dual performance scores (1 - "win"; 0 - "lose") are aggregated, and the preference index is calculated for each alternative.
Example
For example, substance A out-performs B and C by acute toxicity, thus getting the cumulative score of 2 (1 point for each "win"). Respectively, substance C receives a score of 1 for beating B, and B is left with 0. One of the case studies described further in this lesson uses both approaches in order to compare the outcomes.
Evaluation of the economic impacts associated with the implementation of a new product or practice generally focuses on the changes in capital and operational costs and revenues. (These terms of cost analysis were overviewed in Lesson 3.). The main areas where impact is expected are:
- cost of new equipment or production process;
- operation and maintenance costs (labor costs, energy costs, etc.);
- cost differences for different substances;
- cost of transportation;
- cost of design, monitoring, and training;
- regulatory costs.
The data on economic impacts is collected in consultation with relevant supply chain actors and possibly trade associations. Evaluation can be an iterative process, starting from qualitative comparison of the old and new scenarios and ending at quantification of impacts with monetary values.
The European Chemicals Agency (ECHA) website [76] provides a more detailed guide to economic assessment of alternatives and can be used as a resource for this task. There are some documents linked that you are not required to read unless you're specifically interested in the socio-economic assessment.
Weighing factors
In most situations, decision-makers are not equally concerned about all highlighted criteria. For instance, a particular decision-maker may place more importance on whether a household cleaner causes cancer than on whether it contributes to smog formation. Thus, the decision-making method should account for respective “weight" of each criterion in the evaluation process. Since different stakeholders may place different weights upon criteria, the weighting raises significant questions in the context of a regulatory program. For example, can we consistently compare the alternatives without regulating the weight of factors? This is something to watch out for.
The criteria weights can be established by three methods:
- using generic or recommended weights;
- calculating the weights based from objective measures; and
- eliciting weights from stakeholders or experts.
Method (1) is exemplified by Table 4.2 which lists several sets of generic weights recommended by National Institute of Standards and Technology (NIST) based on the data of Environmental Protection Agency (EPA) and Harvard Study for a set of criteria usually used in life cycle assessment (LCA).
| Criteria | NIST | EPA | Harvard | Equal Weights |
|---|---|---|---|---|
| Global warming | 29.3 | 16 | 11 | 7.7 |
| Fossil Fuel Depletion | 9.7 | 5 | 7 | 7.7 |
| Air pollutants | 8.9 | 6 | 10 | 7.7 |
| Water intake | 7.8 | 3 | 9 | 7.7 |
| Human health cancerous | 7.6 | 11 | 6 | 7.7 |
| Human health non-cancerous | 5.3 | 11 | 6 | 7.7 |
| Ecological toxicity | 7.5 | 11 | 6 | 7.7 |
| Eutrophication | 6.2 | 5 | 9 | 7.7 |
| Habitat alteration | 6.1 | 16 | 6 | 7.7 |
| Smog | 3.5 | 6 | 9 | 7.7 |
| Indoor air quality | 3.3 | 11 | 7 | 7.7 |
| Acidification | 3.0 | 5 | 9 | 7.7 |
| Ozone Depletion | 2.1 | 5 | 11 | 7.7 |
In the above table, the NIST panel generated weights from stakeholder consulting that involved 7 building product manufacturers, 7 product users, and 5 LCA experts. EPA weights and Harvard weights were derived by NIST from sets of qualitative rankings of impacts developed respectively by EPA’s Science Advisory Board in 1990 and Harvard researchers in 1992.
Method (2) of calculating corresponding weights can be based on distance-to-target approach, when each criterion is weighted by the variance between the existing and desired conditions. For example, if the global community is further away from achieving the goal for global warming than it is for ozone depletion, then greater weight is given to the global warming potential. Another way to such calculation is monetary evaluation, when weighing is done based on the cost of environmental consequences.
Method (3), which assumes obtaining weights from stakeholders directly, may be based on public opinion surveys, community working group decisions, and different multi-criteria analysis models. The main types of stakeholders to consider: (1) Environmental Non-Government Organizations, Industry, Policymakers, and Consumers (Public). Weight assignments collected through surveys are then averaged across the board of stakeholders and then normalized to 100%.
Use of any of the methods depends on the goals of the assessment project, its scope, resources, and timeline. When building an assessment project, the weighing process should be transparent and well justified. When comparing different cases within one study, keep the weighing scale the same across the evaluation criteria.
Within the MCA approach, the final score (Si) of a particular option (alternative) with respect to any major top-level criterion i is estimated as an average of all sub-criteria scores under that criterion:
where n is number of sub-criteria or metrics used to assess the option under top-level criterion i. The final total score (Stot) is the weighted sum of all top-level criteria scores:
where N is the number of top-level criteria considered in assessment; wi is the weight factor of a particular criterion. The example study presented in the next section of this lesson demonstrates how the MCA scores are calculated and compared.
Consider the following supplemental reading materials on this topic:
Supplemental (Optional) Reading - Alternative Assignment Methodology
- Principles of Alternatives Assessment [77], Industry Coalition, 2012.
These recommendations were developed by the Industry Coalition on how the assessment of chemical alternatives should be conducted.
- Guidance on the Preparation of Socio-Economic Analysis as Part of an Application for Authorization [76], European Chemicals Agency, Version 1, January 2011.
This website provides some advice on socio-economic analysis of chemical alternatives under REACH regulation program.
Supplemental (Optional) Reading - Multi-Criteria Analysis
- Linkov, I, Moberg, E., Multi-Criteria Decision Analysis: Environmental Applications and Case Studies, CRC Press 2011.
This book is available online through Penn State Library system. It provides in-depth explanation on MCA methods and shows its applications to environmental science.
4.4. Case of Garment Cleaning Solvents
4.4. Case of Garment Cleaning Solvents
The case study presented below exemplifies the application of a range of criteria to the process in the dry cleaner industry. This kind of analysis can help decision-making process in the green chemistry context.
(Source: UCLA Sustainable Technology & Policy Program, 2011)
Baseline and alternatives
The existing process of garment cleaning utilizes chlorine-based solvent technology, which is not sufficiently benign. This case study examines a few alternative technologies, which aim at making it a greener process. Table 4.3 below lists the alternatives under consideration.
| Garment care method | Description |
|---|---|
| Baseline option: Perchloroethylene (PCE) dry cleaning | Chlorine-based solvent technology. Washing and drying in the same drum. Utilizes solvent recovery system which condenses heated and vaporized solvent during dry cycle and distillation. |
| DF-2000 | Petroleum-based solvent technology. Washing and drying in the same drum. Utilizes solvent recovery system which condenses heated and vaporized solvent during dry cycle and distillation cycle. |
| GreenEarth | Siloxane-based solvent technology. Washing and drying in the same drum. Utilizes solvent recovery system which condenses heated and vaporized solvent during dry cycle and distillation cycle. |
| Rynex | Glycol ether-based solvent technology. Washing and drying in the same drum. Utilizes solvent recovery system which condenses heated and vaporized solvent during dry cycle and distillation cycle. |
| nPropyl Bromide | Bromine-based solvent technology. Washing and drying in the same drum. Utilizes solvent recovery system which condenses heated and vaporized solvent during dry cycle and distillation cycle. |
| Carbon dioxide | CO2-based solvent technology. Washing and drying in the same drum. Utilizes solvent recovery system through change in pressure. Distillation uses heat and condensation to clean solvent. |
| Professional Wet Cleaning | Water-based solvent technology. Typically, washing and drying in different machines. Solvent recovery is not used. |
The criteria for evaluation were selected from the list in Table 4.1.
Criteria weighting
Criteria weighting was based on stakeholder elicitation. Four stakeholder groups were considered by the authors: Environmental Non-governmental Organizations (NGO), Industry, Policymakers, and Consumers. The elicitation process was also designed to obtain stakeholder reactions to the criteria; for example, whether any relevant criteria have been left out. During interviews, stakeholder representatives were asked to rank the major criteria on the 100 point scale, and the average weight of that criterion was obtained by averaging scores over all interviews. The list of relative (percentage) weights of all major evaluation criteria, as voted by different stakeholders, is presented in Table 4.4.
| Envtl. NGO | Industry | Consumer | Policymaker | Overall Average | |
|---|---|---|---|---|---|
| Physical Chemical Hazards | 15.22% | 11.04% | 15.21% | 13.12% | 13.75% |
| Human Health Impact | 21.14% | 18.07% | 20.28% | 24.75% | 20.83% |
| Ecological Hazards | 18.60% | 18.67% | 19.68% | 18.07% | 18.75% |
| Environmental Impacts | 18.60% | 20.08% | 19.68% | 14.11% | 18.33% |
| Technical Feasibility | 14.38% | 16.47% | 11.56% | 16.58% | 14.58% |
| Economic Feasibility | 12.05% | 15.66% | 13.59% | 13.37% | 13.75% |
As was noted by the authors of the study,
"on average, all stakeholder groups (except Industry) placed more weight on human health and ecological hazards as well as on environmental impact criteria. Industry and Policymakers assigned more weight to technical feasibility as compared to Consumers and Environmental NGOs. Industry placed more weight on economic feasibility than the other three groups. As discussed above, however, the sample sizes for the stakeholder groups were quite small (three in each group), with the goal of getting a sense of the potential differences across and within groups." (UCLA.., 2011)
Scoring methods
One of the goals of this project was to demonstrate the application of two techniques for multi-criteria decision analysis: (1) multi-attribute utility theory MAUT and (2) outranking.
"MAUT is an optimization approach, meaning that it represents the decision-maker's preferences as utility functions, and attempts to maximize the decision-maker's overall utility. MAUT is premised on the assumption that the decision-maker has a fairly well-defined set of preferences that can be represented on a dimensionless utility scale. It also assumes that the decision-maker is rational; that is, they prefer more utility rather than less and are consistent in those preferences. In the context of this project, therefore, a utility function was generated for each criterion, which reflects how a decision maker's preference changes for different values of that criterion. This utility function spans from 0 to 1, with a utility of 1 being assigned to the value of the best (or highest) alternative score for that criterion and 0 being assigned to the value of the worst (or lowest) alternative score. In this case, a linear utility function was used; which assumes that increases in utility are directly related to increases in the alternative's score for the criterion in question. Linear utility function was used as a default. Because the weighted scores for all criteria are added to produce the alternative's total score, MAUT is a 'compensatory' method. This means that poor performance on one criterion can be compensated by better performance on another.
Outranking models do not create utility functions, but instead directly compare the performance of two alternatives at a time, in terms of each criterion, to identify the extent to which one alternative out-performs the other. It then aggregates that information for all possible pairings to rank the alternatives based on overall performance on all criteria. Generally speaking, the PROMETHEE code used in the project creates a 'preference index' for each alternative, which is calculated by reference to the alternative's positive flow (i.e., those instances in which the alternative outperforms another alternative on a given criterion) and negative flow (i.e., those instances in which the alternative is outperformed by another alternative). The value awarded for winning a particular pairing is weighted, meaning it is adjusted to reflect the value placed upon that criterion by the decision-maker. Thus, outperforming another alternative in a minor criterion is worth less than outperforming it with respect to a more highly weighted criterion. As a default in PROMETHEE and most other outranking methods, any difference in performance - however small - will result in an increase in positive flow for the better performing alternative. As in MAUT, PROMETHEE recognizes that a decision-maker may be indifferent to how alternatives perform on certain criteria until certain levels are met or after certain levels are exceeded. Because outranking techniques aggregate the results of pairings for all criteria, they allow superior performance on some criteria to compensate for inferior performance on other criteria. However, they do not necessarily reflect the magnitude of relative under performance in a criterion versus the magnitude of over-performance in another criterion. In other words, if Alternative A is marginally worse than Alternative B in one criterion, but substantially better with respect to another, outranking may not fully 'compensate' Alternative A for its overall better performance. Therefore, outranking models are known as 'partially compensatory.'" (UCLA.., 2011)
Results
As Figures 4.1 and 4.2 demonstrate, for garment care, the two MCDA approaches ranked the alternatives in the same order. Both methods identified wet cleaning as the best overall performer. It was followed by CO2 cleaning and perchloroethylene. Figure 4.1 displays the total score received by each garment care alternative under MAUT; the higher the score, the better the overall performance.
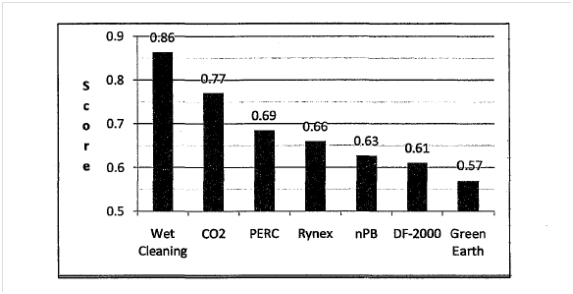
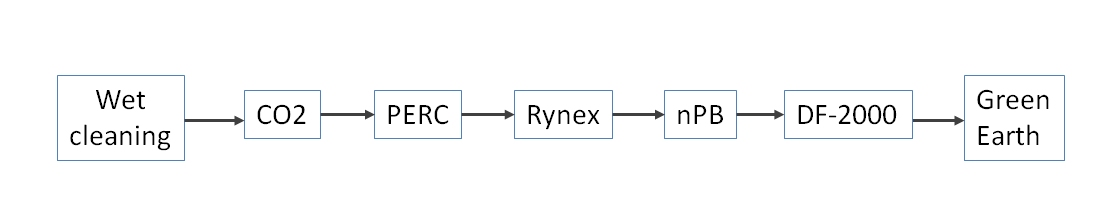
Figure 4.3 shows the breakdown of scores by each criterion. It is demonstrated that, "taking into account weighting, wet cleaning and CO2 cleaning's impact on human health, environmental, and ecological criteria drove the outcome in this case. This was so despite CO2 cleaning's very poor performance in terms of economic impact. Poor performance by DF-2000, nPB, Rynex and Green Earth in terms of physical and chemical hazards placed those alternatives behind the existing technology-perchloroethylene dry cleaning."
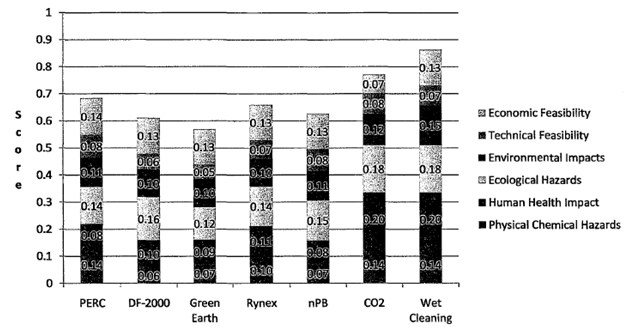
Example of score calculation
Wet cleaning technique, which outscored the other methods based on selected criteria, obtained a score of 0.15 for environmental impacts. This number is the product of the number of points assigned by the MAUT code and the average criterion weight (as prescribed in Table 4.2):
Score (Wet cleaning) = MAUT (Env. Impact) x Weight = 0.82 x 0.1833 = 0.15
The same technique received a MAUT ranking of 1 for physicochemical hazards (meaning it is least hazardous of all considered alternatives). Considering the weight of that criterion of 13.75% we calculate:
Score (Wet cleaning) = MAUT (Phys-Chem) x Weight = 1 x 0.1375 = 0.1375 ~ 0.14
In spite of better performance of wet cleaning on this criterion, its weighted score is lower than that obtained for the environmental impact, because of the lower weighing factor put on this category.
4.5. Green chemistry examples
4.5. Green chemistry examples
Since chemical products are present in virtually any sphere of technology, we can find numerous examples of studies and innovations that illustrate the application of green chemistry principles. Some of them are given below. In the end of this lesson, you will be asked to research one of these cases (of your choice) in more detail and to provide a brief evaluation of its promise.
A. Innovative propylene oxide process
Companies DOW and BASF jointly developed a technology of conversion of hydrogen peroxide into propylene oxide (HPPO) that has significant "green" advantages over competing technologies:
- It uses hydrogen peroxide and propylene as raw materials, producing only propylene oxide and water.
- It reduces waste water by 70-80%.
- It uses 35% less energy.
- Its capital cost is 25% less.
- It avoids need for co-product infrastructure and markets.
Source: www.epa.gov [78]
B. Advanced amine technology for carbon capture
Alstom-DOW pilot plant captures CO2 from new or existing industrial facilities with an improved sustainability profile:
- Pilot plant in West Virginia is designed to capture 1,800 tons CO2 per year.
- Advanced Amine process leads the industry in carbon capture efficiency.
- Capture rate ~90% with 99.5% purity of CO2.
- Process significantly reduces parasitic energy requirements.
Source: Pump Industry Analyst, 2009 [79]
C. Metathesis catalysis for making high-performing, green specialty chemicals at advantageous costs
Elevance employs Nobel-prize-winning catalyst technology to break down natural oils and recombine the fragments into novel, high performance green chemicals. These chemicals combine the benefits of both petrochemicals and biobased chemicals. Elevance produces specialty chemicals for many uses, e.g., concentrated cold-water detergents that provide better cleaning with reduced energy costs.
- Significant energy savings
- Reduction of greenhouse gas emissions by 50% (compared to petrochemical technologies)
Source: ACS [80]
D. An efficient biocatalytic process to manufacture simvastatin
Simvastatin, a leading drug for treating high cholesterol, is manufactured from a natural product. The traditional multistep synthesis was wasteful and used large amounts of hazardous reagents. Professor Y. Tang (UCLA) conceived a synthesis using an engineered enzyme and a practical low-cost feedstock. Codexis optimized both the enzyme and the chemical process.
- great reduction of hazard
- less amount of waste
- cost-effective approach
- better meets needs of customers
Some manufacturers in Europe and India use this process to make Simvastatin.
Source: ACS [81]
E. Enzymes save energy and wood fiber for manufacturing high-quality paper and paperboard
Traditionally, making strong paper required costly wood pulp, energy-intensive treatment, or chemical additives. But that may change. Buckman’s Maximyze®enzymes modify the cellulose in wood to increase the number of "fibrils" that bind the wood fibers to each other, thus making paper with improved strength and quality − without additional chemicals or energy. Buckman's process also allows papermaking with less wood fiber and higher percentages of recycled paper, enabling a single plant to save $1 million per year.
Source: ACS [82]
F. Gas-expanded liquids for sustainable catalysis
Gas-expanded liquid (GXL) is a substance generated by dissolving a compressible gas (for example, CO2 or a light olefin) in a regular liquid substance at mild pressures (tens of bar). When CO2 is used as the expansion gas, this process produces CO2-expanded liquid (CXL). An attractive feature of GXLs is that they combine the advantages of compressed gases and of traditional solvents. GXLs retain the beneficial attributes of the conventional solvent (polarity, catalyst/reactant solubility) but provide higher miscibility of permanent gases (O2, H2, CO, etc.), as compared to organic solvents at ambient conditions. GXLs also results in enhanced transport rates compared to regular liquid solvents. The enhanced gas solubility in GXLs have been exploited to alleviate gas starvation (often encountered in homogeneous catalysis with conventional solvents). Environmental advantages of GXL include:
- replacement of harmful organic solvents with environmentally benign CO2;
- reduced flammability due to CO2 presence in the vapor phase;
- lower process pressures (tens of bar) compared to supercritical CO2 (hundreds of bar) which is linked to energy savings.
GXLs thus have many characteristics of an ideal alternative solvent.
Source: Anastas and Zimmerman, 2013, [83] pp. 5-36. (This book is available online through the Penn State Library system.)
G. Synthesis of magnetite (Fe3O4) nanoparticles "green" way
Shape-controlling studies of magnetite nanomaterials are pursued actively since their magnetic and electrochemical properties, as well as their catalytic activities, greatly depend on their nanostructures. As catalysts, Fe3O4 nanoparticles possess some advantages over natural enzymes (e.g., horseradish peroxidase, HRP) because (i) they can maintain relatively high catalytic activities under a wide range of environmental changes, even in severe conditions (pH = 2–7, 70 °C) and (ii) their preparation and purification procedures are reproducible and cheaper than those of natural enzymes. The robustness, repeatability, and low price of Fe3O4 nanoparticles make them suitable as catalysts for H2O2 oxidation for a broad range of applications in biotechnology and environmental chemistry.
However, the synthesis of Fe3O4 nanoparticles with controlled morphology is still a challenge. Current approaches, such as a hydrothermal process, solvothermal process, and thermal decomposition, involve toxic sources (e.g., organic solvents and surfactants), rigorous conditions (high temperature, high pressure), and tedious synthetic procedures, which prevent the large-scale production and widespread practical applications of Fe3O4 nanoparticles. Additionally, the recovery of Fe3O4 nanoparticles for repeated use is still difficult. Therefore, nontoxic, water-based approaches for the fabrication of morphology controllable Fe3O4 nanoparticles, which can be produced on a large-scale and effectively recovered, are urgently needed.
This article introduces a new straightforward approach developed for fabricating Fe3O4 nanoparticles/hydrogel magnetic nanocomposites, in which the morphology of the nanoparticles can be controlled under nontoxic and water-based conditions. The 3D hydrogel networks, which contain a liquid-like microenvironment facilitating small molecule diffusion and transport, can act as an ideal nano/micro-reactor but also as a great carrier for the synthesis and immobilization of nanoparticles. This study was inspired by magnetotactic bacteria, which are capable of producing bacterial magnetic particles (BacMPs) with a highly controlled morphology (e.g., nanocube, nanooctahedron, and nanododecahedron) due to their nanoscaled magnetosome vesicles acting as nanoreactors, and negatively charged proteins playing the role of iron ion-binding sites. With a higher catalytic activity, the magnetic nanocomposite loaded with Fe3O4 nanooctahedra has a sensitive response towards H2O2 detection with a limit of 5 × 10⁻⁶ mol L−1.
An additional benefit of this work is that the magnetic nanocomposite can be recovered more effectively and easily using the hydrogel as a carrier. "Based on the facile, economical fabrication strategy, large-scale production of this magnetic nanocomposite with a tunable peroxidase-like activity can be expected to revolutionize catalysis applications in biotechnology and environmental chemistry."
Source: Geo et al., 2013 [84]
Assignment Details
At the end of this lesson, you will be asked to choose one of the above cases or any other you may find on the Internet for more detailed evaluation. More information can be found on the Lesson 4 Activity Sheet on Canvas.
4.6. Multifunctional Materials and Their Impact on Sustainability
4.6. Multifunctional Materials and Their Impact on Sustainability
Multifunctional materials are the materials that perform multiple functions in a system due to their specific properties. Multifunctional materials can be both naturally existing and specially engineered.
For example, some traditional materials that provide, for instance, high mechanical strength can be modified at the nanoscale to attain other properties such as energy absorption, self-healing, etc. The applications of such new "smart" materials include energy, medicine, nanoelectronics, aerospace, defense, semiconductor, and other industries.
Numerous examples of multifunctional materials can be found in nature. Bio-materials routinely contain sensing, healing, actuation, and other functions built into the primary structures of an organism. For example, the human skin consists of many layers of cells, each of which contains oil and perspiration glands, sensory receptors, hair follicles, blood vessels, and other components with functions other than providing the basic structure and protection for the internal organs. Through biological evolution, these structures were seamlessly integrated into the body to serve their functions (Nemat-Naser et al., 2005).
The ability for materials to respond to their environment in a useful manner has broad technological impact. Such "smart" systems are being developed in which material properties (such as optical, electrical, or mechanical characteristics) respond to external stimuli. Materials of this kind have tremendous potential to impact new system performance by reducing size, weight, cost, power consumption, and complexity while improving efficiency, safety, and versatility. The multifunctionality of materials often occurs at scales from nano through macro and on various temporal and compositional levels (Nemat-Nasser et al., 2005).
Innovative advanced materials make a direct and positive impact on economic growth, the environment, and quality of life. They allow for improved processes and products and create several avenues to increasing sustainability.
Note the following areas of impact:
- reducing environmental effects
- increasing efficiency of processes
- lightening the weight of products
- lowering power consumption
- reducing system size
- reducing system weight
- reducing system cost
- reducing complexity
- increasing safety
- increasing fuel flexibility
- increasing versatility
Most of these impacts may result in higher efficiency of the system and cost savings.
Examples of advanced materials studies
The following are several examples of sustainable solutions through improved materials chemistry or using alternative innovative materials.
A. Power-generating structural composites
"Researchers at ITN Energy Systems and SRI International have integrated a power-generating function into fiber reinforced composites. Individual fibers are coated with cathodic, electrolytic, and anodic layers to create a battery. The use of the surface area of fibers as opposed to that of a foil in a thin film battery allows greater energy outputs, measured on the order of 50 Wh/kg in a carbon fiber reinforced epoxy laminate. These batteries may be deposited on various substrates, including glass, carbon, and metallic fibers."
Source: Nemat-Nasser, S., et al., Multifunctional Materials, Figure 12.2. in Biomimetics: Biologically Inspired Technologies, Bar-Cohen, Y., Ed., CRC Press, 2005. (This book is available online through the Penn State Library system.)
B. Thermostructural materials for gas turbines
Gas turbines are a core technology in aero-propulsion and industrial power generation. Technological progress in this area depends on advances in thermostructural materials. The requirements to reduce emissions, increase fuel flexibility, and resist environmental attack call for development of new material systems with multifunctional properties. University of California Santa Barbara researchers employ a holistic approach that embraces and integrates all critical aspects of materials technology, including alloys, coatings, and composites, processing, and simulations to create the thermostructural materials that combine mechanical strength and exceptional thermal stability. Materials issues relevant to the high-pressure turbine include higher temperature single crystal alloys that act in concert with coatings, advanced bond coat alloys for environmental protection with improved thermochemical and thermomechanical compatibility with the load-bearing alloy, and thermal barrier oxides with new compositions that enhance temperature capabilities. Ceramic matrix composites (CMCs) and associated environmental barrier coatings are also incorporated in next generation engines, especially for combustors.
C. Nanoparticle assembly using DNA strands
"Scientists at the U.S. Department of Energy's Brookhaven National Laboratory have developed a general approach for combining different types of nanoparticles to produce large-scale composite materials with special properties. The approach takes advantage of the attractive pairing of complementary strands of synthetic DNA—based on the molecule that carries the genetic code in its sequence of matched bases known by the letters A, T, G, and C. After coating the nanoparticles with a chemically standardized "construction platform" and adding extender molecules to which DNA can easily bind, the scientists attach complementary lab-designed DNA strands to the two different kinds of nanoparticles they want to link up. The natural pairing of the matching strands then "self-assembles" the particles into a three-dimensional array consisting of billions of particles. Varying the length of the DNA linkers, their surface density on particles, and other factors gives scientists the ability to control and optimize different types of newly formed materials and their properties."
Source: Brookhaven National Laboratory
D. Organic batteries provide better recallability
A typical battery consists of two electrodes - anode and cathode, electrolyte layer, separator, and current collectors. Most of traditional battery technologies use metals or metal oxides as electrode-active materials, and metals are not renewable resources. This study describes the use of organic materials as electrodes. The advantage of such organic-based batteries over Li-ion batteries in terms of sustainability is improved recallability, safety, adaptability to wet fabrication process, and extraction of starting material from less limited resources. One recently developed type of organic battery is based on organic radical polymers - "aliphatic or nonconjugated redox polymers with organic robust radical pendant groups as the redox site". The organic batteries have lower energy density compared to Li-ion technology, but this limitation is expected to be overcome in the near future.
Source: Anastas, P.T., Zimmerman, J.B., Innovations in Green Chemistry and Green Engineering, Chapter 8, pp. 235-246. Springer 2013. (This book is available online through the Penn State Library system.)
Summary & Activities
Lesson 4 introduced a very wide topic - green chemistry - which covers numerous innovations in chemical process design, manufacturing, and materials. Chemistry penetrates almost every aspect of modern technology, so such questions as how the technological components are made, where the starting materials come from, and what happens to them through the lifecycle are pivotal points for decision makers looking for increasing sustainability. There are ongoing efforts in both the US and Europe to develop guidance for assessment of chemical technologies, and a variety of methodologies have been tested so far. There is no unified system of assessment, which is understandable considering the diversity of subjects within the area of green chemistry. What you should take home from this lesson is the understanding of main steps and principles, plus a list of key resources which can help with consistent analysis of emerging chemical technologies. This lesson activity provides you with hands-on practice of examination of a real-life case and should stimulate some critical thinking with respect to what works and what does not in the recommended assessment protocols.
| Type | Assignment Directions | Submit To |
|---|---|---|
| Reading | Complete all necessary reading assigned in this lesson. | |
| Discussion | Chemical exposure: All of us are routinely exposed to a variety of chemicals every day. Some of those exposures are mild and barely noticeable; some are more harmful, but we get used to them anyway; but some of the cases are on the extreme side and pose significant health and life threats. For this discussion, try to recall the worst chemical exposure experienced, either by you or your province or state. Describe briefly your case and try to address the two questions: (1) What was the cause of the exposure (unknown risk, human error, negligence, terror, etc.)? and (2) What prevention measures or green chemistry principles could have been applied to avoid the situation you described? Please read others' posts and comment on at least two of them. Follow up on any questions to your post. Deadline for initial posting – this Sunday; reply to other posts by Wednesday |
Canvas: Lesson 4 Discussion |
| Activity | For this activity, you are asked to conduct quick research on a specific example related to the topic of green chemistry and advanced materials. The main goal of this activity is to develop skills for search of relevant information for understanding technological ideas. Directions:
Please see more guidance on this assignment in the Lesson 4 Activity Sheet posted on Canvas Deadline: Wednesday (before midnight) |
Canvas: Lesson 4 Activity |
References for Lesson 4:
Anastas, P.T., Zimmerman, J.B., Innovations in Green Chemistry and Green Engineering, Springer 2013.
Nemat-Nasser, S., Nemat-Nasser, Sy., Plaisted, T., Starr, A., and Amirkhizi, A.V., Multifunctional Materials, in Biomimetics: Biologically Inspired Technologies, Bar-Cohen, Y., Ed., CRC Press, 2005.
UCLA Sustainable Technology & Policy Program, Developing Regulatory Alternatives Analysis Methodologies for the California Green Chemistry Initiative, Final Report, 2011.
Gao, Y., Wei., Z., Yang, Z.M., Chen, Y.M., Zrinyi, M., and Osada, Y., Green Chemistry, 2014, advance article.
Lesson 5: Resource Management Technologies
5.0 Overview
Overview
The waste management technologies are critically important when we try to visualize a sustainable society. In the growing world, a huge share of the output of the industrial processes and society living is waste, which has a dramatic impact on the environment. Turning the "linear" production economy to a "closed-loop" no-waste economy is a primary task underlined by sustainable design principles. And new designs and new technologies can have a big role in this process both at the local and national level.
There are two issues in resource management story: (1) resource conservation and (2) pollution prevention. When natural resources are extracted and turned into products via a manufacturing process, they become involved in a linear lifecycle - cradle-to-grave. If there is a constant demand for the product, more resources will be extracted, more product manufactured, and more end-of-cycle refuse generated. The limitation associated with the first issue is eventual depletion of the resource (especially if it is non-renewable). The limitation associated with the second issue is reaching the environmental capacity for holding or absorbing the "death" products. These limitations create potential for crisis, which has to be addressed in order to reach system sustainability.
In this lesson, we will take a look at some technologies that seem promising along those lines.
Learning Objectives
By the end of this lesson, you should be able to:
- understand and explain the key sustainable technologies in waste management;
- discuss the closed-loop recycling and zero-waste philosophy principles;
- apply life cycle thinking to waste management systems;
- demonstrate some ways to measure the technical performance of waste management processes.
Readings
- Book chapters: Solid Waste Technology & Management, Christensen, T., Ed., Wiley and Sons., 2011. Chapters 1.1; 3.1; 3.2. (See E-Reserves in Canvas.)
- EPA Document: Municipal Solid Waste Generation, Recycling, and Disposal in the United States: Facts and Figures for 2011 [85], US EPA 2012.
- Journal article: Seeberger, J., et al., Special Report: E-Waste Management in the United States and Public Health Implications [86], Journal of Environmental Health, vol. 79, pp. 8-16 (2016).
-
Website: Types of Composting(link is external) [87], US Environmental Protection Agency, 2013.
- Web Article: Lozanova, S., Are Solar Panels Recyclable, Earth 911, 2018. URL: https://earth911.com/eco-tech/recycle-solar-panels/ [88]
- Web Article: Marsh, J., Recycling Solar Panels in 2018, EnergySage, 2018. URL: https://news.energysage.com/recycling-solar-panels/ [89]
Questions?
If you have any questions while working through this Lesson, please post them to our Message Board forum in Canvas. You can use that space any time to chat about course topics or to ask questions. While you are there, please feel free to post your own responses if you are able to help out a classmate.
5.1 Waste management purpose and strategies
5.1 Waste management purpose and strategies
"In order for something to become clean, something else must become dirty…
But you can get everything dirty without getting anything clean." --Imbesi's Law of the Conservation of Filth with Freeman’s Extension (Dictionary of Proverbs, Ed. Kleiser, S.B.N. A.P.N. Publishing 2005)
The starting point for this lesson is a general overview of the waste management industry. The following reading will introduce you to the main issues related to waste generation, disposal, recycling, and related problems.
Reading Assignment:
Solid Waste Technology & Management, Christensen, T., Ed., Wiley and Sons., 2011.
Chapter 1.1. Christensen, T.H., Introduction to Waste Management, pp. 3-16. (See E-Reserves in Canvas.)
After this reading, you should be able to answer the following questions:
- What are the main problems and risks associated with waste? Why does it need to be treated?
- What is the waste hierarchy? How is it related to sustainable thinking?
- What are the main types of solid waste, and what are the major ways to treat it?
So, how is the problem of waste disposal currently handled? There are a number of established technologies that help remove discarded materials out of our sight. Some of those discarded materials are reused in some form, but much larger amount is dumped or buried in the environment, which creates contained pollution. But is it really contained? And is that practice sustainable?
Watch the following video, which tours waste management facilities near San Francisco. That gives you an idea of the scale of waste accumulation in urban areas and shows what it takes to treat it:
Video: Waste Management and Recycling (9:29)
PRESENTER: Each year, Joe Citizen discards more than half a ton of garbage, everything from empty pizza boxes and eggshells, to broken dishes, appliances, old tires, and the kitchen sink. Worldwide, that's almost a billion tons of stinking trash every year. And somehow all of it needs to be either recycled or otherwise disposed of. So how do they do it? It's 6:00 AM in the San Francisco Bay Area, and Mike Abate and his refuse wrangling colleague, John Fuston, are starting their weekly garbage collection round. For most of us, remembering to put out our trash bins is the end of the story. But in fact, it's just the beginning of an extraordinary, epic journey. A few years ago, strong men had to wrangle your garbage into the back of their truck. These days, a robot arm takes over that duty. One truck for recyclables, another for the truly trashy. Thanks to these robotic refuse collectors, Mike and John can empty 600 bins every trip. And once they're full of trash, the trucks head for a delightful spot known as the Davis Street Transfer Center. Trucks carrying waste for recycling deposit their load here. To you and me, it just looks like rubbish. But to the discerning eye, there's gold in them there hills. Each truckload is worth hundreds of dollars. But no one is going to pay for it in its present state. First, these vast mountains of trash need to be separated into the various components of paper, metals, plastics, and glass. Doing that by hand would require a small army. So it's a good thing they have George Atrestain and a friendly garbage monster known as the single stream recycling facility. GEORGE: It's pretty incredible. It's noisy. It's dirty. It's very unglamorous. But it's a fun place to be. PRESENTER: George's smelly monster is a state of the art garbage sorting machine. Housed in a building that's barely 300 feet long, it contains almost a mile of conveyor belts constantly fed by loaders. It can sort over 300 tons of waste every day and relies on George to keep the wheels turning. First, high power fans blast a jet of air through the trash, suspending lighter paper, metal, and plastic, leaving the heavier glass bottles to fall into a separate pile. Next, a steep conveyor bounces the garbage across a series of rubber wheels. This causes the light paper products to continue upwards, while heavier metals and plastics drop down onto yet another conveyor belt. Powerful electromagnets then whisk away anything made of metal, leaving behind the plastic and other materials. Unfortunately, that's where the machine runs out of tricks. The conveyor transports the remaining waste to a team of operatives, who grade the plastic into various bins under George's eagle eye. GEORGE: This is our container aisle. And it's a fun, noisy, very unglamorous place to be. But most of our staff actually prefer to be up here, because the pace of work is brisk, and there's always a chance of finding someone else's nugget, something fun and exciting. PRESENTER: Once George and his team have finished having their fun, the waste must be prepared for sale and transportation. So it's fed into these high-powered baling machines, which turn everything into identically sized cubes. Each of these bales of paper is now worth around $200, while this bale of aluminum is worth almost 10 times as much. Thanks to their uniform shape, they can be easily lifted with standard forklifts and loaded onto trucks, which will carry them off to start a new life as a pizza box or a coffee cup. But of course, some garbage is just garbage. This stuff is no good to man or beast. So it's about to be sent down into a trashy hell from which nothing returns. This is what George and his chums call the pit. It's huge. It's noisy. And it stinks. It's as deep as a four-story house and the size of a football field. Every week, this monstrous cavern swallows up the waste from over 1 million people. The garbage is heaped in at an extraordinary rate. But where does it go? Underneath the pit is a never ending line of massive 18 wheeler trucks, which park beneath an opening, allowing a combination of bulldozers and grabbers to fill them up. No sooner has one truck been filled to the brim with stinking trash than another appears, ready for loading. Each truck carries five times as much garbage as a dump truck. And once they've accepted their load, they head for the burial ground.
31 miles outside of San Francisco, the trucks finally arrive at the Altamont Landfill site. Right now, it's like the barren landscape of some cold, unfriendly planet. But today's landfill is tomorrow's golf course. Stuck underground in various parts of California sits 1.2 billion tons of waste. The massive basin currently being filled has been lined with clay and a huge impermeable membrane made from high-density polyethylene and geotextile. This lining means each basin acts a bit like a giant plastic container, preventing the waste from contaminating the surrounding soil and water table. Almost half of this waste is organic material like chicken legs and rotten tomatoes. And as it decomposes, it generates potentially explosive gases. What's more, any trapped air can cause potentially dangerous subsidence. So to remove the air and make the trash good to build on, it needs to be squashed. And that's a job for the lords of the landfill, a team of enormous bulldozers and compactors. With over 7,700 tons of waste arriving every day, they must work quickly. First up is the compactor. With a pressure of nearly 40 pounds per square inch, its 50-ton wheels act like giant rolling pins, crushing the waste into solid mass. Next, it's the bulldozers' turn. They cover the waste with a layer of soil and recycled car upholstery known as auto fluff, which helps to seal in the smell and deter scavenging animals. Finally, everything is covered with a permanent layer of soil. But that's not quite the end of the story. Because even this buried waste is put to good use. As the rubbish rots, it gives off valuable methane gas, which is harvested by these wells, which are scattered across the site. The methane extracted feeds a gas turbine, which produces enough electricity to power over 6 and 1/2 thousand homes. What's more, there is also a pilot project to turn some of the methane into liquid natural gas, which will eventually fuel the city's fleet of refuse trucks. So, next time you leave your bins outside of the house for collection, take a moment to ponder the incredible journey it's about to take. And remember, everything you throw away began life underground. Thanks to landfill sites like Altamont, it all ends up back there. Ashes to ashes, dust to dust.
This is how numerous facilities around US currently operate. For the most part, it is so-called cradle-to-grave scheme, when discarded products and waste are recycled to typically lower grade material (i.e., down-cycled) or packed in a landfill. According to EPA, more than 50% of generated solid waste in the US is discarded, i.e., disposed of in the landfill. The following material is an EPA document showing some concrete numbers, which demonstrate how developing recycling technologies help reverse the trend in waste generation.
Reading Assignment:
Municipal Solid Waste Generation, Recycling, and Disposal in the United States: Facts and Figures for 201 [85]2, US EPA 2012.
While reading, look to understand all the diagrams representing the data, and specifically look at the data in Table 1, which gives you an idea on the efficiency of recovery of certain types of waste materials.
Compare Figure 4 with data in the book chapter you read in the beginning of this section (diagram 1.1.5). How does USA rank by waste treatment ratio among European countries?
Answer the following question to check your learning of this section.
Check Your Understanding
What are the five levels of waste management hierarchy? (Input answers below.)
1.2.
3.
4.
5.
Click for answer.
1. Prevention
2. Reuse
3. Recycling
4. Recovery (materials and/or energy)
5. Landfill and burning
From 1 to 5, each next method is more energy and resource intensive and has more adverse environmental impact. The goal of sustainable technologies is to shift the emphasis towards the upper levels.
In the next section, we will overview different recycling approaches and how they fit in the sustainability framework.
5.2. Recycling: open-loop versus closed-loop thinking
5.2. Recycling: open-loop versus closed-loop thinking
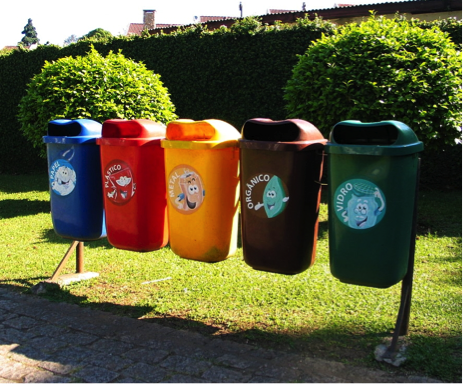
As we can see from the previous page of this lesson, there are a number of conventional methods of waste treatment which depend on the system scale and type of waste. However, not all of them fit in the sustainability picture. For example, such common methods as incineration or landfilling are not sustainable solutions because, while eliminating problem in one zone (for example, human residence or industrial facility), they create additional pollution in the other (atmosphere, soil, aquifers, natural habitat). The purpose of recycling is to minimize or completely avoid sending waste to landfill or incinerator.
There are two major stages in recycling strategy: collection and processing. Both may consume resources and limit the process efficiency. The main recyclables are metals, plastics, glass, paper, and wood. Those materials are common in consumer products, so the public needs to be involved in the process. Public acceptance is important for the success of recollection of those recyclable materials (for example, public awareness and availability of collection points in public places plays a role – see image above). At the stage of processing, the question of recyclability is often related to the product design. How difficult and expensive is it to retrieve those materials from the product? You need to get those materials separated in a pure form in order to make them reusable in the same or new products.
Some skeptical questions we can often hear from the public are: Is recycling really worth it? Would the energy spent on recycling collection, transportation, and processing offset the benefits of the process? Would the emissions associated with that recycling exceed the overall environmental impact of the original trash? Those questions are good to contemplate on and the answers would require a deeper look into the lifecycle of materials.
To refute those commonplace skeptical arguments, the Environmental Protection Agency (EPA) provides some clear evidence on the benefits of recycling to the planet. Here are just a few facts:
- Recycling aluminum cans saves 95% of the energy needed to make new cans from raw aluminum ore;
- Recycling steel cans saves around 60% of energy;
- Recycling paper saves on the average 60% of energy
- Recycling plastic saves about 75% of energy;
- Recycling glass saves about 20-35% of the energy compared to making those products from virgin materials. In fact, the energy saved by recycling one glass bottle will operate a 100 watt light bulb for four hours
- Recycling helps reduce litter, thus mitigating the spread of bacterial or fungal infections.
- Among the social benefits is creation of jobs: ~1.25 million in the United States alone.
It is important to realize that recycling is far from being a universal remedy to the world’s pollution problems, however most experts say it is an important component in the systemic response to the environmental global change, pollution, and other serious issues of this century. [Howard, B.C., 5 Recycling Myths Busted, National Geographic [93] 2018].
Recycling indeed helps to save energy, resources, and prevent greenhouse gas emissions on the lifecycle scale. You can look up more numbers on the Popular Mechanics website [94] which compares recycling rates for aluminum, glass, newsprint, and some plastics, and links those data to market trends.
As seen from this information, an important factor responsible of viability of recycling business is the cost of the new material production. For example, production of virgin aluminum by bauxite mining is so energy-demanding that recycling of drink cans is very economically attractive. On the contrary, glass recycling, while technically simple, does not bring such high benefits, just because making new glass from silica sand is a relatively cheap technology.
Another factor that affects the viability of recycling system is collectability. Plastic recycling is quite profitable, with 76% energy savings compared to new plastic production. However, the case of polystyrene containers shows that if there is no technology to efficiently separate them from other plastics, process fails.
The bottom line here is that recycling heavily relies on development of new advanced technologies and approaches for material processing (without quality loss), collection, and sorting recyclables.
Unfortunately, many cases of recycling only help postpone permanent waste generation. This happens if an original material gradually loses its quality while being recycled and cannot return to the same manufacturing process. It has to be reprocessed to lower-grade products, which are not necessarily recyclable. For example, recycling of polyester soda bottles results in obtaining polymer fibers, which may be supplied to a carpet manufacturer. Carpet, however, is not easily recyclable since it is a more complex product. Polymeric fabrics are combined with other organic products and adhesives to make the final product. Separation of pure components after its use is not feasible; hence, the used carpet becomes a landfill material. This way of recycling, when a material lives a few lives but becomes less and less usable or pure or safe along its way to the landfill, is often termed "downcycling". In terms of sustainability, it means being "less bad", but still not good enough.
At this point, it would be appropriate to look at different concepts in material recycling.
Open-loop Recycling
Open-loop recycling basically means that a material is not recycled indefinitely and is eventually excluded from the utilization loop and becomes waste. The diagram in Figure 5.1. shows a material flow through the linear (open-loop) system. In this representation, stocks are shown with rectangular boxes, and transforming processes are shown by hexagon boxes.
In Figure 5.1. below, we see that natural resources extracted from the environment are transformed into a product via manufacturing process. After its use, the product may be discarded as one of the outputs: (a) whole product that is not needed anymore, (b) whole product that became obsolete (although still functional), (c) non-functional or old product because of its limited lifetime, (d) recyclable / reusable parts or scrapped materials, and (e) non-recyclable refuse. Those outputs enter one of the post-use channels – reuse, recycle, and garbage disposal, the latter contributing to the landfill. Reuse channel is usually limited, just postponing garbage disposal. Recycling loop results in producing another material, which is typically of lower grade and purity than the original material. It may be transformed further into a different product, which after use creates similar outputs. In the long run, a small part of the original resource may be stuck in the loop, but the majority of it becomes disposed of.
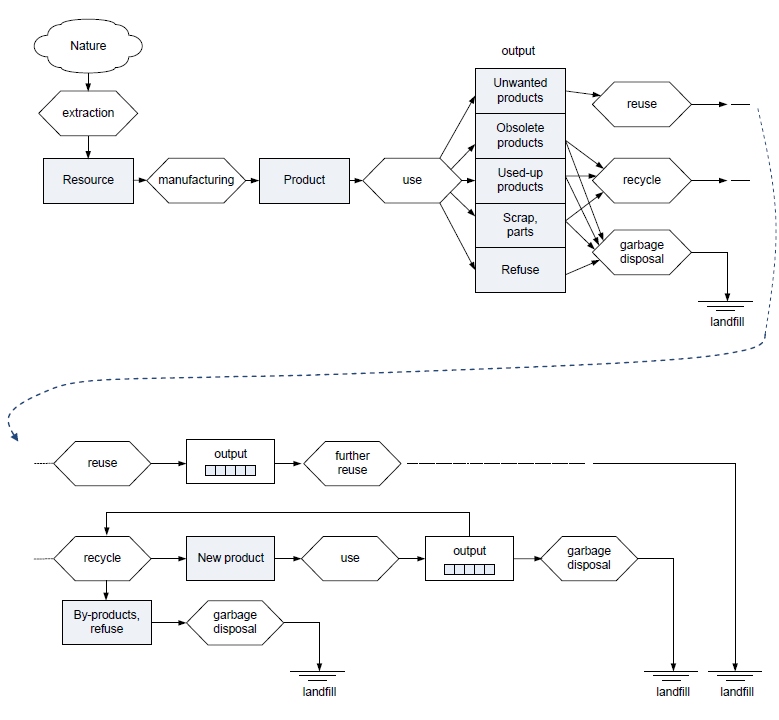
The bottom line is: even if recycling and reuse are involved, eventual down-grading renders material non-usable, and it contributes to waste generation in the end of the lifecycle. Open-loop recycling postpones disposal and slows down extraction of new natural resources, but does not provide an ultimate solution to the problem.
Closed-loop Recycling
Closed-loop recycling is a more sustainable concept, which means that recycling of a material can be done indefinitely without degradation of properties. In this case, conversion of the used product back to raw material allows repeated making of the same product over and over again.
A few things to consider:
- The recycled materials should provide the same quality of the product (no deterioration). For example, almost all recycled aluminum from soda cans is suitable to produce the same cans.
- There should be no accumulation of contaminants or toxins in the multiple recycling loop, which can make the secondary product less safe.
- The recycled material can also feed a manufacturing process for a different product or industry, which may require a different type of recycling.
The other part of closed-loop recycling concept is biodegradable disposal. Everything that cannot be recycled or comes as a by-product in the manufacturing process should return to the environment with no harm. The diagram in Figure 5.2 summarizes the above considerations. While starting from the same extraction, manufacturing, and use stages, the outputs in the closed-loop scheme become equally usable resource for the manufacturing chain. Greater fraction of materials should be designed for recycling and reuse. The refuse that is inevitable is biodegradable and brings no harm when returned to the environment.
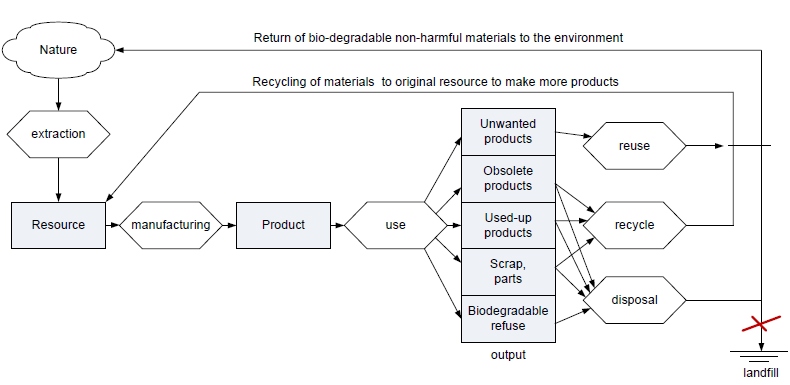
In any sustainability scenario, closed-loop approach is the goal. But it would take radical changes and innovative thinking at the level of product and process design.
To a greater extent, this closed loop thinking is advocated in the book of William McDonough and Michael Braungart “Cradle-to-Cradle”. The authors suggest that every product and all packaging should have a complete closed-loop cycle mapped out for each component, i.e., pathways should be identified for each component to either be recycled indefinitely or to return to the natural ecosystem.
Zero Waste Strategy
When closed-loop resource management is successfully implemented, we ideally should have zero waste produced, as all products at the end of their lifecycle become assimilated by either technical or natural systems to their benefit. In a wider context, zero waste thinking also covers zero emission and zero water pollution. Such targets seem ambitious and require careful life cycle analysis of all steps.
Zero waste concept responds to the principle #6 of sustainable design, "Eliminate the concept of waste. Evaluate and optimize the full life-cycle of products and processes, to approach the state of natural systems, in which there is no waste" [The Hannover Principles., 1992]
"Zero waste philosophy encourages the redesign of resource life cycles so that all products are reused. No trash is sent to landfills and incinerators. The process recommended is one similar to the way that resources are reused in nature." [Source: Wikipedia Zero Waste Article [95] - read this Wikipedia article to learn more about the historical development of this concept].
Zero-waste strategy supports sustainable development through the following pathways:
- Environmental sustainability:
- conservation of natural resources
- minimization of non-degradable waste dumped to the natural ecosystems
- Economic sustainability:
- less waste = higher efficiency => lower cost
- cost of compliance with regulations is reduced
- Social sustainability:
- generation of new jobs
- more resources and energy become available for society
Source: Zero Waste Alliance
It should be noted, however, that zero-waste concept is not equivalent to closed-loop recycling in technical sense. It involves and relies heavily on the design of systems for reuse of products and resources without additional energy and labor expenditures, which are usually required for classic recycling.
Supplemental Reading on Recycling:
The following reading materials contain more information about what materials are recyclable and what happens to them afterward. The article is not freely accessible online, so it is only included as supplemental reading. You may be able to check out a hardcover copy of the Encyclopedia from a local library.
Book Chapter: Lawrence, S.R. et al., Recycling Technology [96], McGraw-Hill Encyclopedia of Science and Technology, 2007, 10th, ISBN 9780071441438, v. 15, pp. 262 - 270
This article provides quite a complete list of materials subject to recycling. It also gives you an idea what methods are used to process those materials and also what further manufacturing chains or markets they enter afterwards. Take a note of those connections.
Book Chapter: McDonough, W. and Braungart, M., Cradle to Cradle. Remaking the Way We Make Things, North Point Press. New York, 2002. Chapter 4: Waste Equals Food, pp. 92-117. This document discusses the concept of sustainable development.
This is a really engaging reading that will make you understand the closed-loop philosophy better. A nice illustration of what design challenge may involve is described on p.105 in the DesignTex case.
5.3. Recycling efficiency
5.3. Recycling efficiency
We understand that recycling materials from the waste stream helps to conserve resources. But the question often arises: How much material can be actually recovered, and is it worth spending energy and labor for it, or it is easier to extract fresh material from the environment? A useful metric to characterize technical performance of a recycling line is recycling efficiency. The general approach to estimate efficiency is as follows:
- Determine the input of the process: Input is measured as the mass or volume of all fractions or materials entering the recycling process per time period (usually per year) - mi(in)
- Determine the output of the process: Output includes the mass of the useful recycled components - mi(out), excluding any unrecycled material sent to refuse. Loss of the components to the refuse can be due to process inefficiencies, such as sorting losses, damages or loss of quality, loss of slag and emissions, accidental presence of non-recyclable items.
- Calculate the efficiency ratio (η) as follows:
Example
Consider the case of recycling Pb-acid batteries. Input will include lead metal (Pb) together with liquids and other solids contained in a battery and also the external jacket. Let us count recovered Pb as useful output, but any chemicals that cannot be salvaged and must be disposed off are not included. Then efficiency of lead recovery can be estimated as: η = mPb(out) / mi(in) x 100%
Let us imagine that a small recycling facility treats 13,000 kg of old batteries per year. If the amount of the recovered lead is for example 7,000 kg per year, then
η = 7,000 / 13,000 × 100% = 54%
That means that the other 46% of material supplied to the recycling process is lost or discarded (e.g., non-recyclable acid and other chemicals, slag, etc.). Note, the above numbers are randomly picked and used merely for example.
100% efficiency is possible only in the ideal case when no waste is sent to the landfill or incineration.
Source: adopted from the method described in the EU Commission Regulation 6/11/2012
5.4. Management of food waste and composting technologies
5.4. Management of food waste and composting technologies

Food waste accounts for 14.5% of all generated waste in the US according to EPA report, and only a small portion of it is recovered (1.6%). At the same time, food waste contains loads of nutrients that can be returned to the environment, but it should be done the right way. Disposing of the organic waste in the landfill results in the generation of methane, which can pose a threat or contribute to the greenhouse effect. Hence, developing composting technologies is an important part of a sustainable waste management system.
Compost is a stable organic mixture resulting from the breakdown of organic components; it is typically dark brown or black and contains humus which provides a soil-like, earthy smell. Compost is widely used as fertilizer and soil amendment in agriculture. It is created by piling organic wastes (garden waste, leaves, food waste, manure) with bulking agents (e.g., wood chips) to provide an environment for anaerobic bacteria and fungi to manage the chemical decomposition process. Compost is stabilized through maturation and curing process.
According to US EPA, there are a number of benefits of the composting process. These include:
- reduction and elimination of the need for chemical fertilizers;
- increasing of crop yields;
- facilitation of reforestation, wetland restoration, and habitat revitalization by amending contaminated, compacted, and marginal soils;
- cost-effective remediation of soils contaminated by hazardous waste;
- absorption and removal of solids, oil, grease, and heavy metals from stormwater runoff;
- avoidance of methane and leachate formation in landfills;
- decreased need for water, fertilizers, and pesticides in agriculture;
- serving as a marketable commodity and as a low-cost alternative to standard landfill cover;
- capturing and destruction of 99.6 percent of industrial volatile organic chemicals (VOCs) in contaminated air;
- more cost-effective soil, water, and air remediation compared to conventional technologies;
- extension of municipal landfill life by diverting organic materials from landfills.
Certain physical conditions need to be provided for proper composting process. There are different types of processes, which are overviewed in the following reading.
Reading Assignment:
EPA Website: Types of Composting [87], US Environmental Protection Agency, 2013.
Watch this short video that illustrates an industrial-scale composting facility in the UK. This is only one of the ways to do it. Which type of composting (from those listed by EPA) is this facility using?
Video: Hi-Tech Composting Plant (5:40)
LEON MEKITARIAN: Organic recycling is a mucky business. There's no point in being precious about it, yeah? It's dirty. It's smelly. It's basic. It's elemental. Linking what we do back to agriculture is nothing new. The Norfolk four course rotation, on which agricultural fertilizing has been founded since time immemorial, is based on returning organic manures and materials to land as fertilizers. We just got lazy in the last 40 years and bought them from an oil pipeline instead. Currently, food waste is rejected from restaurants, hotels, school canteens, and the kitchen table, put into the domestic refuse bag, and taken away and sent to landfill. Food waste in landfill generates methane. Methane is 18 times more damaging to the ozone layer than CO2 emissions. So every kilogram of food waste that ends up in landfill has the potential to dramatically increase greenhouse gases. Recycling of food waste is one of the most important things you can do. It's better for the environment than changing your car for a hybrid. The great thing about this process is it's self-heating. It's called autothermal thermophilic aerobic digestion. That's a bit of a mouthful. It basically means it's a self-heating compost heap. So, we use minimal energy here and let the bugs do all the work. This is a controlled natural reaction. All we're doing is capturing that reaction, harnessing it, and supercharging it. This plant operates at 75 degrees centigrade, which is a temperature that pasteurizes the food waste material, eliminating all risks of disease and pathogens. It does that by using the naturally occurring bacteria, which we harness in these digestive vessels, and process the waste very efficiently under its own steam. So, there's no artificial heat used in this process, unlike a lot of other technologies, to comply with the regulations which we operate under. We made a conscious decision to locate inside the greater London area. London has a huge food waste problem. There is over a million tons per year. Most of the food waste isn't collected. It goes to landfill. What is collected is transported 60 miles out to Kent and Bedford for treatment. The road miles into our plant are typically eight miles. Waste is delivered into the site, tipped into the silo. The silo moves it to the shredder. The shredder grinds up into little bits. Metals and plastics are extracted. We end up with a thick porridge. These vessels are aerated. And we establish a colony of naturally occurring bacteria, which break down and digest the food waste. At the end of the process, it's stabilized and fully treated. We put it through a de-watering plant and turn it into a solid fertilizer that looks like compost. Our process here is carbon positive in operation. And that stands alone in all technologies that are currently deployed in the UK today. And we achieved that in the main from our end product. Our process in itself is very efficient and has a high throughput, occupies a small footprint and low land use. That's all good. An existing building is also carbon beneficial. But the key element of our carbon positivity is in our end product. Fertilizer that Vertal produces contains all the essential nutrients that are required to grow a commercial crop, be that wheat, be that barley, be that oilseed rape. Displacing the use of petrochemical and derived inputs, which are reliant on oil and gas for their production, and as a result are intensely carbon negative, has huge environmental benefits. Most of the food that is consumed in the world is produced because of the advances made in agriculture since the Second World War. We're now in the post-development phase, where the consequences of the success and the profligacy of the last 50 years are coming home to roost. The world is at a carbon crossroads. Major strategic decisions have got to be made right across the world. What we can do is to start to address the carbon imbalance. We're diverting waste from landfill, reducing carbon emissions in transport. And we're making fertilizer. Waste is a dirty business. People don't want to know, generally. Before recycling, it was all in landfill. It was all causing an environmental hazard. It was causing a smell. It was something that didn't want to be discussed. That's now starting to change. People are much more interested in what happens to the waste. Much more interested in the environmental impacts of waste treatment. And people are becoming more informed. And that's only a good thing. This is part of the sustainable loop. Our process completes the recycling circle. What you scrape off the plate is helping to grow your next meal, your next loaf of bread. It's as simple as that.
While having obvious benefits, composting is far from being environmentally clean. When organic components are mixed and concentrated during waste collection, they create aggressive gases and liquid effluents, which should be carefully controlled. In the diagram in Figure 5.3. The side inputs and outputs accompanying the composting process are shown. The pre-composting weighing and pre-processing stages generate liquid leachate, gas exhausts, and solid residue as by-products. The composting stage requires input of air and water, while generating more potentially polluting exhaust and effluents. Some of the residue is reusable, but some is not and need to be disposed of as non-recyclable waste.
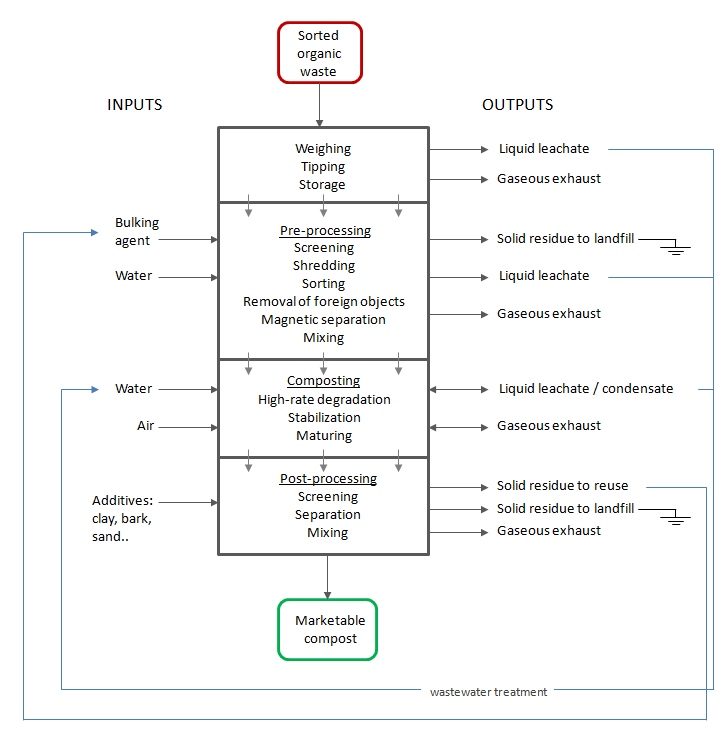
Criteria that usually play a role in environmental and economic assessment of composting process are: energy use, transportation, land use, air quality. An example of multi-criteria analysis is presented in the “composting versus landfill case study, referenced below:
Reading Assignment:
Book Chapter: Solid Waste Technology & Management, Christensen, T., Ed., Wiley and Sons., 2011. (See E-Reserves via Canvas.)
Chapter 3.2. Christensen, T.H., LCA in Waste Management: Introduction of Principle and Method, Section 3.2.4.1. pp. 153-155.
Please study this example, and while reading try to get answers to the following questions:
- What are the pros and cons of composting compared to landfill?
- Which factors need to be taken into account to make composting a low-impact practice?
- What criteria / metrics did authors use in their assessment?
Supplemental Reading:
Book Chapter: Solid Waste Technology & Management, Christensen, T., Ed., Wiley and Sons., 2011
Chapter 9.2. Krogmann, U., Korner, I., Diaz, L., Introduction to Waste Management, pp. 533-565.
Interested in more technical details of composting technology? Refer to this reading material, which contains much of the technical information needed for specialists in this area.
This book is available online through PSU Library system.
5.5. E-waste stream management
5.5. E-waste stream management
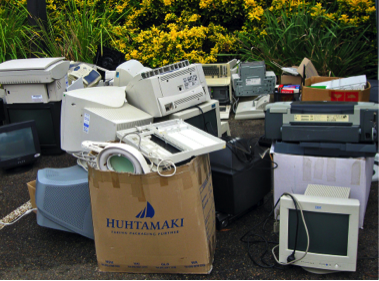
There are reasons to separate the electronics waste stream:
- rapid growth of the electronic manufacturing volume, market, and rapid change in technology resulting in new products
- complexity of electronic products, which requires special approach in recycling
- use of rare and precious metals and compounds, many of which should be recovered
- presence of toxic chemicals and other substances of environmental concern
- opportunities of efficient material and component reuse
Electronics recycling, computers for instance, is essentially a process of breaking down the final product back to components (some of which can be reused) and initial raw materials (such as copper, gold, silver, other metals, plastics). Because of significant load of technological product with heavy metals and toxic compounds (e.g., mercury, cadmium, lead, flame retardants), discarded electronics are classified as hazardous waste. Hence, recycling also requires strict measures of environmental safety.
Reading Assignment:
The following article provides a concise overview of current practices to handle electronic waste in the United States and specifically investigates the health implications and policies required to mitigate the negative impacts. The article contains statistic data on specific parts and components in electronics that are subject to recycling and shows their linkage to chemical resource lifecycles:
Seeberger, J., et al., Special Report: E-Waste Management in the United States and Public Health Implications [101], Journal of Environmental Health, vol. 79, pp. 8-16 (2016).
This paper is available online through the Penn State Library system. Students registered for the course can also access it in Canvas.
Try to find the answers to the following questions, while reading:
- What chemical elements used in electronic products present the highest risk to the public health?
- Can we assume from the EPA data in Figure 2 that e-recycling industry grew in the US and technologies became more efficient?
- What kind of policies need to be adopted to streamline safe disposal of the electronic waste?
There are companies and government programs that take on the challenge of responsible recycling of electronic products; for example, watch this short video about how Liquid Technology helps companies manage their e-waste while protecting the environment from hazardous materials:
Video: How Does Computer Recycling Work? (1:17)
PRESENTER: --decisions. What computer should we buy? And probably even more challenging-- what should we do with the old ones? When it comes to disposal, a lot is at stake. Despite recent improvements, electronics are still made with toxic materials. For example, monitor glass and circuit boards contain large quantities of lead, which cause birth defects, nervous system disorders, and brain dysfunction, especially in children. Other very-toxic metals, such as mercury, beryllium, and cadmium, are found in the equipment as well. The plastics also are a problem, as they contain highly-polluting flame retardants. Apart from the environmental and health impacts, there are other risks. Unless we take great care to totally erase our very-confidential data stored in our computers, digital assistants, and cell phones, our privacy is at risk. Businesses become vulnerable to the loss of intellectual property or confidential customer data, which can lead to criminal and civil liabilities that can cost millions. Most individuals and companies want to dispose of their e-waste responsibly, so they seek out an electronics recycler or asset recovery company. Unfortunately, all too often these e-waste recyclers are not recyclers at all. SARAH WESTERVELT: We've all seen these claims of electronics recyclers and asset recovery companies who will tell you they are diverting this equipment from landfills, they're in compliance with all regulations, and they are using environmentally sound recycling. But the fact is that US and Canadian regulations do not adequately cover this toxic waste stream. So we have plenty of companies who are simply loading up seagoing containers and sell it to the highest bidder, frequently to countries in Africa and Asia. So they're getting rich at the expense of your goodwill, and your data security, and ultimately human health and the environment. PRESENTER: Few had witnessed the cyber age nightmare in China until the Basel Action Network-- BAN-- had set an investigative team to Guangdong Province in 2001. Since it began receiving its first load of imported e-waste about 12 years ago, the Chinese township area of Guiyu has been transformed from a small rice-growing village into a bustling, sprawling junkyard for much of the world's electronic waste. BAN revisited the scene again in 2008, only to find that things had gotten far worse. In the Guiyu area, one can find whole villages of migrant workers from China's rural regions living among the piles of e-waste. They sort computer components and openly burn them in fields or large indoor fireplaces, releasing toxic smoke and ash. Toner powder is inhaled as it's swept by hand from cracked, discarded printer cartridges. Thousands of people are employed cooking circuit boards over coal-fired burners, breathing in the lead tin solder vapors for hours on end as they pluck the chips off the boards. The chips are then taken in buckets to primitive acid stripping operations along the riverways where hot acid baths are used to extract tiny fractions of gold while workers breathe the toxic fumes and flush residues right into the river. Computer monitors are cracked open, and leaded glass is dumped into old irrigation ditches. All of the well water in Guiyu is now contaminated. Samples taken by BAN in the local river revealed levels of lead 2,400 times the World Health Organization's threshold level for drinking water. And since BAN's first visit, scientists have conducted further analyses of human hair, water, sediments, and rice, and have recorded some of the highest levels of dioxins, brominated flame retardants, heavy metals, and other pollutants ever discovered anywhere on earth. BAN's next investigative assignment took them to Lagos, Nigeria, a sprawling metropolis and port for much of West Africa. Computers and other IT equipment increasingly arrive on African shores from Europe and America, ostensibly to be sold in the marketplace to be re-used. Exporters can claim that this practice extends the lives of computers, helps the poor, and allows them to bridge the digital divide. Unfortunately, the vast majority of computers, televisions, monitors, and printers that arrive in Lagos each month were found to be nonfunctional and non-repairable. They end up stacked in cavernous warehouses, or more often dumped near residential areas and burned, releasing persistent highly-toxic pollutants into the air and water. JOHN OBORO: I would tell you that we have greater percentage of those that cannot be used than those that can be used. Honestly speaking, I would say 75% of these items are not usable. OLADELE OSIBANJO: The gases are very hazardous. There are no shields. They contain toxic components. They are quite carcinogenic substances. And the incidence of such terrible diseases like cancer is very high now in Nigeria. Hazardous waste should not go from developed to developing. So the exporting country must put in strict controls and follow their own regulatory regime. If we are talking of a global village, a common future, a common destiny for all the peoples of the world, it is only fair-- morally right-- to be sure that all sides are safe at the end of the day. PRESENTER: It's not difficult to learn the identities of those that are careless about the eventual impact of their techno trash. Brand names and institutional asset tags sometimes remain on the equipment. But even when tags have been peeled off, it can be shocking to find what is hidden below the surface. As part of its investigation into the origins of e-waste found in Nigeria, BAN purchased secondhand hard drives in the market and sent them to a cyber investigative service located in Zurich, Switzerland. GUIDO RUDOLPHI: It's child's play to recover them. And so after only a little bit of time that you have to invest, you can find a lot-- a tremendous lot of data on those files from the former users. For the companies it's very risky. They cannot track back what they are distributing all over the world. You find confidential material on those hard drives, calculations, CVs from employees, private mail-- so, a lot of stuff that really, really shouldn't get out of their hands. PRESENTER: The trade in toxic wastes leaves the poor people of the world with an untenable choice between poverty and poison, a choice that nobody should have to make. In 1989, the global community came together in Basel, Switzerland to sign an international treaty designed to stop the international dumping of toxic waste. And in 1995, the Basel Convention passed a full ban on the export of hazardous wastes, including electronic waste from developed countries to developing countries. All 27 European countries have already made it illegal to ship toxic waste to developing countries for any reason. But to date, the US is the only developed country in the world that has not ratified the Basel Convention. And in fact, the United States and Canada continue to actively work to undermine the waste export ban. Meanwhile, unscrupulous recyclers have taken advantage of the uneven playing field and freely export massive volumes of electronic waste each year while their governments look the other way. It was for this reason that BAN together with the Electronics TakeBack Coalition created the e-Stewards initiative. SARAH WESTERVELT: The federal government has been horribly negligent by failing to control toxic waste exports to developing countries. So we've had to turn to the best players in the industry who are willing to go well beyond compliance. e-Stewards are North American recyclers and asset recovery companies who have agreed to the highest level of responsible recycling and reuse. PRESENTER: One of these companies is Redemtech, based in Columbus, Ohio. ROBERT HOUGHTON: We've built our business around doing the right thing socially and environmentally. Since we need to operate safe and secure facilities, pay our associates a living wage, we've invested in technology to ensure that every bit of customer data is reliably eradicated and that every pound of e-waste is properly recycled. I'm encouraged that when people learn about the toxic trade in scrap electronics they want to work with responsible recyclers. But it's not easy telling the good from the bad. e-Stewards are willing and able to prove that they're operating responsibly. And people that care must insist on that accounting. PRESENTER: Now, thanks to the e-Stewards Initiative, finding a globally-responsible electronics recycling or asset recovery company is easy. The next task is to enlist all consumers, large and small, to do the right thing and agree to make exclusive use of these leaders and avoid the laggards in the industry. The real answer surely lies not in passing our electronic waste to those least able to deal with it, but in responsibly refurbishing or recycling it here at home.
However, currently existing programs of sorting / disassembly are hardly sufficient. The problem is that current computer and other electronic products are not designed to be recycled. End-of-life disassembly and recovery of pure materials is a tedious and expensive process. Few companies manage to build an effective infrastructure for electronic recycling. Even if responsible recycling practices exist, they hardly keep up with growing market for electronics and accelerating e-waste accumulation pace.
Unfortunately, there are businesses that find it more profitable to export the electronic waste overseas to developing countries. This practice, highly non-sustainable on the global scale and harmful to local population and environment, is an ugly illustration of shifting the environmental burden from one part of the global system to another:
For example, this video contains graphic illustrations of such irresponsible “recycling”.
Video: Responsible e-waste recycling: Basel Action Network E-Waste Film (10:00)
PRESENTER: --decisions. What computer should we buy? And probably even more challenging-- what should we do with the old ones?
When it comes to disposal, a lot is at stake. Despite recent improvements, electronics are still made with toxic materials. For example, monitor glass and circuit boards contain large quantities of lead, which cause birth defects, nervous system disorders, and brain dysfunction, especially in children. Other very-toxic metals, such as mercury, beryllium, and cadmium, are found in the equipment as well. The plastics also are a problem, as they contain highly-polluting flame retardants.
Apart from the environmental and health impacts, there are other risks. Unless we take great care to totally erase our very-confidential data stored in our computers, digital assistants, and cell phones, our privacy is at risk. Businesses become vulnerable to the loss of intellectual property or confidential customer data, which can lead to criminal and civil liabilities that can cost millions.
Most individuals and companies want to dispose of their e-waste responsibly, so they seek out an electronics recycler or asset recovery company. Unfortunately, all too often these e-waste recyclers are not recyclers at all.
SARAH WESTERVELT: We've all seen these claims of electronics recyclers and asset recovery companies who will tell you they are diverting this equipment from landfills, they're in compliance with all regulations, and they are using environmentally sound recycling. But the fact is that US and Canadian regulations do not adequately cover this toxic waste stream. So we have plenty of companies who are simply loading up seagoing containers and sell it to the highest bidder, frequently to countries in Africa and Asia. So they're getting rich at the expense of your goodwill, and your data security, and ultimately human health and the environment.
PRESENTER: Few had witnessed the cyber age nightmare in China until the Basel Action Network-- BAN-- had set an investigative team to Guangdong Province in 2001. Since it began receiving its first load of imported e-waste about 12 years ago, the Chinese township area of Guiyu has been transformed from a small rice-growing village into a bustling, sprawling junkyard for much of the world's electronic waste. BAN revisited the scene again in 2008, only to find that things had gotten far worse.
In the Guiyu area, one can find whole villages of migrant workers from China's rural regions living among the piles of e-waste. They sort computer components and openly burn them in fields or large indoor fireplaces, releasing toxic smoke and ash. Toner powder is inhaled as it's swept by hand from cracked, discarded printer cartridges. Thousands of people are employed cooking circuit boards over coal-fired burners, breathing in the lead tin solder vapors for hours on end as they pluck the chips off the boards.
The chips are then taken in buckets to primitive acid stripping operations along the riverways where hot acid baths are used to extract tiny fractions of gold while workers breathe the toxic fumes and flush residues right into the river. Computer monitors are cracked open, and leaded glass is dumped into old irrigation ditches.
All of the well water in Guiyu is now contaminated. Samples taken by BAN in the local river revealed levels of lead 2,400 times the World Health Organization's threshold level for drinking water. And since BAN's first visit, scientists have conducted further analyses of human hair, water, sediments, and rice, and have recorded some of the highest levels of dioxins, brominated flame retardants, heavy metals, and other pollutants ever discovered anywhere on earth.
BAN's next investigative assignment took them to Lagos, Nigeria, a sprawling metropolis and port for much of West Africa. Computers and other IT equipment increasingly arrive on African shores from Europe and America, ostensibly to be sold in the marketplace to be re-used. Exporters can claim that this practice extends the lives of computers, helps the poor, and allows them to bridge the digital divide.
Unfortunately, the vast majority of computers, televisions, monitors, and printers that arrive in Lagos each month were found to be nonfunctional and non-repairable. They end up stacked in cavernous warehouses, or more often dumped near residential areas and burned, releasing persistent highly-toxic pollutants into the air and water.
JOHN OBORO: I would tell you that we have greater percentage of those that cannot be used than those that can be used. Honestly speaking, I would say 75% of these items are not usable.
OLADELE OSIBANJO: The gases are very hazardous. There are no shields. They contain toxic components. They are quite carcinogenic substances. And the incidence of such terrible diseases like cancer is very high now in Nigeria. Hazardous waste should not go from developed to developing. So the exporting country must put in strict controls and follow their own regulatory regime. If we are talking of a global village, a common future, a common destiny for all the peoples of the world, it is only fair-- morally right-- to be sure that all sides are safe at the end of the day.
PRESENTER: It's not difficult to learn the identities of those that are careless about the eventual impact of their techno trash. Brand names and institutional asset tags sometimes remain on the equipment. But even when tags have been peeled off, it can be shocking to find what is hidden below the surface. As part of its investigation into the origins of e-waste found in Nigeria, BAN purchased secondhand hard drives in the market and sent them to a cyber investigative service located in Zurich, Switzerland.
GUIDO RUDOLPHI: It's child's play to recover them. And so after only a little bit of time that you have to invest, you can find a lot-- a tremendous lot of data on those files from the former users. For the companies it's very risky. They cannot track back what they are distributing all over the world. You find confidential material on those hard drives, calculations, CVs from employees, private mail-- so, a lot of stuff that really, really shouldn't get out of their hands.
PRESENTER: The trade in toxic wastes leaves the poor people of the world with an untenable choice between poverty and poison, a choice that nobody should have to make. In 1989, the global community came together in Basel, Switzerland to sign an international treaty designed to stop the international dumping of toxic waste. And in 1995, the Basel Convention passed a full ban on the export of hazardous wastes, including electronic waste from developed countries to developing countries. All 27 European countries have already made it illegal to ship toxic waste to developing countries for any reason. But to date, the US is the only developed country in the world that has not ratified the Basel Convention. And in fact, the United States and Canada continue to actively work to undermine the waste export ban. Meanwhile, unscrupulous recyclers have taken advantage of the uneven playing field and freely export massive volumes of electronic waste each year while their governments look the other way. It was for this reason that BAN together with the Electronics TakeBack Coalition created the e-Stewards initiative.
SARAH WESTERVELT: The federal government has been horribly negligent by failing to control toxic waste exports to developing countries. So we've had to turn to the best players in the industry who are willing to go well beyond compliance. e-Stewards are North American recyclers and asset recovery companies who have agreed to the highest level of responsible recycling and reuse.
PRESENTER: One of these companies is Redemtech, based in Columbus, Ohio.
ROBERT HOUGHTON: We've built our business around doing the right thing socially and environmentally. Since we need to operate safe and secure facilities, pay our associates a living wage, we've invested in technology to ensure that every bit of customer data is reliably eradicated and that every pound of e-waste is properly recycled. I'm encouraged that when people learn about the toxic trade in scrap electronics they want to work with responsible recyclers. But it's not easy telling the good from the bad. e-Stewards are willing and able to prove that they're operating responsibly. And people that care must insist on that accounting.
PRESENTER: Now, thanks to the e-Stewards Initiative, finding a globally-responsible electronics recycling or asset recovery company is easy. The next task is to enlist all consumers, large and small, to do the right thing and agree to make exclusive use of these leaders and avoid the laggards in the industry. The real answer surely lies not in passing our electronic waste to those least able to deal with it, but in responsibly refurbishing or recycling it here at home. /p>
So, what are possible sustainable solutions to address the root of the e-waste problem?
- Design devices with environmentally benign components and chemicals.
- Design computers and other fast-rotating systems easily recyclable (to cut cost and increase process efficiency).
- Design “product-of-service” programs. This is exemplified in the book Cradle-to-Cradle as follows:
"Instead of assuming that all products are to be bought, owned, and disposed of by “consumers”, products containing valuable technical nutrients – cars, televisions, carpeting, computers, and refrigerators, for example – would be preconceived as services people want to enjoy. In this scenario, customers would effectively purchase a service of such a product for a defined user period – say, then thousand hours of television viewing, rather than the television itself. They would not be paying for complex materials that they won’t be able to use after a product’s current life. When they finish with the product, or are simply ready to upgrade to a newer version, the manufacturer replaces it, taking the old model back, breaking it down, and using its complex materials as food for new products." [McDonough and Braungart, 2002]
Currently in the US, many states have active policies to regulate the e-waste. Different models suggest imposing fees to finance e-waste recycling onto various entities – consumers, manufacturers, municipalities. There are also different mechanisms to facilitate collection and processing of the e-waste. Some examples are given in the following reading:
Supplemental Reading:
Want to learn more? This following article provides a detailed overview of materials to be recovered from the consumer electronics and methods involved in management of this growing waste stream:
Solid Waste Technology & Management, Christensen, T., Ed., Wiley and Sons., 2011. Chapter 11.2. “Waste Electrical and Electronic Equipment”, Bigum, M. and Christensen, T.H., pp. 960-968.
This book is available online through PSU Library system.
Check Your Understanding
Apparently, present-day computers are not perfectly designed for end-of-life recycling. Can we estimate the efficiency of recycling of an average desktop computer?
According to the approach outlined in Section 5.3 of this lesson, can you calculate the efficiency of recycling of an average desktop computer based on the following data?
| Input / Output | Component | mass | |
|---|---|---|---|
| input | mass of the computer placed in the recycling bin | 6000 g | |
| useful output | mass of salvaged old components for reuse | fan | 100 g |
| wires | 300 g | ||
| power supply | 1000 g | ||
| memory chips | 100 g | ||
| cpu | 200 g | ||
| optical drive | 500 g | ||
| mass of salvaged raw materials for making new components | Cu | 200 g | |
| Al | 300 g | ||
| steel | 600 g | ||
| Precious metals (Au, Ag) | 1 g | ||
| recyclable plastics | 900 g |
Click for answer.
Efficiency can be estimated as
h = total mass of all useful output materials / total mass of material submitted for recycling = =(100+300+1000+100+200+500+200+300+600+1+900) g / 6000 g x 100% = 70% ]
5.6. Solar PV Recycling
5.6. Solar PV Recycling
- The Next Big Thing on the Trash List – Solar?
Solar power is probably the fastest-growing market in the world. According to Solar Energy Industries Association [106] (SEIA), in the past decade, solar power industry experienced an average annual growth rate of ~59%. An estimated 500,000 solar panels were installed globally every day in 2015. If we think of rooftops, a typical American home would require 28 to 34 solar panels to cover its power consumption. The U.S. Department of Energy forecasted that by 2050, the U.S. will have cumulatively installed 700 GW of solar, or hundreds of billions of PV modules [Mulvaney, 2015].
But here is the question: What will happen to the billions of those solar panels now spreading across the globe at the end of their useful lives?
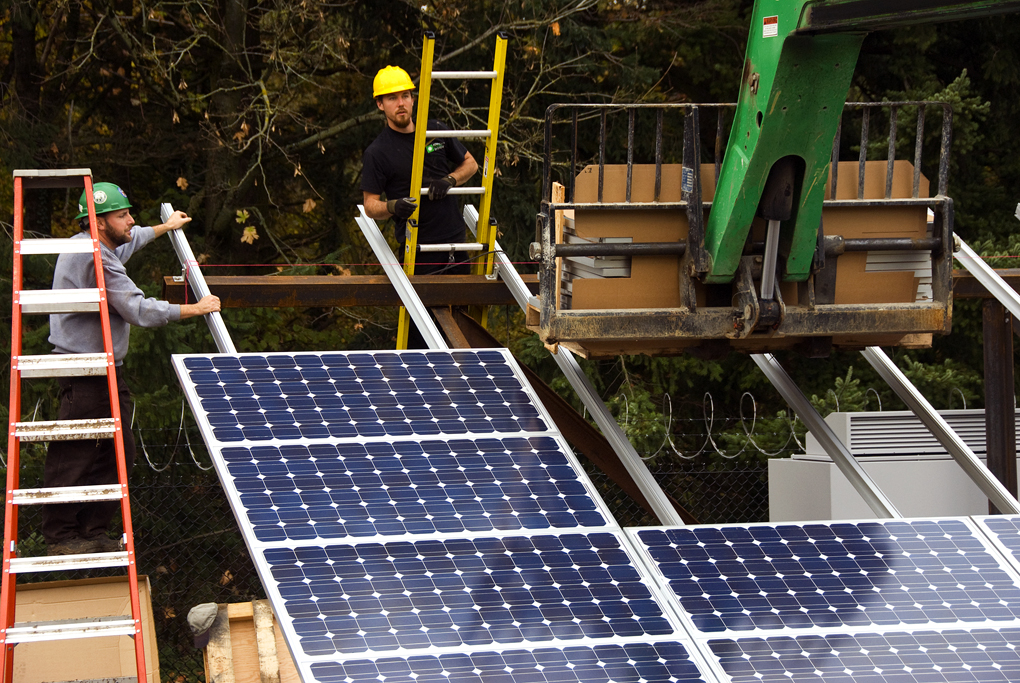
On the average, solar photovoltaic (PV) modules have a useful lifespan of 25-30 years, so with the current growth rates, the first peak of PV waste can be expected around 2030. And there is still some time to plan ahead. Now, as we know how externalities have magnified due to the lack of foresight with fossil fuels, there is an opportunity to do things right with solar.
As the photovoltaic panels contain a variety of valuable metals and materials, which are mined and refined at increasing rates, it is imperative to create recycling methodologies, infrastructure, and policies to maintain the flow of those materials within the industry. This important action would address two problems – waste regulation and resource depletion.
What are the current US domestic programs designed to address the growing PV waste flow? Until recently, the regulations on PV waste did not exist in the USA, except California. However, things have to change soon. In lieu of introduction to this problem, the video below talks about some of the emerging options and initiatives, many of which utilize the successful experience of the European recycling programs:
Video: Solar Basics: How to plan ahead for U.S. solar panel recycling (3:15)
Welcome to solar basics. I'm Kelsey miss Brenner, senior editor of solar power World. I'm Haley Pickerel, editor-in-chief.
In about 30 years, a wave of thirty-five point three million panels may reach the end of their lifespans. Not counting the hundreds of millions of panels that flooded the US market in the last decade that may need to be disposed of sooner. With no dedicated national program or requirements to safely dispose of solar panels, some unfortunately find their way to landfills. If the system owner is green minded and has the money, panels may get shipped to a recycling facility.
Other industry players are warehousing damaged or old panels until a practical recycling program is established and a few colleagues from consulting company, Solar Cowboys, have started a new recycling program in the U.S. called recycle PV. Modeled after a successful European program called, PV Cycle. The Electric Power Research Institute found system owners recycle their panels in Europe because they are required to. Panel recycling in an unregulated market like the United States, will only work if there is value in the product.
Though there's nothing yet mandated at a national level in the u.s., there are a few states trying to get the required recycling ball moving. In July 2017, Washington became the first state to pass a solar stewardship bill requiring manufacturers, selling solar products into the state, to have end-of-life recycling programs for their own products.
New York passed a similar Senate bill last year that has since been passed to the state assembly. The bill would require solar panel manufacturers to collect end-of-life panels for recycling. In addition to those states, one panel manufacturing company has prioritized recycling. Cad-tel thin-film module manufacturer first solar established a recycling program at the beginning of production to responsibly recycle a manufacturing scrap, warranty returns, and end-of-life panels. This environmental decision also had a financial motivation. But tellurium used in the product is a finite resource.
In any case, First Solar's recycling facilities, attached to its manufacturing plants, have the capacity to recycle two million panels globally on an annual basis. For crystalline silicon modules needing recycling now in the United States, there are a few scattered options. Various glass and electronics recyclers have taken on solar panel recycling but usually not on dedicated lines are on a grand scale.
Industry advocacy groups SIA has begun organizing recycling efforts through its PV recycling working group. The organization will choose preferred recycling partners that offer benefits to SIA members. Time is ticking for panel recycling, the United States has about 15 years before solar panel recycling becomes a major issue. That's plenty of time to figure out the best course of action, but also plenty of time to procrastinate. Here's hoping we set early deadlines.
For more on solar panel recycling, read our story online and stay tuned for the next Solar basics videos.
Reading Assignment
These two short articles outline some options for PV recycling available in the US and in Europe. For example, “PV Cycle, a European solar panel recycling association, developed a mechanical and thermal treatment process that achieves 96% recovery rate for silicon-based photovoltaic panels.” This sounds quite impressive! “The remaining 4 percent is utilized in an energy recovery process, using a waste-to-energy technology.”
Web Article: Lozanova, S., Are Solar Panels Recyclable, Earth 911, 2018. URL: https://earth911.com/eco-tech/recycle-solar-panels/ [88]
Web Article: Marsh, J., Recycling Solar Panels in 2018, EnergySage, 2018. URL: https://news.energysage.com/recycling-solar-panels/ [89]
There are a number of recyclable components included in PV module – some of those are rare, and some of those are toxic and thus require a proactive plan for recycling. Crystalline Si PV modules, in addition to silicon, contain materials such copper, aluminum, silver, and glass. CdTe PV modules contain cadmium, steel, and copper. Metal components are usually much more expensive than non-metal materials, and extracting them during recycling process and reusing in manufacturing brings sensible economic benefits. Materials such as silicon wafers are critical to recycle, as a substantial amount of energy is spent to purify them for use in PV modules. Thin-film modules contain such elements as tellurium, indium, gallium, and molybdenum, which are in limited supply in the Earth’s crust. Indium is the element that will face resource use competition between solar and flat-screen displays. [Williams, B., 2016]
The following webinar (International Solar Energy Society - ISES) presents an extended overview of PV recycling practices, policies, and current research innovations around the world. The first talk is more on the legal background and policies existing in different countries. The second presentation explores the way to incorporate PV panel reuse practice in circular economy. The last presentation in the webinar goes deeper into the weeds of the recycling process itself. You will see the actual equipment used for the mechanical, chemical, and thermal extraction of materials from the discarded panels.
Video: ISES Webinar: PV Recycling and End of life Processing (1:22:01)
Transcript will be uploaded soon
If you want more insight in the process of recovering of specific elements and design of the material flow, this article provides a comparative analysis of recycling of two types of PV panels - Deutsche Solar and First Solar - including LCA considerations and cost analysis.
Supplemental Reading:
Journal publication: Kim, S., Jeong, B., Closed-Loop Supply Chain Planning Model for a Photovoltaic System Manufacturer with Internal and External Recycling, Sustainability 2016, 8(7), 596.
URL: https://www.mdpi.com/2071-1050/8/7/596 [113]
The presented analysis and modeling shows that using the external recycling facilities as material source, the PV manufacturers can save on some costs. Joining a recycling association decreases the total cost of c-Si panels by 55.28% and CdTe panels by 2.28%.
Probing Question
Do you know what programs and policies for electronic and PV recycling exist in your town, city, or area? Do residents and business choose to use them? Why yes or why not?
References:
Mulvaney, D., Act Now To Handle The Coming Wave Of Toxic PV Waste, Solar Industry Mag 2015. Accessible from URL: https://solarindustrymag.com/ [114]
Williams, B., Photovoltaic (PV) Recycling, Final Project, EME 807 Technologies for Sustainability Systems, Renewable Energy and Sustainability Systems (RESS) Program, Penn State University, 2016.
5.7. Reuse and redistribution programs
5.7. Reuse and redistribution programs
Reuse is the second level of the national solid waste management hierarchy. Reuse is simply repeated using a product or component in its original form. For example, using a glass milk bottle multiple times within the producer – customer chain (instead of using a plastic bottle).
Reuse also means that materials and products are redistributed from one who no longer needs them to those who can still find use in the items. The benefit of reuse is not only in conservation of valuable natural resources, but also in getting materials and products to disadvantaged people and organizations.
US EPA provides grant funding to Reuse Development Organization Inc. (ReDO), a non-profit organization whose mission is "to promote reuse as an environmentally sound, socially beneficial, and economical means for managing surplus and discarded materials. The ReDO company website [115] provides some background on the issue.

Here are a few examples of successful material reuse programs, which attempt to divert the flow of useful resources from the waste stream:
- "LIFT" reuse program [117] accepts gently used equipment designed for persons with disabilities and redistributes it to people in need. They perform safety checks and sanitation of the donated items. The program accepts walkers, wheelchairs, transfer chairs, raised toilet seats, shower chairs, adapted telephones, low-vision aids, reachers, and any other equipment that helps with independence.
- "Soles 4 Souls [118]" nation-wide program that has a mission "fighting the devastating impact and perpetuation of poverty through the distribution of shoes and clothing... Most new items collected primarily from corporations and retailers are given directly to people in need, both in the U.S. and overseas. The organization has relationships with several of the world’s leading apparel brands, which provides Soles4Souls with new but non-marketable overstocks, returns, discontinued models and other shoes or clothing items."
- Cooling pack reuse program [119]: Employees of a medical facility initiated a program to divert reusable cooling packs from trash. Cooling packs are very common supplies that are used to keep the medical samples cooled for transportation. They were normally discarded once samples arrive at the facility, which has a stationary refrigeration system. The program established a few routes to reuse the packs while helping local food banks.
5.8 Circular Economy
This week, in Lesson 5, you are learning about various methods to minimize waste and to avoid putting that additional burden on the environment. Recycling is often thought of as a smart way to deal with waste – something we have to do to reduce the mess that has already been made. However, the same as with green chemistry principles, thinking is being shifted now from dealing with consequences of dealing with the root cause. In fact, recycling should become a part of the product design, so that its efficiency is maximized, and maximum of valuable material included in the product is recovered. In this case, more focus is put on salvaging the resource, rather than just keeping stuff off the landfill.
This way of thinking becomes even more urgent when we realize that for new emerging technologies, we need significant amounts of earth’s minerals that are actually limited. Those critical minerals and materials become strategic stocks for industries producing electronics, batteries, clean energy, aerospace, and other technologies that are going through massive scale-up. Design of closed recycling loops for those minerals is also a strategic task for manufacturers, if they plan staying in business for prolong period of time. For example, recycling metals such as Li, Co, Ni, Mn, rare-earth metals, graphite will be critically important for meeting the demands for energy storage and renewable energy. Thus, recycling becomes not only a key part of waste management, but also an integral link in the so-called circular economy.
Circular Economy [120] is a relatively new term, which I wanted to put on your radar in this lesson. It builds upon the zero-waste concept, but actually goes beyond that. While encompassing stages of product design, and recycling technology, it also assumes establishing new sustainable supply chains for critical materials and strong partnerships among all players in the circle.
The concept of circular economy is not something we suddenly invented. In the nature, we see cyclic processes for matter and energy transformation functioning for millennia. This is the system where waste (as we understand it in society) does not exist! One good example to give here is a tree!

The tree absorbs water and nutrients from the soil and grows branches, leaves, fruits, and seeds. The fruits and seeds become food for animals and birds. Leaves are engaged in the photosynthesis producing oxygen, which is used for breathing by organisms. When leaves fall to the ground and decompose, the resulting organic matter enriches the soil, which sustains the growth of other plants, and the tree itself. And then the cycle starts all over again.
Speaking of biomimicry: can we design a technical supply chain system in which all the outputs from one segment of the system become the inputs to another segment of the system, just like it happens in biological environment?
Please watch this short video to learn more about the circular economy concept:
Video: Circular Economy Explained (4:58)
Talk of sustainability is everywhere today, and along with it a growing awareness of the linear model of our existing economy. This linear economic model is captured in the popular description of the economy as a process of take, make, and dispose.
We take natural resources from our environment, produce a product, and push it out to end-users who then dispose of it. This used to not be such a problem. However, as the economy has grown in reached planetary limits, inputs are appearing more limited, and outputs have become increasingly detrimental to ecosystems.
To give us some appreciation for just how inefficient this overall linear model is, the Rocky Mountain Institute estimated in the year 2000, that the flow of natural materials globally is 500 billion tons per year. But only 1% is put into durable products and, still there, six months later, the other 99% is waste. As limits are increasingly met, the emphasis is now shifting from an economic model that is organized around gross throughput of material and energy in a linear fashion, to a new kind of circular economy, which shifts the focus to the internal organization of processes within which resources are used. It aims to optimize for the overall service delivered rather than the gross throughput of products. The circular economy is all about identifying and closing loops, so as to create self-sustaining systems, where producers and consumers are closely coupled to enable constant feedback. For example, food production, consumption, and disposal might be organized to be part of the same closed cycle. To do this, industries are studied as industrial ecologies so as to identify where and how resources and energy flow through them. Where they are lost and where processes could be interconnected to reduce those losses. In a circular system, resource input and waste emission and energy leakage are minimized by slowing closing and narrowing energy and material loops. This can be achieved through long-lasting design maintenance repair, reuse, remanufacturing, refurbishing, or recycling. This is a regenerative approach where things are being constantly repurposed to serve new functions.
The challenge of achieving a sustainable form of development, is shifting the emphasis from discrete one-off products to looking increasingly at how they can evolve through their full lifecycle. This is a fundamental switch in paradigm from designing systems that are inherently degenerative to systems that are inherently regenerative. Over time, developing a truly circular economy requires diversity and the interconnecting of different systems. Systems and processes that are all the same consume the same resources and produce the same outputs without the capacity to recycle them. It is only by connecting different systems in the right way that we can harness their diversity to create synergies between them.
The circular economy shifts the locusts from things to the synergies between them. Our existing linear economy is a product of analytical thinking, where we divide everything up and separate everything out so as to focus on specific activities and achieve economies of scale. We put housing all in the residential area, factories in the industrial zone, food production and farms etc.
In contrast, the circular economy is about integration so as to enable feedback loops and synergies. As Gunter Pauli notes, it is about using the resources available in cascading systems. The waste of one product becomes the input to create a new cash flow. Things in this circular model become Multifunctional. Instead of a building just serving a housing function, it becomes also an energy producer and consumer. A food producer and consumer. It may function as entertainment and recreation. This multi functionality works to not just close loops but also create more resilient systems because they are more self-sufficient and less dependent.
As the circular economy is not about any individual product or thing, it is rather about changing the organization of whole systems. It requires systems thinking. As the Ellen MacArthur Foundation notes, the circular economy isn't about one manufacturer changing one product, it is about all of the interconnected companies that form our infrastructure and economy coming together. It's about rethinking the operating system itself.
Reading Assignment
"Circular Economy in Detail", Ellen Macarthur Foundation, URL: https://archive.ellenmacarthurfoundation.org/explore/the-circular-economy-in-detail [120], Accessed: 2021.
On the website linked above, scroll down through the presentation slides to learn the key principles and definitions of the circular economy concept. Think of an example of the process or product that is already using these principles to effectively save the mineral resources. Think of another example - a process that urgently needs innovation to prevent fast resource depletion. Usually, resource depletion problem rises upon the scale-up of a particular process.
Summary and Activities
Summary and Activities
This lesson contains a significant amount of information on existing and developing methods of resource conservation and waste treatment. This information is mainly related to dealing with municipal waste and does not cover special types of waste such as nuclear or agricultural waste. Wastewater and sewage treatment is a separate topic that will be addressed in the next lesson. The general thought that summarizes this lesson is that treatment of waste is a dirty and expensive business - it is better to prevent it than clean it up. New technologies that would change the situation to a more sustainable world must involve transformative design innovations that increase the recyclability and biodegradability of the waste stream outputs. Life cycle thinking and modeling will help to identify the best scenarios for sustainable actions.
| Type | Assignment Directions | Submit To |
|---|---|---|
| Reading | Complete all necessary reading assigned in this lesson. | |
| Discussion |
Clean-up Innovations. 1. Search the web for innovative ideas aimed at efficient waste disposal or removal. 2. Post the link to the story or source. 3. Briefly explain the principle of technology or approach. 4. Express your own opinion on the promise of this idea. This search can be related to any scale of waste disposal or cleanup (from industrial to small household or community wide). Let us stick to the solid waste area (wastewater treatment is a separate topic). It can be both a technological system or simply a strategy, but it should provide a way to make our living environment cleaner. |
Canvas: Lesson 5 Module |
| Activity |
For this assignment, choose one of the two research articles (available via PSU Library or as PDF in Module 5 in Canvas): 1. Jin, H., Frost, K., Sousa, I., Ghaderi, H., Bevan, A., Zakotnik, M., and Handwerker, C., Lifecycle Assessment of Emerging Technologies on Value Recovery from Hard Disk Drives, Resources, Conservation, and Recycling, 157 (2020), 104781. 2. Hu, Q., et al., Biochar Industry to Circular Economy, Sciences of the Total Environment, 757 (2021), 143820. Instructions:
For more details, please see Lesson 5 Dropbox and Worksheet in Canvas. Deadline: Wednesday (before midnight) |
Canvas: Lesson 5 |
References
Solid Waste Technology & Management, Volume 1 & 2, Christensen, T., Ed., Wiley and Sons., 2010.
McDonough, W. and Braungart, M., Cradle to Cradle. Remaking the Way We Make Things, North Point Press. New York, 2002.
The Hannover Principles. Design for Sustainability, William McDonough Architects, 1992 [24].
Lesson 6: Sustainable Water and Wastewater Systems
6.0 Overview
Overview
When we examine the sustainability profile of a particular community, we always have to look at the water system that sustains that community. Historically, people dwellings were associated with the sources of water: rivers, springs, or lakes. In modern times, the issue of water remains primary. We have more advanced technologies to extract and distribute water resources, and we have other technologies to utilize and treat water. Those technologies become key links in the universal water cycle, which involves both ecological and anthropogenic spheres. This lesson specifically focuses on the technological methods to provide efficiency for water supply and further to provide sustainability of water resources. Such technologies target the two growing problems - water resource depletion and water pollution. After touching on the background of water management systems, this lesson will direct you to the examples of lifecycle analysis, which helps identify the technologies with the higher promise for sustainability.
Learning objectives
By the end of this lesson, you should be able to:
- understand the water cycle, identify the main processes, and explain connections between natural and anthropogenic water paths;
- name and explain the key sustainable technologies in water management and wastewater treatment;
- estimate water use of anthropogenic systems;
- compare different water treatment technologies against environmental metrics and identify pros and cons of new alternatives.
Readings
- EPA Document: USEPA Water Conservation Plan Guidelines [126], EPA 1998, Appendix A: Water Conservation Measures [127], pp. 143-155.
- Journal article: Vorosmarty, C.J., Sahagian, D., Anthropogenic Disturbance of the Terrestrial Water Cycle, BioScience, vol. 50, pp.753-763.
- Journal article: Dhinadhayalan, M., Nema, A., Decentralized wastewater management - New concepts and innovative technological feasibility for developing countries, Sustain. Environ. Res., 22(1), 39-44 (2012).\
- Journal article: Bonton, A., Bouchard, C., Barbeau, B., Jedrzejak, Comparative life cycle assessment of water treatment plants, Desalination 283, 42-54 (2012).
These articles are available online through PSU Library system - See the "Library Resources" / E-Reserves link in Canvas.
Questions?
If you have any questions while working through this Lesson, please post them to our Message Board forum in Canvas. You can use that space any time to chat about course topics or to ask questions. While you are there, please feel free to post your own responses if you are able to help out a classmate.
6.1 Understanding water cycle

Water is often envisioned as the bloodstream of biosphere. It is a universal medium that is crucial for sustainability of both ecological and human societies. There is no substitute for water. More than 70% of the earth surface is covered by water. However, only 3% of this reserve is fresh water that can be used for human consumption. 90% of the earth's fresh water resources is contained in groundwater and ice, and only 10% is water is contained in surface reservoirs - rivers, lakes, wetlands, and streams. [Girard, 2013].
Although sustaining life is one of the main key purposes of the water, present-day agriculture and many industry branches heavily rely on the abundance of the water resource. For example, water is used as heat transport fluid in thermoelectric energy systems, such as nuclear and fossil fuel fired power plants and concentrating solar power farms. It is used as solvent and raw material in chemical manufacturing. Mining industry utilizes significant amount of water in hydraulic fracturing and oil recovery. Those industries are important parts of modern infrastructure; hence, the water demand must be met to keep the power and food production at the necessary level.
To plan sustainable utilization of water resources, we must understand how the water cycle works at the global and local scales. The amount of water on earth is finite, and the natural water cycle is a system that controls the circulation and redistribution of that resource. You must be familiar with the water cycle concept from your early science classes. But you can get a refresher from the following short video:
Video: Water Cycle | How the Hydrologic Cycle Works (6:46)
PRESENTER: All the water on Earth today, every drop, is all the water there has ever been on the planet. Fresh water is actually, millions of years old. The same water flowing in a continuous loop. Falling as rain and snow from clouds to the Earth's surface. Running in rivers. Pooling in ponds. Flowing from faucets. Irrigating crops. Traveling through plants. Generating power. Eventually, evaporating into the air and condensing into clouds, again.
ANNA MICHALAK: Why is there life on Earth? And the reason there is life on Earth is because Earth has this perfect water cycle.
PRESENTER: The water cycle, so simple even small children understand the basics. Yet, so complex, the most advanced Earth scientists-- hydrologists, geologists, and biogeochemists-- are studying every part and process.
MARTHA CONKLIN: The water cycle is fascinating. It's something that's around us all the time. And yet, we don't really understand it.
PRESENTER: How to summarize what is known about the water cycle? With two words-- flows and stores. The water cycle is a series of flows of water between various water stores, or storages-- clouds in the atmosphere.
TOM HARMON: There's always a little bit of water in the atmosphere. We talk about relative humidity. It's a humid day. It's a dry day. Either way, there's water-- sometimes, a little. Sometimes, a lot.
PRESENTER: There's a lot of water in the ocean-- 70% of all the water on Earth. In the ice sheets and glaciers, 2/3 of all the freshwater on Earth. In the snow packs atop mountains like the Sierra Nevada. In the Great Lakes. In rivers and streams. In reservoirs and watersheds. In wetlands. In the soil. In and on plants and trees rooted in the soil. And beneath the soil, in water tables and underground aquifers like the Ogallala-High Plains, which runs underneath parts of eight states, from South Dakota to Texas. All this storage is temporary. Water in all its forms is always in flux and always moving. And there is a name for every kind of movement in the water cycle, starting with precipitation.
ANNA MICHALAK: Precipitation is the process of water falling onto the surface of the Earth. You could have precipitation in many forms-- rain, snow, hail.
PRESENTER: Rain is falling water in liquid form. Snow, ice, hail, and sleet are falling water in solid or frozen form. Fog and mist, falling water in gas or vapor form. Precipitation that falls directly onto the oceans becomes part of Surface Ocean and can be churned by wave and wind action into ocean currents. Rain and snow that falls directly on rivers and streams becomes one part of stream flow. Rain that falls onto land takes a different path to the river. As does the snow and ice that falls and collects on mountain tops when temperatures warm.
MARTHA CONKLIN: When snow melts, some of it runs through the snow pack and goes into small streams, tributaries that feed into large rivers.
PRESENTER: What about that precipitation that falls on and over land? Some is intercepted by vegetation-- plants and trees. TOM HARMON: Like you might imagine, someone in the game of football intercepting a pass, these are raindrops trying to come to the ground and the leaves on the tree intercept them before they hit the ground.
PRESENTER: And the precipitation that does hit the ground, it can run off if the ground is hardscape, covered with asphalt or concrete, or if the soil is too wet or saturated to absorb more water, like an over-soaked sponge. Otherwise, precipitation infiltrates the soil surface, percolates into the ground.
TOM HARMON: Think of it as the water percolating through your coffee grounds in the morning. Gravity continues to pull it downwards so it will move through.
PRESENTER: Through the topsoil. Into spaces between soil and rock particles. Down to bedrock and further into fractures. Into deep underground aquifers. Even ground water here is moving sideways or laterally, discharging toward a river, lake, or the sea. Generally, the deeper the flow, the slower the flow.
MARTHA CONKLIN: Some of that fractured water might take a very long time-- thousands to millions of years-- to get out.
PRESENTER: And how does water get back out into the atmosphere? It evaporates. It's turned from a liquid into a gas or vapor, by the heat of the sun.
ANNA MICHALAK: If you put a bit of water into a bowl and you set it outside on a sunny day, it's going to disappear. It's still water, it's just in the form of a gas rather than the form of a liquid.
PRESENTER: Water evaporates from every wet surface, even from wet air. Some rain and snow evaporates into the air while falling. Water evaporates through our respiration and perspiration. And from plants through transpiration. Trans means through or across. Plant roots draw up groundwater. And plants pull that water up through their stems into the leaves and then, release them back out through evapotranspiration. Evapotranspiration-- a spelling bee worthy term for evaporation from soil and water surfaces, plus transpiration from plants. Evaporated water molecules are tiny enough to flow into the air. Mix with smoke and dirt particles in the atmosphere. Cool. Condense into visible masses of water vapor-- clouds. Winds move clouds into colder air, water droplets collide and merge, grow bigger and heavier until they are so heavy, they fall again, as rain or snow, sleet or hail. Precipitation, collection, runoff, interception, infiltration, percolation, discharge, transpiration, evaporation, condensation-- the water cycle
This quite general and deceivingly simple concept of water cycle has a number of limitations which are important to understand:
- Capacities of the reservoirs vary dramatically.
- Flow rates between the reservoirs vary dramatically (for example replenishment of a surface stream via precipitation can take days, while replenishment of a deep aquifer may take decades).
- This concept does not directly reflect possible delays or discontinuities.
- Cycle kinetics depends on climate, time of the year, and geographic location.
- This concept does not portray fluctuations in storage zones.
Check out this website!
To add some quantitative information to the picture, please take a look at the US Geological Survey (USGS) [132] website.
If you scroll down and click on any of the components of the water cycle, you will get comprehensive information on that reservoir. Note the dramatic difference in water capacity of different reservoirs. Try to remember at least the order of magnitude of the specific water reserves, since such quantitative perception can be quite useful in sustainability analysis.
Annual evaporation from the ocean is about 80,000 cubic miles versus 15,000 cubic miles from the land. Given the amounts of water evaporated and precipitated are almost equal, the total amount of water exchanged between the atmosphere and the earth surface is about 95,000 cubic miles. Out of the water evaporated and then returned by rainstorms, 24,000 cubic miles fall on land as precipitation. The average annual precipitation over the land is 26 inches, but it is not evenly distributed. Arid locations may get under 1 inch of precipitation, whereas some others can get more than 400 inches. The total annual precipitation in the United States is about 30 inches per year, which accounts for about 4300 billion gallons per day. The total water flow from surface and subsurface sources is about 8.5 inches per year, i.e., about 1200 billion gallons a day. This amount is available for human use, including domestic, industrial, agricultural, and recreational use. Considering that the difference between precipitation and stream flow is -21.5 inches per year (3100 billion gallons per day), this amount is assumed to return to the atmosphere (through evaporation and transpiration). This returned volume roughly accounts for 70 % of the total water supply. [Source: USDA [133], 2001]
In nature, the hydrological cycle is well-balanced, and fluctuations of environmental water stocks are reversible. But when some of the parts of the system are interfered, resilience of the system may be jeopardized. This can happen when the anthropogenic water consumption cycle is plugged in to the natural water cycle. The main troubles currently experienced because of mismatch of the anthropogenic and natural cycles include:
- groundwater depletion;
- chemical pollution of surface waters and groundwaters;
- lake drying;
- droughts;
- desertification;
- eutrophication
- loss of habitat
- water and food shortages.
While the above-listed factors may have acute local effect, recent research also shows that large-scale hydraulic engineering produces global-scale impact on the earth's water cycle, raising the global sea level.
Reading Assignment:
Read through the following article that discusses the main man-made factors that affect the natural hydrological balance. While you are welcome to read the whole article, put the main focus on Table 1, which quantifies those effects, and sections on "Major classes of water engineering" and "Impacts of Human control...", which explain the specific mechanisms within the cycle.
Journal article: Vorosmarty, C.J., Sahagian, D., Anthropogenic Disturbance of the Terrestrial Water Cycle, BioScience, vol. 50, pp.753-763. (Full article can be accessed via Library e-Reserves in Canvas.)
Some of the things to reflect on in this reading:
- Water management is closely dependent on soil management: overuse of soil, deforestation increase storm water runoff, decreasing absorption to soil and hence decreasing the continental water storage. Water does not have a chance to return to aquifers.
- While no net losses occur in the water cycle ("closed" system), loss of continental (fresh) water from continents to the ocean (salt water), results in shrinking of the usable water reservoirs - e.g., depletion of aquifers.
- Irrigation accounts for over 80% of all 'irretrievable' water consumption. This constitutes ~56% of all water withdrawn from the natural sources in some areas. Loss of water during irrigation is due to intense evaporation and plant uptake.
- Large artificial reservoirs (dammed rivers) have high evaporation rates (compared to unmodified rivers) and therefore can reduce the continental runoff. At the same time, they cause water transfer to the atmosphere and to the groundwater storage.
The idea of sustainability in water management implies matching the natural water cycle and technical (anthropogenic) water use cycle together with minimal damage and maximum mutual support. A new approach to integrated managing water resources is known as total water cycle management, where water supply, stormwater, and wastewater are all considered during the design process.
The diagram in Figure 6.1. presents the water cycle in terms of stocks and flows. It illustrates the connections between different natural processes and reservoirs and also introduces the anthropogenic water paths into the system. The diagram is quite busy, so it would be useful to walk through it step by step. The video embedded below provides commentary to different parts of the diagram and also shows the links where water-treatment technologies must be applied to provide compatibility between the environmental and anthropogenic spheres. While watching, you may need to switch to 'full-screen' and HD quality setting to better see smaller details.
Click on the image to view the large version
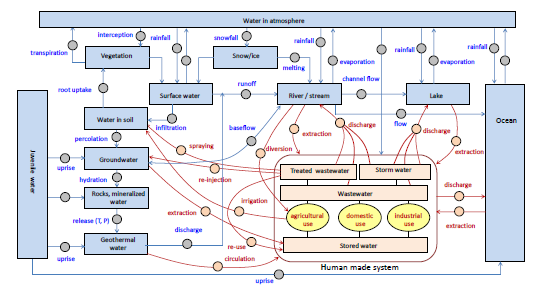 [134]
[134]Video: Water Cycle Step by Step (8:37)
This animation shows multiple connections within the hydrological cycle, including those with human controlled systems. It gets kinda bulky in the end so I will go step-by-step.
Let's start with ocean. The ocean is the biggest reservoir on the Earth, which accounts for about 96.5% of global water reserve. The ocean exchanges water with the atmosphere. Through evaporation and precipitation. Atmospheric water vapor accounts for only 1000th of a percent of the global water. But because the surface of the evaporating ocean is so huge, they exchange is extremely important as transport mechanism.
Now, let me push this ocean box to the side and clear up space for some other storages and elements of the cycle. We can identify a few main types of continental water storages. Surface water, rivers and streams, lakes, and some snow and ice masses. Snow and ice, by the way, represent quite a significant storage. They contain more water than all other service storage is altogether. Although storages are fed by the precipitation fluxes, rainfall or snow fall, and they also release some water back to the atmosphere. Snow eventually can melt and feed some water to the surface freshwater system. Then surface water flows to the streams and rivers through collection and surface runoff and reverse channel water to the more stationary storage lake or flow directly to the ocean. This is quite well-known schema of natural water exchange, which you may have heard in basic earth science class. But let's go a little bit further and add some more details here.
Some of the rain can be intercepted by plants and that water eventually drips and flows down over with some delay. Plants also release some water to the atmosphere through transpiration and evaporation. Okay, The next step is very important. Considerable amount of surface water infiltrates into the soil from where it can be taken by plants. This process fosters biomass production. The rest of it percolates down to the groundwater and groundwater can actually migrate and exchange with the surface water storage is through the base flow.
Groundwater is another huge reservoir, which may contain either fresh or salty water. Some of the aquifers may have connections to juvenile resources. In other words, the origin of this water can be related to the magmatic processes in the interior. So we put that into the picture. The next link, some of the groundwater in juvenile water reacts with rocks and is present in the mineralized form. For example hydrated minerals. And finally, here we have the geothermal water, which can be connected to both juvenile water pricing or dehydration of minerals on the high temperature and pressure. In some spots, geothermal water can just charge to the surface or to the ocean floor. This closes the loop from the downside. So this is the natural water cycle without humans in the picture.
But what if we put our water utilization system right in the middle here? That includes agricultural, domestic, and industrial use of water. And those can be connected to an artificial water storage. So where does that usable water come from? Can be extracted from the aquifers or taken directly from the surface reservoirs, for example agriculture can use some diverted streams for irrigation. All those users produce some wastewater for sure and that wastewater can be treated and returned to the environment. Can be either discharged to streams or sprayed onto soils, or even can be re-inject it to the aquifers. Some of the treated wastewater can be re-used, which makes it closed recycling loop here. Agricultural irrigation is another way for the water to return to the natural cycle. Now we understand that rain can fall on the human-made environment as well. And after this indirection, we have some stormwater produced. This storm water is also considered some kind of wastewater which can be treated or not treated depending on the locality. But either way, storm water contributes to the discharge flux from the human water utilization system to the nature.
Then we add another discharge curve here, showing that some of the wastewater sometimes goes back to the environment without any treatment. This is not good, but it happens. Can we extract water from other resources if groundwater is not available? Sure. Here we put the additional arrows to show extraction of water from rivers and lakes and exchange fluxes with the ocean certainly also take place. Some locations direct circulation of geothermal water. There's also a viable option. People can use it for heating the homeschool, for example. I'm sure this schematic can be developed further and more storages and fluxes can be identified. But let's stop here. You see this boundary zone here between the naturally balanced part of the cycle and human control part of the cycle is where the potential problems occur. Mismatch in physical and chemical fluxes can throw the system off balance and lead to water shortages, ecological crisis, pollution, and all other negative consequences. So to ensure global and local sustainability of water resources, we need a number of special technologies that would help make these two systems more compatible. Some technologies are used at the extraction phase, for example drinking water purification. Those make sure the water is sufficient and safe for human consumption. Other technologies are used at the discharge path. for example wastewater treatment. Those are designed to mitigate pollution and make sure that we're not depleting our natural reservoirs too soon.
Finally, some technologies help control water loops within the human domain, for example water distribution and collection. The bottom line of this demonstration is that the development of novel technologies for water treatment and monitoring is very important for providing smooth interaction between the sphere of human activity and the environment. The ultimate sustainability goal here is to re-install the water balance locally and globally. And to be sure that this most important and irreplaceable resource is conserved for centuries to come.
As you can see in the diagram in Figure 6.1, the boundaries between the natural and human-controlled water systems are where the sustainable water treatment technologies should come into action. The bottom line is that the role sustainable water technology is to reconcile the natural and anthropogenic cycles and to alleviate mutual harm and system misbalance.
The following list gives you some examples of possible actions that help to keep combined water system sustainable (can vary with location):
Water regime management
- keep the aquifer levels within appropriate range
- prevent flood damage in developed areas
- prevent excessive erosion
Water quality
- minimize the export of pollutants to surface water or groundwater
- minimize waterborne sediment loading
- minimize pollution from sewage protect existing vegetation
Water conservation
- control water extraction and use
- promote the use of rainwater and stormwater where such use does not adversely affect existing environmental values
- promote the reuse of wastewater effluent
- reduce irrigation requirements
- promote opportunities for localized supply
Water value
- enhance water related environmental values
- enhance water related recreational and cultural values
- add value while minimizing development costs
Many of these actions require efficient technologies of water control and water treatment. The following sections of this lesson provide you with some examples and technical details on current practice of water treatment and prospective technologies for the future.
Check Your Understanding
Which of the following continental water storage reserves has the largest global capacity?
Click for answer.
Glaciers and snow account for 5,773,000 cubic miles; second largest - groundwater accounts for 5,614,000 cubic miles
Check Your Understanding
What processes in the water cycle are responsible for depletion of continental water storage?
Click for answer.
increased evaporation (often observed in artificial reservoirs and on irrigated areas); increased surface runoff (often caused by deforestation, urbanization, and soil damage)
6.2 Water conservation and protection technologies
6.2 Water conservation and protection technologies
Water use statistics
When water is extracted from the natural water cycle, where does it go?
Based on government statistics, a big part of it (~40%) is used for agricultural needs (e.g., irrigation for crops or livestock), around 47% is used for industrial needs (e.g., power generation, mining, etc.), and around 13% is going to public supply (e.g., domestic or commercial) (Figure 6.1). However, these numbers can vary with location. For example, in Minnesota, the majority of the water extracted is used for power generation, while in California, the dominating use is irrigation [USGS, 2015 [135]].
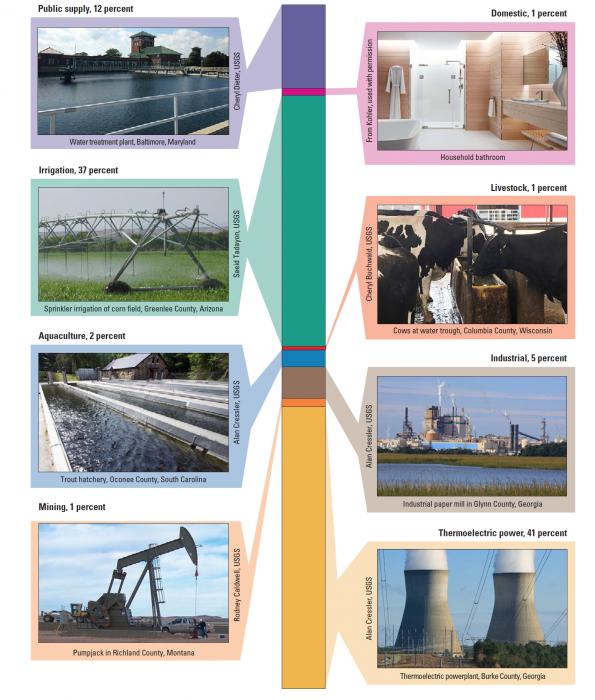

Although residential water consumption accounts for a smaller fraction of the whole, domestic water economy is considered an important factor in urban sustainability. The overall domestic water use is expected to grow as world population grows.
According to the U.S. Geological Survey 2015 water census, daily per capita domestic water use in the U.S. was 82 gallons per day, which was an improvement from 88 gallons per day estimated in 2010 census, and 101 gallons per day in 1995 census. This value represents the national average, and the actual local water use can vary broadly - for instance, from 35 gpd in Connecticut to 186 gpd in Idaho [USGS, 2015 [135]].
Typical US home water use accounting is:
- Showers - 19.5%
- Washers - 22.1%
- Toilets - 18%
- Dishwashers - 1.5%
- Baths - 2.7%
- Leaks - 8.8%
- Faucets - 23.9%
- Other - 3.4%
One can estimate how much water they use at home with some simple online calculators:
Water Conservation strategies
As the population grows, so does the stress on available water resources. Hence, there are a number of water conservation strategies, with some of the most intuitive approaches being:
- Limiting the consumption: Application of policies, economics, and technologies help regulate the demand. Policies may include restrictions and bans on certain types of water use, standards for fixtures and appliances, enforcement on recycling, etc. Economic measures, such as setting prices for water consumption, typically make people more diligent about their water-related activities. Technological advances may help use less water for the same function (water-economy washers, toilets, etc.)
- Reuse and recycling: Designing systems for reuse and recirculation of water in both domestic and industrial applications are involved in this approach. For example, treated wastewater can be used for irrigation; or water can be recycled in certain types of car wash systems.
- Elimination of losses: Regulation, metering, water-sensitive design, and smart technology are key factors contributing to this strategy. Leak identification systems, smart controllers for water use are some of such conservation technologies.
- Pollution prevention: Less pollution creates more opportunity for water reuse and conserves natural water reserves. Regulatory policies are introduced on water discharging facilities. Also, numerous technologies exist to treat the effluents from domestic and industrial facilities.
Sustainability goals and growing demands for clean water require new solutions in water conservation and use. There are technologies in place; however, many existing methods sometimes have low efficiency and are prone to water losses. Some innovative approaches are overviewed in this Guardian article: "The new water technologies that could save the planet [140]."
The technologies mentioned in this article work out a number of issues, such as scalability, cost, and efficiency. In sustainable development, we want the systems to be affordable and compact, not using too many resources. That makes them easy to implement in both urban and rural settings.
US EPA introduced a set of strategic practices and policies to water promote water conservation. There are three levels of control, which are summarized in Table 6.1 below. Level 1 measures represent the most basic practices, Level 2 measures are intermediate-level controls, and Level 3 lists more advanced strategies for water conservation. When organizations design their water conservation programs, they may start at Level 1 and gradually proceed to Levels 2 and 3:
| Level 1 Measures | Level 2 Measures | Level 3 Measures |
|---|---|---|
| Universal metering | Water-use audits | Replacements and promotions |
| Water accounting and loss control | Retrofits | Reuse and recycling |
| Costing and pricing | Pressure management | Water-use regulation |
| Information and education | Landscape efficiency | Integrated resource management |
Complete the following reading assignment to learn what each of the above-listed measures involves.
Reading Assignment:
The following EPA document will help you to understand the key strategies and driving forces in water demand management and water conservation.
USEPA Water Conservation Plan Guidelines, EPA 1998, Appendix A: Water Conservation Measures [127], pp. 143-155.
While reading, look through the definitions of the terms listed in the above table and understand them. Implementation of these measures has triple leverage: economics, policy, and technology. As you read, particularly think about the role technologies may play in the effectiveness of these measures.
Check Your Understanding
This question is based on the above reading.
What kind of technologies would play a role in the implementation of the following measures of water conservation? Fill in your ideas in the blank, then click for answers.
Water reuse and recycling
Click for answer.
Efficient wastewater treatment technologies are crucial to enable multiple uses of water.
Water accounting and loss control
Click for answer.
Accurate water metering technologies, leak detection sensors, monitoring transmission system integrity
Landscape efficiency
Click for answer.
Lawn maintenance technologies, irrigation water sensing devices, soil improvement mulching
Retrofits
Click for answer.
Low-flow faucets and shower-heads, advanced plumbing materials
6.3 Water treatment systems
6.3 Water treatment systems

Water treatment technologies are designed to eliminate harmful effects of pollutants and natural substances to human health and environment. Within the blended water cycle (considered on page 6.1), these technologies are often placed at the transitions between the environment and human sphere to adapt the water quality.
For example, when water passes from the environmental source to the human consumption system, there is a possible risk to human health from some natural bacteria, chemical elements. Hence, natural water (from either surface or underground reservoir) needs to be purified to a certain standard. On the other end of the system, the water containing waste or substances resulting from the domestic, agricultural, or industrial activity must be cleaned before returning to the environmental pathways. If this is not done, harmful effects of concentrated pollutants can cause significant disturbance to the natural water ecology and escalate damage to both ecosystem and society in the long run. Some common effects of wastewater pollution include eutrophication (biological nutrient pollution; for example, releasing access of nitrogen and phosphorus —"overfeeding ecosystem"); oxygen depletion (due to oxidation of organic compounds); odor and aesthetic damage; proliferation of harmful bacteria, viruses, fungi in drinking water supply.
Centralized water treatment
Centralized water treatment approach implies treating large amounts of water at large rates in a "central" location and distributing that water via networks of pipelines, channels, and intermediate reservoirs. Centralized water treatment is largely implemented and maintained in major urban areas and in most parts of the developed world. Probably most of us primarily use the centralized treatment in our lives (maybe except some travel circumstances).
A couple of videos below describe large-scale water treatment systems that are designed to remove undesired contaminants from water.
This first video shows an example of how water is treated during its transfer from the environmental source to the drinking water supply:
Video: Water Treatment Plant Tour (5:26)
Welcome to our tour of Winnipeg's drinking water supply and treatment system. We use leading edge technology to treat the water as it passes through many stages, including coagulation, flocculation, dissolved air flotation, filtration, and three types of disinfection. Our system protects public health by virtually eliminating the risk of waterborne disease and reducing the level of harmful disinfection byproducts. It also improves the taste, odor, and appearance of our tap water.
Shoal Lake has been our source of water since 1919. It's located 136 kilometers from Winnipeg at the Manitoba-Ontario border and is approximately 92 meters higher than Winnipeg. Water flows downhill from Shoal Lake through an aqueduct into four large reservoirs next to the treatment plant. The aqueduct is a large concrete pipe that carries up to 386 million litres of water per day to the reservoirs. The reservoirs hold up to 8.8 billion litres of water which on average is enough to supply Winnipeg for about 30 days.
Water flows from the reservoirs through two large pipes into powerful pumps that move the water into the plant for treatment. This $300 million state of the art facility features a highly automated system that monitors and controls a wide variety of instruments, mechanical equipment, and electrical equipment, including 40 processors, 140 pumps, 2,300 valves, and 1,400 instruments. It can treat up to 400 million litres of water per day.
In this first step, we add sulphuric acid and ferric chloride as the water flows into the plant. Sulphuric acid lowers the pH of the water and makes this stage of treatment more efficient. Ferric chloride, a coagulant, causes the naturally occurring particles of organic material in the water to attract each other. The water enters flocculation basins where large mixers slowly stir the water, causing the particles to collide and stick together, creating large clumps. Now that large clumps have been formed in the water, the next step is to remove them. We do this in dissolved air floatation tanks. We inject a stream of water, supersaturated with air, into the flocculated water which is flowing into the bottom of the tanks. Tiny air bubbles are released into the water and carry the clumps to the top of the tanks. Skimmers remove the floating clumps from the surface of the water. The clumps are pumped to an area for further processing. The treated water is collected from the bottom of the tanks. The water flows from the dissolved air floatation tanks to chambers where ozone is added. This step called ozonation does three things. It provides the first level of disinfection by destroying most of the harmful bacteria, it improves the filter performance in the next treatment stage, and it improves the taste and odor of the water. We make ozone by applying electricity to liquid oxygen. At the end of the ozone chambers, we add sodium bisulphite to the ozonated water to remove any leftover ozone.
The water now flows into filter tanks containing biologically activated carbon. The filters remove any remaining small particles in the water, including parasites. Good bacteria growing on the filters remove some of the remaining dissolved organic material. This reduces the level of disinfection byproducts in the water. We clean the filters regularly by pumping air and water backwards through them. The backwashed water is pumped to an area for additional processing. The filtered water flows into the chlorine contact chamber for a second round of disinfection. We add chlorine to kill viruses and bacteria such as E. coli that might be in the water. Chlorine is the most widely used drinking water disinfectant in North America and has been used for more than 100 years. We then add sodium hydroxide to bring back the pH of the water close to the original level. The water flows from the chlorine contact chamber into an underground reservoir called the clearwell. We disinfect the water once again using ultraviolet, or UV light. We pump the water through six stainless steel chambers, each containing nine ultraviolet lamps. The lamps are similar to fluorescent bulbs. With only seconds of exposure, the UV light rays penetrate any remaining parasites such as Cryptosporidium, or Giardia. The UV light renders these parasites harmless. After UV disinfection, the water flows into two large pipes where we add fluoride to help prevent tooth decay. We also add orthophosphate to form a protective coating inside water pipes. This coating helps reduce corrosion that may add lead to tap water. The two large pipes carry the treated water to our three reservoirs and pumping stations in the city. We add chlorine again as the water is pumped into the distribution system to ensure that the water remains disinfected until it reaches your tap.
The final stage of treatment is to deal with the materials removed from the water by the treatment processes. The backwash water from the filters is allowed to stand until the solid materials settle. We then send the clean water back to the beginning of the treatment process. We pump the settled out material from the filters and the clumps of particles from the dissolved air flotation process to outdoor settling ponds next to the treatment plant. The pond contents go through natural freeze thaw cycles which separate the liquid and solids. We pump the liquid into Winnipeg's sewer system for wastewater treatment and take the solids to the landfill for disposal.
We test our water each step of the way, from shoal lake to your tap. Our testing program includes over 150 different tests at more than 130 different locations throughout the year. Because water quality is so important, we do more testing than the provincial government requires. Our certified professional team is dedicated to ensuring that our community enjoys safe, high quality drinking water that meets provincial regulatory requirements, and falls well within Health Canada guidelines.
We hope that you've enjoyed this tour of our drinking water supply and treatment system.
This second video illustrates the treatment of the wastewater generated by human activity before it is returned to the environment:
Video: Barry's Wastewater Treatment Tour (5:26)
Have you ever wondered what happens to the water that flows down drains and toilets in your home? Hi. I'm Barry. And today I'm going to show you how wastewater gets treated. The journey begins here in your community. When it rains, snows, or when you wash your car in your driveway, the water runoff is known as stormwater. It flows into these storm drains that you see in your neighborhood streets. Storm drains connect to streams and creeks and eventually lead to Lake Ontario. But something different happens to the water that you use in your home. All the water that goes down drains and toilets in your home is known as wastewater. It's full of food, soap, waste, and more. Wastewater never goes straight into the lake or river. From your basement, wastewater flows into underground pipes that follow the natural slope of the land. So, most of the time, wastewater just flows downhill to the wastewater treatment facility. Now let's go see how we treat it. All of the wastewater from thousands of homes and buildings across Mississauga, Brampton, and parts of Caledon arrives here. It's collected in six big underground pipes directly underneath me. Each pipe is six feet in diameter.
Now let's go see the first step in wastewater treatment. The wastewater flows through these moving screens. The screens trap materials that should never be flushed down your toilet, things like plastics, rags, and dental floss. Everything the screens trap ends up on these conveyors. The conveyors bring all the garbage into large bins in the building next door. The garbage from the conveyors is collected here. When these bins are full, trucks take it away to landfill. Next, let's see where the wastewater goes. After the screening, the wastewater travels into underground grit chambers. Each of the chambers is round and spins wastewater, kind of like swirling water in a cup. As it spins, sand and small rocks are separated, move to the center of the chambers, and are removed. Now that the solid particles and garbage have been removed from the wastewater, it flows into settling tanks, like this one. We call these settling tanks because the wastewater is given time to settle. At the top of the tank, scum floats and is made up of grease, fats, and oils. At the bottom of the tank, sludge sinks and is made up of heavier materials, mainly human waste. Over here, we have an empty settling tank, so you can see how deep it is.
So now we have sunken sludge and floating scum. What happens next? See this large machine across the tank? We call this the bridge. But it doesn't stay in one spot like a regular bridge. The bridge slowly travels the length of the tank. As it moves, it scrapes the sludge along the bottom and skims the scum along the top. It takes 30 minutes for the bridge to travel all the way across the tank. Watch. I'll show you. The sludge and the scum are pushed to the end of the tank where it's collected. The sludge, under water, we can't see. But, at the surface, we can see the scum collecting here. This is a continuous process. The bridge will lift, go back to the far end of the tank, and start over.
Now the journey splits in two. First, we'll see where the sludge and scum go. Then we'll come back and see what happens to the wastewater. The sludge and the scum from the settling tanks, now referred to as biosolids, are pumped into these machines called centrifuges. A centrifuge spins biosolids super fast, like the spin cycle of a washing ma the end of the tank where it's collected. The sludge, under water, we can't see. But, at the surface, we can see the scum collecting here. This is a continuous process. The bridge will lift, go back to the far end of the tank, and start over. Now the journey splits in two. First, we'll see where the sludge and scum go. Then we'll come back and see what happens to the wastewater. The sludge and the scum from the settling tanks, now referred to as biosolids, are pumped into these machines called centrifuges. A centrifuge spins biosolids super fast, like the spin cycle of a washing machine, and remove excess water. Now, getting rid of biosolids, that's when things really heat up. This is one of four biosolids incinerators. And it heats up to over 840 degrees Celsius. The biosolids enter the incinerator with the consistency of cake batter. The incinerator then heats up the biosolids until they turn into ash. For every 10 tons of biosolids, we end up with only one ton of ash.
Now let's go see where the ash ends up. This is a lagoon where the ash is stored. The water is red because of the iron minerals that we added to eliminate phosphates. This is just a little ways away from the incinerators over there. So we add water to the ash to make it easier to pump. And that's how biosolids have turned to ash. Let's go back to where our journey split in two and find out what happens to wastewater from the settling tanks. With the biosolids removed from the wastewater, something interesting happens. Wastewater flows into these aeration tanks. Aeration is a process of pumping oxygen into water. Do you see all those bubbles? That's the oxygen. Aeration allows good bacteria to eat the sludge that didn't sink and the scum that didn't float from the settling tanks. This process is what makes wastewater clear, but it's not clean yet. These are the clarifying tanks. Remember the good bacteria that ate everything to make the water clear? They now sink to the bottom of the tanks and are removed. The water at the top of the tank is now clean, and it will be returned to Lake Ontario. Along the way, we add chlorine as a final disinfectant. It is now time for us to return the treated wastewater back to Lake Ontario. An underwater pipe stretches just over two kilometers out and lies at the bottom of the lake. Before we return the treated wastewater, we remove any excess chlorine.
Now let's go take a look at the control room. Here's where we monitor all the processes we talked about today. Operators ensure that water quality standards are always being followed and that operations throughout the facility, like the aeration tanks and incineration, are functioning properly. Lake Ontario is our most important body of water. It is the home to a variety of fish and plant life. It's the source of our drinking water, and, as we saw today, where stormwater and treated wastewater ends up. Even though our wastewater goes through an intense treatment process, we want to limit our impact on the environment. We can do this by keeping harmful chemicals, like paints, expired medication, and harsh cleaners, out of our sinks, drains, and toilets. Let's all do our part to keep Lake Ontario clean and healthy.
As we can see from these videos, the design of a large-capacity water treatment plant is very complex and involves not one but many steps, each of those utilizing multiple technologies. It is not our goal to learn all of them in detail in one lesson. However, should you have a specific interest in this topic, the US EPA Wastewater Technology Fact Sheets [147] web page can serve as a great resource for obtaining more technical information about them.
Depending on the degree of cleaning and purification, treated water can be reused for:
- irrigation of agricultural crops or landscape irrigation (e.g., schoolyards, golf courses, residential gardens);
- groundwater recharge;
- recreational use (e.g., lakes and ponds, fisheries, snowmaking, marsh enhancement);
- non-potable urban use (e.g., fire protection, air conditioning, toilet flushing);
- potable use;
- industrial use (e.g., cooling, process water).
The main concern in water reuse is to meet the water quality requirements for its intended use. Quality requirements are determined by federal, state, and regional regulatory authorities and may vary. The general guidelines by EPA with regards to the effluent from the wastewater treatment facilities are given in Table 6.2 below:
| Measures | Effluent Limitation | ||
|---|---|---|---|
| Daily maximum | Weekly average | Monthly average | |
| 5-day Biochemical Oxygen Demand (BOD5) | 60 mg/L | 45 mg/L | 30 mg/L |
| 5-day Carbonaceous Biochemical Oxygen Demand (CBOD5) | 50 mg/L | 40 mg/L | 25 mg/L |
| Total Suspended Solids (TSS) | 60 mg/L | 45 mg/L | 30 mg/L |
| pH (instantaneous) | 6.0-9.0 | --- | --- |
Here is an explanation of measures in this table if you are not familiar with the terms:
- BOD5 is the amount of oxygen needed to oxidize organic matter in a water sample. The difference in oxygen content is usually measured over the time span of 5 days (that is the reason for subscript 5). For reference, water from a very clear source may have a BOD of less than 2 mg/L; sewage water may give readings above 100 mg/L; food processing wastes may have BOD of thousands.
- CBOD5 is the amount of oxygen needed to oxidize carbonaceous organic matter (excluding nitrogen compounds)
- TSS is the amount of particulate matter (insoluble) present in a water sample, which is usually determined by filtering the solution and weighing the residue remaining on the filter.
- pH is the measure of acidity of solution in chemistry (defined as pH = -log[H+]). Acidic solutions, such as acid rain, may have pH around 1-2, relatively neutral solutions range within 5-9 (distilled water pH=7), and alkaline solutions have pH 10-14.
These limits determined by EPA are included in the government regulations, published in the Rules of Department of Natural Resources [CSR, 2014] [148]. This document also contains extensive data on limitations imposed on the contents of the toxic element in water before it is reused or discharged in a certain way to the environment. Check Table A for the maximum tolerated concentrations of metals (p.24) and organics (p. 26). The toxicity requirements are especially relevant to industrial water use.
Chemical tests to determine the above metrics are used as controls at any wastewater treatment plant. Various technologies are developed to improve the treatment efficiency and to produce a cleaner effluent suitable for further use.
Engineered ecological systems for water treatment
Traditional water treatment plants accomplish an important function. However, these facilities themselves produce significant environmental impact by consuming energy, producing emissions, by-products, and waste to be disposed of. Later in this lesson, an example is given for a life cycle assessment study which analyzes the way to make these systems more benign.
One of the trends in improving the environmental profile of wastewater treatment facilities is the design of ecological systems that mimic natural processes of neutralizing the pollution.
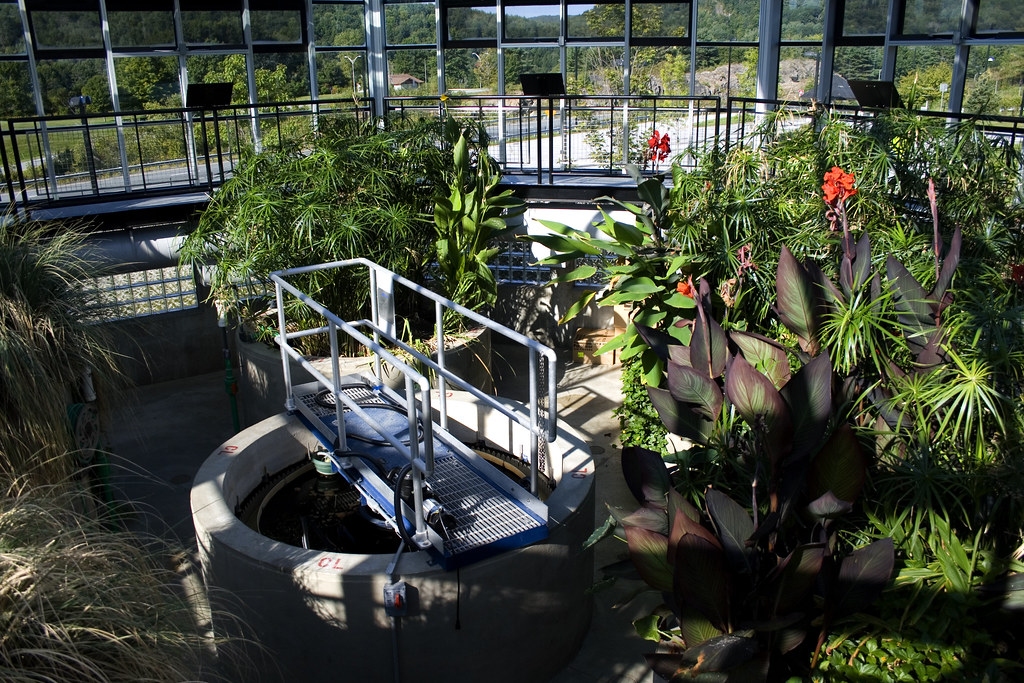
Here are a couple of examples of the development of such systems:
- Living Machine and Biomatrix systems [151] (see photo above):
- Eco-Machines systems [152] - ecological fluidized bed, or a small constructed wetland
These examples show that ecological treatment systems typically work at the small scale being capable to treat liquid waste from a community of 300-1000 people. This makes them attractive for decentralized treatment for secluded autonomous areas.
Decentralized systems for water treatment
Decentralized systems of water purification often become technologies of choice in developing countries because they do not require huge infrastructure or can be set up quicker when infrastructure is destroyed. Small-scale technologies provide quick response to urgent needs. There are multiple ways to approach the issue. Here is one of them: watch this 10 min video to see an example how small-scale technology can help solve large-scale problems.
Video: How to make filthy water drinkable (9:13)
Good morning, everybody. I'd like to talk about a couple of things today. The first thing is water. Now I see you've all been enjoying the water that's been provided for you here at the conference, over the past couple of days. And I'm sure you all feel that it's from a safe source.
But what if it wasn't? What if it was from a source like this? Then, statistics would actually say that half of you would now be suffering with diarrhea. I talked a lot in the past about statistics and the provision of safe drinking water for all. But they just don't seem to get through. And I think I've worked out why. It's because, using current thinking, the scale of the problem just seems too huge to contemplate solving. So, we just switch off: us, governments and aid agencies. Well, today, I'd like to show you that through thinking differently, the problem has been solved. By the way, since I've been speaking, another 13,000 people around the world are suffering now with diarrhea. And four children have just died.
I invented Lifesaver bottle because I got angry. I, like most of you, was sitting down, the day after Christmas in 2004, when I was watching the devastating news of the Asian tsunami as it rolled in, playing out on TV. The days and weeks that followed, people fleeing to the hills, being forced to drink contaminated water or face death. That really stuck with me. Then, a few months later, Hurricane Katrina slammed into the side of America. "Okay," I thought, "here's a First World country, let's see what they can do. "Day one: nothing. Day two: nothing. Do you know it took five days to get water to the Superdome? People were shooting each other on the streets for TV sets and water. That's when I decided I had to do something.
Now, I spent a lot of time in my garage, over the next weeks and months, and also in my kitchen -- much to the dismay of my wife. (Laughter) However, after a few failed prototypes, I finally came up with this, the Lifesaver bottle.
Okay, now for the science bit. Before Lifesaver, the best hand filters were only capable of filtering down to about 200 nanometers. The smallest bacteria is about 200 nanometers. So, a 200-nanometer bacteria is going to get through a 200-nanometer hole. The smallest virus, on the other hand, is about 25 nanometers. So, that's definitely going to get through those 200 nanometer holes. Lifesaver pores are 15 nanometers. So, nothing is getting through.
Okay, I'm going to give you a bit of a demonstration. Would you like to see that? I spent all the time setting this up, so I guess I should. We're in the fine city of Oxford. So -- someone's done that up. Fine city of Oxford, so what I've done is I've gone and got some water from the River Cherwell, and the River Thames, that flow through here. And this is the water. But I got to thinking, you know, if we were in the middle of a flood zone in Bangladesh, the water wouldn't look like this. So, I've gone and got some stuff to add into it. And this is from my pond.
(Sniffs) (Coughs) Have a smell of that, mister cameraman.
Okay. (Laughs) Right. We're just going to pour that in there.
Audience: Ugh!
Michael Pritchard: Okay. We've got some runoff from a sewage plant farm. So, I'm just going to put that in there. (Laughter) Put that in there. There we go. (Laughter) And some other bits and pieces, chuck that in there. And I've got a gift here from a friend of mine's rabbit. So we're just going to put that in there as well. (Laughter) Okay. (Laughter) Now.
The Lifesaver bottle works really simply. You just scoop the water up. Today, I'm going to use a jug just to show you all. Let's get a bit of that poo in there. That's not dirty enough. Let's just stir that up a little bit. Okay, so I'm going to take this really filthy water, and put it in here. Do you want a drink yet? (Laughter) Okay. There we go. Replace the top. Give it a few pumps. Okay? That's all that's necessary. Now, as soon as I pop the teat, sterile drinking water is going to come out. I've got to be quick. Okay, ready? There we go. Mind the electrics. That is safe, sterile drinking water. (Applause) Cheers. (Applause) There you go, Chris. (Applause)What's it taste of?
Chris Anderson: Delicious.
Michael Pritchard: Okay. Let's see Chris's program throughout the rest of the show. Okay? (Laughter)
Okay. Lifesaver bottle is used by thousands of people around the world. It'll last for 6,000 liters. And when it's expired, using failsafe technology, the system will shut off, protecting the user. Pop the cartridge out. Pop a new one in. It's good for another 6,000 liters.
So, let's look at the applications. Traditionally, in a crisis, what do we do? We ship water. Then, after a few weeks, we set up camps. And people are forced to come into the camps to get their safe drinking water. What happens when 20,000 people congregate in a camp? Diseases spread. More resources are required. The problem just becomes self-perpetuating. But by thinking differently, and shipping these, people can stay put. They can make their own sterile drinking water, and start to get on with rebuilding their homes and their lives.
Now, it doesn't require a natural disaster for this to work. Using the old thinking, of national infrastructure and pipework, is too expensive. When you run the numbers on a calculator, you run out of noughts. So, here is the "thinking different" bit.
Instead of shipping water, and using man-made processes to do it, let's use Mother Nature. She's got a fantastic system. She picks the water up from there, desalinates it, for free, transports it over there, and dumps it onto the mountains, rivers, and streams. And where do people live? Near water. All we've got to do is make it sterile. How do we do that?
Well, we could use the Lifesaver bottle. Or we could use one of these. The same technology, in a jerry can. This will process 25,000 liters of water; that's good enough for a family of four, for three years. And how much does it cost? About half a cent a day to run. Thank you.
So, by thinking differently, and processing water at the point of use, mothers and children no longer have to walk four hours a day to collect their water. They can get it from a source nearby. So, with just eight billion dollars, we can hit the millennium goal's target of halving the number of people without access to safe drinking water. To put that into context, The U.K. government spends about 12 billion pounds a year on foreign aid. But why stop there? With 20 billion dollars, everyone can have access to safe drinking water. So, the three-and-a-half billion people that suffer every year as a result, and the two million kids that die every year, will live. Thank you.
Click on the link below to read about some small innovations that make big difference when applied at the right place at the right time:
6 Water-purifying Devices for Clean Drinking Water in the Developing World [155]
Reading Assignment:
Next, let us get a little bit deeper into the issue. I ask you to read the following paper which analyzes a case study of a decentralized wastewater treatment system in India. It covers enough technical details to understand how the technology works and provides a useful discussion of environmental, economic, and social aspects:
Dhinadhayalan, M., Nema, A., Decentralised wastewater management - New concepts and innovative technological feasibility for developing countries [156], Sustain. Environ. Res., 22(1), 39-44 (2012). (The full article is accessible via Library e-Reserves in Canvas)
While reading, focus on understanding the pros and cons of the decentralized approach (compared to central distribution system). In your own notes, list three key advantages of decentralized technologies that justify their development and implementation. Also, list three disadvantages that may limit their use in different parts of the world. Can you imagine to use only de-centralized water treatment in your current location? What kind of social impacts might it create?
Check Your Understanding
The BOD is a measure of which type of pollutant in the water?
Click for answer.
Organic matter; BOD is the amount of oxygen needed to oxidize the organic compound in a given volume of water.
Check Your Understanding
Which stages in wastewater treatment are designed to decrease BOD of the effluent?
Click for answer.
Aerobic biological (bacterial) decomposition. Bacteria in a well-aerated pool are capable of decreasing BOD by over 90%
6.4. Metrics for assessment of water management technologies
6.4. Metrics for assessment of water management technologies
Now, as we have a long list and various scales of water treatment technologies, sustainability goals require their careful assessment in terms of environmental, economic, and social effectiveness. LCA analysis is a very common tool to select specific technologies for a particular sustainability system. Note that specific location, hydrological profile, and available infrastructure are pivoting factors in such assessment. LCA cannot be general - it has to be case-specific. Therefore, it would be best for us to consider a specific example that would describe LCA for a particular prospective water treatment technology.
Reading Assignment:
The LCA study referred to below is on a novel membrane-based technology for drinking water treatment. It compares conventional existing practice with a new method using comprehensive lifecycle inventory for both and applying LCA software for data interpretation. This article is a good example to follow when designing an LCA project:
Bonton, A., Bouchard, C., Barbeau, B., Jedrzejak, Comparative life cycle assessment of water treatment plants [157], Desalination 284, 42-54 (2012). (Full version of this article is accessible via E-Reserves in Canvas.)
This article contains a significant amount of technical details and chemistry data, which some of you may find hard to digest. You do not have to understand it all - your goal will be to follow through the methodology and understand the main steps that lead to authoritative conclusions. While reading, pay attention to the following aspects:
- The goal for this LCA study
- Motivation to consider the new water treatment method. Was there a problem with the existing practice?
- What is "functional unit" and how it is chosen?
- Criteria (metrics) chosen for assessment
- Software used for the analysis
- Results and conclusions: Can you read and explain the diagrams?
This real-life LCA project shows that proper assessment requires a great deal of technical detail and a significant amount of data. As a matter of fact, the authors had to perform an autopsy of system components to enlist all included chemical components with their potential environmental impacts at the stage of system manufacturing. Furthermore, operational data have to be closely tied to the specific demographic and geographic setting and the scale of application.
An additional thought on LCA: The output of LCA is quantified environmental impact, so it is most effectively used to compare alternatives - different products, systems, technologies, or methods. It has much less value when performed for a single product or a single technology since, without a clear reference point (a baseline), it is hard to tell if the impact small, large, or catastrophic, if the alternative brings improvement or makes things worse. Zero impact is probably not a good reference because no such ideal technology possibly exists. LCA also allows identifying the relative magnitude of various impacts. For example, we can determine if there is a particular project has a higher contribution to greenhouse gas emissions or to soil contamination, etc. In turn, this would help direct the mitigation measures - actions to reduce impact by redesigning the system, improving the process, or searching for an alternative.
Here is another example of comparative LCA (in the form of a slide presentation), which is related to three wastewater treatment strategies. This reading is optional, but also provides you with a good illustration of the approach.
Lyons, E et al., Life Cycle Assessment of Three Water Scenarios: Importation, Reclamation, and Desalination [158] (Arizona State University)
Check Your Understanding
Do you remember the main four stages of the technology lifecycle that are typically considered in LCA?
Click for answer.
1. Extraction of raw materials 2. Manufacturing 3. Operation / maintenance 4. Waste management / disposal
Do you remember the main four phases of an LCA project?
Click for answer.
1. Defining goal and scope 2. Life cycle inventory 3. Impact assessment 4. Interpretation of results
Summary & Activities
This lesson drew some connections between the global water resources and human needs for water. With the fast-growing population and fresh water needs, the balance in the hydrologic cycle and pollution of water resources become critical issues. While there are technologies in place to adapt natural water for human use and to adapt the human-used water for environmental use, their capacity and effectiveness are not always sufficient. Water conservation and reuse are other important strategies to complement the combined water cycle. Sustainable water management implies the systematic approach to the water resources and considers anthropogenic water flows and storages as parts of the universal water cycle. Because there is no substitute for water (like, for example, substitutes for fossil fuels), societies will continue demanding water in great amounts. Therefore, water management and treatment technologies will continue being top priority, and innovation in this area will play a key role in sustainability.
While there are many hot topics to review in this area (we did it to some extent and you should feel free to explore more background on your own), our main focus in this lesson is to learn how to evaluate prospective technologies based on the available information. This may be not a simple exercise, but rather a quite complex practical task. That is why it is important to tap into real-world studies and learn from them. Activities in this lesson give you some scenarios to work with and will hopefully provide you with some practice of evaluatory thinking.
| Type | Assignment Directions | Submit To |
|---|---|---|
| Reading | Complete all necessary reading assigned in this lesson. Do not forget to open the links in the text. Although many linked materials are considered supplemental (unless it is marked as "reading assignment"), you will benefit from including those materials in your learning - they give you a more complete story on the topic and contain great examples. | |
| Forum Discussion |
Use this online calculator [138] to determine the waste water generation rate at your household. You will need to check all question marks on the house model to supply specific information. In the end, go to "Show results", where you get statistics for your water use. Then take a look at your annual water bill (if available) - how does your actual water use compare to the number output by the calculator? (Calculator uses averaged data and assumptions for appliances but does not take into account individual conservation measures, so the results may differ) If you take your water use as an average (per household) in your area, can you estimate the total domestic wastewater generation in your hometown or area? How does that compare to the capacity of your local wastewater treatment facility? You may need to check your municipality websites for information such as capacity and the area they serve. |
Share your results in the Lesson 6 Discussion Forum. |
| Activity | Watch these two videos comparing biological and chemical methods of water treatment. Chemical vs. Biological Wastewater Treatment - Part 1 [159] Chemical vs. Biological Wastewater Treatment - Part 2 [160] In a brief (2 page max) report, express your opinion on the three questions: (1) Which type of water treatment seems to be preferable – indicate specific advantages; (2) What holds off the universal application of this preferable technology - indicate specific disadvantages or obstacles; (3) If you are asked to issue a recommendation on which type of treatment to use at your location, what key questions would you investigate as part of your decision-making? Feel free to search more information on the methods discussed in the videos and those used at your local area treatment plants. Submission deadline: Wednesday (before midnight) - check Canvas calendar for specific dates. |
Upload assignment in docx or pdf format to Lesson 6 Activity Dropbox. |
| Course Project | Revisit Lesson 12, which provides guidance on the Course Project. Unless you have already started, this is the time to work on the technical review for your course project. This interim report should summarize important operational data on your technology of choice. It should cover the operation principles, status of the technology, technical promise, readiness for implementation (TRL), areas of impact, technical obstacles (e.g., efficiency, design flaws, etc.), and examples of application (if any). Later, this report will serve as a resource for you to articulate technical information for your final project proposal. Please make sure to include proper citations for the information and images you use. Submission deadline: check Canvas calendar for specific dates. |
References for Lesson 6:
Bonton, A., Bouchard, C., Barbeau, B., Jedrzejak, Comparative life cycle assessment of water treatment plants, Desalination 283, 42-54 (2012).
CSR, Rules of Department of Natural Resources, Chapter 7: Water Quality, Code of State Regulations, 2014.
Dhinadhayalan, M., Nema, A., Decentralised wastewater management - New concepts and innovative technological feasibility for developing countries, Sustain. Environ. Res., 22(1), 39-44 (2012).
Girard, J.E., Principle of Environmental Chemistry, 3rd Ed., Jones & Bartlett Learning (2013).
US EPA Water Conservation Plan Guidelines, Appendix A: Water Conservation Measures, pp. 143-155, EPA (1998).
USDA, Conservation and the Water Cycle [133], Natural Resources Conservation Service, 2001.
USGS, Estimated Use of Water in the United States in 2005, [161] Circular 1344, 2009.
Vorosmarty, C.J., Sahagian, D., Anthropogenic Disturbance of the Terrestrial Water Cycle, BioScience, vol. 50, pp.753-763 (2000).
Lesson 7: High Performance Building Systems
7.0 Overview
Overview
Buildings are one of the most important elements of human societies, and the question of building sustainability is the key question in the context of development and lifestyle of any civilization. Buildings are recognized as the main energy-consuming systems and as one of the high performing greenhouse gas emitters. Furthermore, because people in Western society spend most of their time indoors, buildings have a strong impact on human health and well-being. Multiple issues and criteria of sustainable building design and operation are introduced in this lesson. Following the assigned readings, you will engage in forum discussion and will be asked to perform an activity focusing on the analysis of some of the metrics used in building evaluation.
Objectives
By the end of this lesson, you should be able to:
- understand the principles under sustainable building design;
- list the rating criteria for determining the environmental quality of buildings;
- apply metrics to building analysis and propose scenarios for improvement.
Reading Materials:
- Book: Green Building: Project Planning and Cost Estimating [162], RSMeans, John Wiley & Sons Inc., 2011. Selected chapters. See lesson sections for specific pages to read (See E-Reserves in Canvas).
- Web article: "The Future of Green Buildings May Be Closer than You Think [163]", Press release, Wharton University of Pennsylvania, May 06, 2013.
- Journal paper: Hakkinen, T., Helin, T., Antuna, C., Supper, S., Schiopu, N., and Nibel., S., Land Use as an Aspect of Sustainable Building, International Journal of Sustainable Land Use and Urban Planning, 1, 21-41 (2013). Selected pages.
- EPRI Report: Sustainable Water Resource Management: Vol. 2 Green Building Case Studies [164], Electric Power Research Institute, January 2010. Section 2.2.5 (pp. 2-21 to 2-27).
Questions?
If you have any questions while working through this Lesson, please post them to our Message Board forum in Canvas. You can use that space any time to chat about course topics or to ask questions. While you are there, please feel free to post your own responses if you are able to help out a classmate.
7.1 Introduction to Sustainable Building Concepts
7.1 Introduction to Sustainable Building Concepts

High-performance building – (also termed “green building” or “sustainable building”) – is called that because of:
- the higher efficiency of using energy, water, and other resources;
- reducing waste, pollution, and environmental degradation;
- protecting occupant health and improving human productivity.
High-performance buildings are designed, built, renovated, operated in a resource-efficient manner. The main objective of the "green building" strategy is to reduce the overall impact on human health and the environment.
Why did this idea of “building green” come up?
According to US EPA statistics, buildings in the U.S. account for 39% of total energy use, 12% of the total water consumption, 68% of total electricity consumption, and 38% of the carbon dioxide emissions. Furthermore, on the average, Americans spend up to 90% of their time indoors; hence, the built environment has a significant impact on human health, productivity, and emotional state.
Based on US EPA Green Building website [166], green buildings have environmental, social, and economic benefits:
Environmental benefits:
- enhance and protect biodiversity and ecosystems
- improve air and water quality
- reduce waste streams
- conserve and restore natural resources
Economic benefits:
- reduce operating costs
- create, expand, and shape markets for green product and services
- improve occupant productivity
- optimize life-cycle economic performance
Social benefits:
- enhance occupant comfort and health
- heighten aesthetic qualities
- minimize strain on local infrastructure
- improve the overall quality of life"
What exactly makes a "green building" sustainable?
This is the list of questions to explore when assessing the building design and operation:
Siting
- Is the location well suited to take advantage of the public transit system?
- Is existing natural landscape retained and protected?
- Is added landscape designed for low water and pesticide needs?
- Can compost be used?
- Do paving materials and furnishings use recycled materials?
Use of land
- What is the floor area of the building compared to land area used?
- Is the building disruptive to natural habitat?
- Does the building have a direct impact on the soil around it?
- Does the building change the recreational value of the land?
- Is construction site impact contained?
- Are any space efficiency strategies applied; is their shared or mixed use of space?
Energy Efficiency
- Does the building use the renewable electricity source?
- Are passive design measures, such as shape and orientation, are used to facilitate natural lighting?
- Are high-efficiency lighting systems with advanced lighting controls employed?
- Is there thermally efficient building shell?
- Does the roof use reflective or light colors to reduce cooling needs?
- Are efficient wall and ceiling insulation used to minimize heat exchange?
- Does the building use alternative energy sources such as solar power systems or fuel cells?
- Are computer automated energy regulation systems employed?
Materials
- Is the building constructed from easily extractable raw materials?
- Are the materials locally produced?
- Are reused and recycled materials used?
- Are materials with zero or low off-gassing, zero or low toxicity selected?
- Are the materials designed to be recyclable or reusable?
- What is the material lifetime, durability?
- Are there plans in place for regulating material lifecycle through construction, operation, and deconstruction phases?
- Is there a recycling program in place for building occupants?
Water Management
- Is there dual plumbing design for water reuse or a gray water system?
- Are there rainwater collection facilities?
- Is wastewater minimized by using ultra-low-flush toilets, low-flow shower heads, and other water conserving fixtures?
- Are point-of-use hot water heating systems used for distant locations?
- Are state-of-the-art irrigation controllers used to conserve water?
- Is there stormwater pollution mitigated?
Indoor Air Quality
- Are low emitting materials used in the interior?
- Is the ventilation system efficient and adequate to the occupancy?
- Are "green" cleaning supplies used during building operation?
- Is CO, CO2 monitoring systems installed?
- Are there operable windows for natural ventilation?
- Is a radon mitigation system in place?
- Is there a moisture control system?
Occupant Health and Comfort
- Is sufficient natural lighting accessible to building occupants?
- Is there sufficient noise insulation?
- Are low toxicity materials used?
- Are spaces efficiently organized for the comfort of work and movement?
Reading Assignment:
The following text elaborates some more on the concept of sustainable building and provides more explanations to the points listed above.
Karolides, A., Chapter 1. Green Building Approaches (pp. 3-24), in Green Building: Project Planning and Cost Estimating [162], RSMeans, John Wiley & Sons Inc., 2011. (See E-Reserves in Canvas.)
Look specifically through pages 3-24. Take notes on the main factors considered in the design of green buildings. Especially, pay attention to the key points of efficient resource use on p. 8. More systematic approach to scoring these factors is taken by the LEED rating system, which is introduced further in this lesson.
7.2 Assessment Tools for Sustainable Buildings
7.2 Assessment Tools for Sustainable Buildings
LEED rating system was developed by the U.S. Green Building Council (USGBC) in order to promote a holistic approach to construction and to encourage green certification of buildings. Rating systems developed under LEED allow projects to earn points in a number of categories that comprise the sustainability profile of the building project. LEED certification is flexible enough to apply to various facilities: homes, schools, healthcare facilities, large public sites, and even entire neighborhoods. Currently, it is a nationally recognized certification program.
The main categories of assessment in which buildings can obtain credits are:
- Sustainable sites
- Water efficiency
- Energy and atmosphere
- Materials and resources
- Indoor environmental quality
Go to the LEED website [167] to review the LEED rating systems. Here is the link to LEED Credit Library [168], which you may want to browse to see how points are scored by various building design features. Certification through LEED is quite a sophisticated process, which requires disclosure of a large amount of data, so it would be best for us to turn to specific examples of LEED-certified projects to understand how this assessment works.
Reading Assignment:
Look through the case studies of LEED certified projects on pp. 35-67 of the document "Regional Green Building Case Study Project: A post‐occupancy study of LEED projects in Illinois". Choose at least three different cases to read in detail.
Pay attention to the specific metrics used to compare different buildings. Some of those metrics are: energy use intensity (EUI) (see definition on p. 9), CO2 emissions, and water use (see definition on p.18).
This reading material is available in the Lesson 7 Module in Canvas.
The comprehensive approach and broad scope of the LEED certification has an advantage of wide applicability. So the whole buildings of various size, location, and function can be evaluated within the same system. At the same time, sometimes you can see buildings that are very energy efficient, zero-carbon, water-conserving, and still are not LEED-certified, just because they do not cover all the multiple attributes necessary for that certification. Because of that, it is sometimes useful to apply a single metric to evaluate one specific feature or function of a building.
For example, ENERGY STAR [169] is a single-attribute rating system that only evaluates energy performance. WaterSense [170]is a single-attribute rating system for water conservation. There are a number of other systems and metrics. Some of those will be considered in the following sections under the specific attributes they relate to.
There are four principles that a good assessment system should follow - it should be:
- science-based – results and decisions must be reproducible by others using the same approach;
- transparent – the standards and scoring procedure should be open for examination;
- objective – there should be no conflict of interest in the certification body;
- progressive –the system should advance industry practices.
Here are some examples of sustainable buildings in the U.S.:
The Philip Merrill Environmental Center [171] is recognized as one of the "greenest" buildings ever constructed in the United States. When it was constructed, special consideration was given to material selection and energy use. This facility was the first building to receive a Platinum rating through the U.S. Green Building Council's LEED Rating System.
Pittsburgh's 1,500,000-square-foot David L. Lawrence Convention Center [172] was the largest "green" building in the world, when it opened in 2003. It received Platinum LEED certification in 2012.
Sota Construction Services office building [173] (Pittsburgh, PA) features a super-efficient thermal envelope using cob walls. It also has other energy-saving features: a geothermal well, radiant heat flooring, roof-mounted solar panel array, and day-lighting features. It earned a LEED Platinum rating in 2012 and received one of the highest scores by percentage of total points earned in any LEED category, making it the "greenest" building in Pennsylvania and in the top ten greenest in the world.
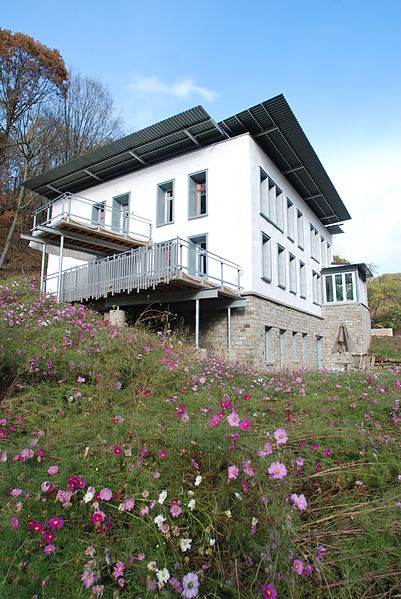
Supplemental Reading
More information on LEED and other building rating systems is given in the following optional reading:
Macaluso, J., Chapter 9. Rating Systems, Standards, and Guidelines (pp. 236-257), in Green Building: Project Planning and Cost Estimating, [162] RSMeans, John Wiley & Sons Inc., 2011 [available online through PSU library system].
LEED summary is provided in pages 236-238. Some other whole-building assessment systems, including those developed in European nations, are briefly described on pp. 241-247. Some of the single-attribute rating systems are described on. 248-257.
7.3. Building Energy Use Intensity
The Energy Use Intensity (EUI) metric is easy to calculate if you know your building’s annual energy use. The most accurate way is to look at your energy bills. Take the total annual amount of energy used and divide it by the total floor area of the house or building:
EUI [kbtu/sf/year] = Annual Energy Use [kbtu/year] / Area [sq.ft]
Before using this metric in analysis, we need to understand the difference between the gross EUI and net EUI metrics and what they indicate.
The gross EUI reflects the total building’s energy demand and includes all available sources: electricity, natural gas, renewables, and delivered fuels. No matter from what sources your energy comes, the building will require a certain amount of energy for annual operation, and this is what is accounted. Thus, the gross EUI will depend on the efficiency of the building envelope, design, and purpose. At the same time gross EUI will not be dependent on the type of energy you choose, it will only depend on the characteristics of the building itself.
For example, if House A uses grid electricity, natural gas for heating, and has a solar module to provide some of the electric needs, all of those sources need to be included in the equation:
Gross EUI (House A) = (E(elec) + E(gas) + E(solar)) / Area
Even though the solar energy contribution is free (generated on site), it still works to balance the energy demand of the house.
If the neighboring House B has the same design and energy demand, but uses only grid electricity to meet its energy needs, its Gross EUI will be expressed as follows:
Gross EUI (House B) = E(elec) / Area
The value of the Gross EUI of the two houses will be the same or close.
The Net EUI reflects the difference between the gross energy demand and on-site generation. This is the metric that can characterize a building on the net zero scale. In this case we need to define the Renewable Production Intensity (RPI), which is essentially all energy supplied by on-site renewable sources, primarily solar, in kbtu/year divided by the total floor area of the building.
Following up on the example above:
RPI (House A) = E(solar) / Area
RPI (House B) = 0
Then we can express the Net EUI as follows:
Net EUI (House A) = Gross EUI – RPI = (E(elec) + E(gas)) / Area
Net EUI (House B) = Gross EUI – RPI = Gross EUI
In case of House B, since there is no on-site generation, the gross EUI is equal to net EUI. In case of House A, the net EUI will be lower since we exclude onsite renewable generation. In the marginal case, when all energy demand of the house is met by on-site renewable generation, Net EUI = 0, i.e. we have the net-zero energy balance.
In case of a grid-bound solar system, the electricity bill will reflect the net kilowatt-hours taking into account consumption and on-site generation. So the easy way to calculate the Net EUI would be just using your utility bills for purchased energy:
Net EUI = E(elec) + E(gas) / Area
To calculate EUI in kbtu/sf/year (this is how it is presented in the LEED studies), you need to convert your energy units from all sources to kbtu and present the area in square feet.
The following conversion factors can be used:
- Electricity (both grid and onsite solar): 1 kWh = 3.412 kbtu
- Natural gas: 1 therm = 100 kbtu
- Fire wood for space heating: 20,000 kbtu/cord*
*Note: energy content of fire wood would depend on the type of wood and vary. The given value is an average that can be used as first approximation.
Self-check questions:
1. Mr. Morningstar uses 50,400 kbtu of energy a year at his residence of total area 1,800 square feet. What is the Gross EUI of his house?
- (A) 50,400
- (B) 32
- (C) 28
- (D) 16
Click here for explanation to this question
2. Mr. Morningstar installed a solar module on his roof, which now supplies 50% of his annual energy need. How did the Gross EUI of his house change?
- (A) Decreased by 50%
- (B) Increased by 50%
- (C) Did not change
- (D) Impossible to answer
Click here for explanation to this question
3. Next, Mr. Morningstar installed additional insulation in his house and new air-tight windows, which decreased the house’s energy demand by half. How did the Gross EUI change?
- (A) Increased by half
- (B) Decreased by half
- (C) Did not change
- (D) Impoassible to answer
Click here for explanation to this problem
4. Based on the conditions described in questions (1)-(3), does Mr. Morningstar have a net-zero house?
- (A) Yes (or close)
- (B) No, half way to go from his original point
- (C) Impossible to answer
Click here for explanation to this problem
It should be noted, though, that within a certain month during the year, the net-zero condition may or may not be achieved. For example, in winter higher energy demand for heating may not be matched by seasonally decreased solar generation. At the same time, extra energy generated over the summer months would be fed to the grid and can be used to offset the winter deficit.
5. Mr. Morningstar decided to live in the tent all the way through the summer. What is the gross and net EUI of his dwelling? Explain.
Click here for explanation to this question
Weather-normalized EUI
What if we have two buildings of similar size located in different climate zones? One – in Minnesota and the other – in California. The first building has EUI of 28 and the second has EUI of 20. Would it be fair to say that the second building is more energy efficient?
As the matter of fact the first building may require more energy through the year not because of its inefficiency, but due to much higher heating load. After all it is placed in much more severe environment and has to withstand much more drastic temperature gradients, especially in the winter time.
To provide a fair comparison of the buildings in this case, we can use weather-normalized EUI. This is the metric that takes into account the weather, specifically heating and cooling needs, which can be expressed as heating degree days (HDD) and cooling degree days (CDD).
Weather-normalized EUI = EUI / (HDD+CDD)
If you never heard of heating and cooling degree days [175], please check out this link. Those are common measures used to estimate the heating and cooling capacities needed for a building. Degree days indicate for how many days the outside temperature stays below or above the reference point of 65 F (this is the standard temperature by convention!). Degree days can be counted for any time period – a day, a month, or a year. Let me give you a short example.
Today’s average outside temperature (mean between the low and high) in my hometown State College, PA is 40 F. It is below the standard temperature, so I can count heating degree days as follows:
HDD = (65F – 40F) x 1 day = 25 [deg F.day]
If on a summer day, the average outside temperature is 70 F, which is above the standard temperature, I can count the cooling degree days for that day as:
CDD = (70F – 65F) x 1 day = 5 [deg F.day]
These numbers indicate how much energy I may need to spend for heating or cooling on a specific day. Adding the HDD and CDD for the entire year would give me a measure of energy demand to expect for the heating and cooling season. Typical annual degree day counts for my Middle Atlantic region are HDD 5780 and CDD 877, according to U.S. Energy Information Administration (EIA).
Let us come back to the case of two houses placed in different climate zones. We are going to compare data for those two locations in the table:
| Location | EUI (house) [kbtu/sq.ft/yr] |
HDD | CDD | Total DD | Weather-normalized EUI [btu/sq.ft/yr/deg.day] |
|---|---|---|---|---|---|
| Minnesota | 28 | 6969 | 1134 | 8103 | 3.5 |
| California | 20 | 3168 | 1006 | 4174 | 4.8 |
From this calculation, we see that the house in California in fact spends more energy per degree day than one in Minnesota to keep the temperature at the comfort level. So the ultimate conclusion is that the building envelope of the first house is more energy efficient.
The above-discussed metrics for house energy efficiency will be included in your lesson activity, so you will have a chance to apply those to your own residence and compare it to others.
Self-check question
Calculate weather-normalized EUI for a building located in Atlanta, GA, if its annual energy use is 75,000 kWh and its floor area is15,000 sq.ft.
Tip: first try and see if you can solve it in your notes before checking the answer
Click here for the solution
SOLUTION:
This is a multistep problem. First, you need to convert energy units from kWh to kbtu:
75,000 kWh/yr x 3.412 kbtu/kWh = 255,900 kbtu/yr
Then we divide by square footage of the building to find EUI:
EUI = 255,900 kbtu/yr / 15,000 sq.ft. = 17.06 kbtu/sq.ft/yr
Now we need to relate it to the total degree days in Georgia: based on EIA’s map:
HDD + CDD = 2630 + 2413 = 5043
Finally, weather-normalized EUI = 17.06 kbtu/sq.ft/yr x 1000 btu/kbtu / 5043 deg.day = 3.38 [btu/sq.ft/yr/deg.day]
7.4 Sustainable Building Materials
7.4 Sustainable Building Materials
Refer to the following reading source to learn about the sustainable choices in building materials and some criteria of their selection.
Reading Assignment:
This chapter takes a tour over the key material classes used in buildings. There are conventional choices and some alternatives. As you read, take note of pros and cons of switching to "greener" alternatives.
Karolides, A., Chapter 2. Introduction to Green Building Materials and Systems (pp. 27-66), in Green Building: Project Planning and Cost Estimating [162], RSMeans, John Wiley & Sons Inc., 2011 (See E-Reserves in Canvas.)
What to pay attention to in Chapter 2:
On pages 27-30, you read the general discussion on the existing problem with construction materials, which justify the goals and criteria for choosing sustainable materials. Some of the important metrics used to classify and to characterize the materials are embodied energy (explained on p.29), durability, reuse/recycling potential, and quantified impacts on the environment and human health. Read carefully the summary on p.30, which provides a definition of sustainable building materials.
On pages 31-37, you will go through the list of the most important classes of materials used in buildings. These include: concrete, masonry, metals, wood, plastics, and composites. Scan through to learn about the typical uses of those materials.
Further, on pages 37-51, we consider different functions materials perform within the buildings - insulation, moisture protection, vapor diffusion and air flow retardation, waterproofing, ventilation, roofing, providing openings, surface protection, and decoration. The text overviews the material alternatives that exist for fulfilling those functions. This is a good background read for anyone who is not very familiar with the construction industry.
Pay attention to special metrics (R-values, U-values) used to characterize insulation materials since those are related to energy efficiency of the building. The higher R-value typically indicates a higher insulating power of a material. Be careful, however, checking the units, as SI and US systems work on different scales. Also, the specific R-value that is a characteristic of a material is different from the total R-value of a building structure, which takes into account the thickness of insulation. You can find an additional explanation on this R-value (insulation) Wikipedia page [176]. The values given in Figure 2.1 of the textbook are given per inch of thickness.
Pages 51-63 of the text review different types of equipment used in buildings. This is a very general review; just scan through it quickly.
Pay more attention to pages 63-64, which describe less conventional green materials (with low embodied energy). Think what the pros and cons of those natural alternatives are and where those materials can be practically used.
As you can perceive from this reading, one of the overarching objectives here is to select materials that have high degrees of renewability, reusability, and durability and at the same time have low environmental impact and low embodied energy.
How would you guide your selection? The principles of selection of alternatives discussed in Lesson 4 of this course apply here as well. The process may involve lifecycle analysis for some of the materials and also multi-criteria analysis to ensure the highest feasibility and lowest impact.

Sometimes, it is not easy to make a definite conclusion about the sustainability of particular materials. The question of sustainability requires wider thinking, which not only describes the material nature, environmental properties, and possible impacts. Sustainability also assumes identifying the specific fate of that material in a particular locale.
For example, if we consider refractory (fired) bricks as a common construction material, would those be a sustainable choice for construction? It really depends on a wider view on material lifecycle. Bricks are produced from extracted earth materials (such as clay) by firing in a furnace. Energy is needed to heat that furnace. In one case, if we burn coal to fire furnace to make bricks, it does not look like a sustainable production. Coal is a fossil fuel (non-renewable), and burning creates significant carbon emission, so this makes brick production apparently not a sustainable choice. But can that furnace be heated using a renewable energy source? For instance, can we use an electric furnace with electricity produced via solar power generation? Without going deeper into the feasibility of that choice, we can immediately see an opportunity to make this process sustainable. On the other end of the story, if the building gets demolished, where do the bricks go? If they contribute to deconstruction waste and are hauled to the dump, non-sustainable practice results. But if there is a plan of responsible demolishing, and if we know that those bricks will be separated from other waste, shipped to the processing facility around the corner, crushed, and re-used as new bricks or as coverage for the jogging trail in the town park, we have a much better feeling about it.
The routes defining the material fate should be outlined at the planning stage, and appropriate system analysis should help with that; and further, the material lifecycle should be regulated according to that plan. That said, sustainability is not so much about materials, but more about design and managing strategy. Also, the sustainability system usually has wider boundaries than the building itself, so sustainable buildings cannot be assessed apart from their infrastructure.
Lifecycle Building
Lifecycle building is known as design for disassembly and design for deconstruction. This innovative approach encourages creating buildings that provide resources for future buildings.
The lifecycle building initiative was catalyzed by a number of problems. According to U.S. EPA [179]:
- more of the 100 million tons of building-related construction and demolition debris are sent to landfills in the United States each year;
- construction and demolition debris comprises about 40 percent of the solid waste stream;
- reusing building components reduces the energy and greenhouse gases emissions associated with producing and transporting building materials;
- between the years 2000 and 2030, an estimated 27 percent of existing buildings will be replaced, and 50 percent of the total building stock will be constructed.
Lifecycle building approach implies easier building material recovery and reuse, thus reducing energy and resource consumption.
Check Your Understanding:
Which of the following are keys to sustainable use of building materials?
(a) Capacity to be recycled at the end of the building lifecycle
(b) Low toxicity towards humans
(c) Low embodied energy
(d) Local manufacturing or acquisition
(e) All of the above
Click for answer.
When we say that the embodied energy of concrete is 1.9 MJ/kg and the embodied energy of plastic is 90 MJ/kg, what does that mean?
Click for answer.
That means that all processes that result in the production of 1 kilogram of concrete have used 1.9 megajoules of energy; and 90 megajoules in case of plastic. Embodied energy is a kind of accounting measure to estimate the environmental cost of a product or material. Materials with lower embodied energy put less load on the environment.
If fiberglass panel has the R-value of 2.5 and straw bale has the R-value of 1.45, which of these two materials would be preferential as a thermal insulator from the standpoint of heating-cooling efficiency and related energy savings?
Click for answer.
Fiberglass panel has a higher R-value and therefore has better insulating properties. However, be careful relying on R-value alone for decision-making because it only considers diffusive heat transfer with no air pressure difference.
7.5 Energy and Use of Sun
7.5 Energy and Use of Sun
Efficient use of energy is one of the key targets of high performance buildings. There are two main strategies pursued: (i) conservation of energy through more efficient building design and (ii) on-site power generation through energy-conversion technologies. The options for the power generation include renewable and no-emission resources, such as solar, wind, and geothermal energy, depending on the building setting preferences. A sustainable building can be still connected to the grid, but should be much less reliant on it and, in some cases, can even feed some of the extra energy produced on site back to the grid (net-zero energy building concept).
Let us start with the following chapter reading. This reading will introduce you to the main systems and energy interactions inside a building. It also contains useful terminology.
Reading Assignment:
Armstrong, J., Chapter 4. Efficient Use of Energy and Other Resources (pp. 83-115), in Green Building: Project Planning and Cost Estimating [162], RSMeans, John Wiley & Sons Inc., 2011. (See E-Reserves in Canvas.)
Read pages 83-90 to learn about the main aspects of energy regulation in buildings, and scan through pages 90-112 to become familiar with the main strategies and technologies used in green design.
One of the ideas we can get from this reading is the importance of flexibility and tunability of design. Designing and building for variable conditions allows for significant energy savings and more efficient use of resources when it is needed. For example, one of the cornerstones of green building designs is proper ventilation. Sensitive ventilation, such as adjusting ventilation requirements based on human occupancy, is one of the sources of energy saving.
Such tunable designs require special technologies for monitoring and control. For example, Air monitoring technologies, such as sensors, "smart controls" can be of great benefit in the regulation of high occupancy spaces (conference rooms, auditoriums) in terms of total required energy. Technology is currently available that monitors the CO2 levels in the space. Occupancy sensors can be used to turn off light in occupied spaces.
Net Zero Energy Building
One of the very attractive concepts in building design is net zero energy building (NZEB). In brief, it means that energy generated by the building offsets the consumed energy by the building operation. In that case, ideally, the building does not require grid and can sustain itself. This concept is currently under development, but some successful examples of its implementation already exist. Read the following web article to get a deeper insight into this topic.
Reading Assignment:
"The Future of Green Buildings May Be Closer than You Think [163]", Press release, Wharton University of Pennsylvania, May 06, 2013.
This article discusses the Net Zero Energy Building (NZEB) philosophy and some successful examples of it in several locations of the U.S. We will continue discussing this concept on the forum this week!
Optimizing use of the sun
Many existing homes and buildings heavily rely on oil, coal, and natural gas as fuels to heat and cool our homes. If not burning those fuels directly, we consume electricity from the grid, anyway, much of that electricity coming from the fossil fuel power plants. Those fuel resources are expensive, create pollution, and they are also being depleted rapidly. This makes attractive the strategy to adapt buildings for using the solar energy, which is an unlimited resource.
There are active and passive strategies for sun use:
Active strategies
Active strategies use solar photovoltaic (PV) panels or solar collectors to turn the solar radiation into electric energy or thermal energy. The technical principles of operation of PV and solar thermal technologies will be considered in more detail in another lesson, specially devoted to energy. Currently, many residential and commercial buildings are being evaluated for installation of active solar systems. While some are very well positioned to accommodate such on-site energy converters, others may be less suitable. Decision may be driven by such factors as: building design, shading structures, solar resource at the location of interest, building energy need compared to the system capacity, available roof or ground area for installation, and building aesthetics.
Passive strategies
Passive strategies include features and adaptations in the building envelope and smart use of the natural solar activity. The passive approach does not imply installation of a separate solar energy conversion system, but rather utilizes features of building design. For example, a house can be oriented to minimize summer afternoon solar heat gain and to maximize winter solar heat gain. If the building is located in the Northern Hemisphere, the long sides of the house are made facing south and north while roof overhangs and landscaping are built to shade the east, south, and west sides. Alternatively, house design can take advantage of prevailing breezes during the spring, summer, and fall. Natural air movement is valuable for cross-ventilation of the house. In addition, foliage of trees and shrubs that create shade around your house helps keep the house cool, while bare branches in winter let the sunlight through to warm the house.
In passive system design, many physical parameters are manipulated to achieve the balance of heat distribution. There is a lot to learn in terms of how the light transmitting and absorbing surfaces are geometrically positioned, and what materials are used. You would have to turn to an architectural design course to become better educated on this topic, should you have interest. A couple of links below would give you some examples of passive solar strategies, if you are interested to learn more.
Supplemental Reading:
Read more about the passive strategies for optimized use of the sun:
"Passive Solar Design [180]" Sustainable Sources, 2014.
Check Your Understanding:
Check your physics background. Name three types of heat transfer in the buildings.
Click for answer.
Heat conduction, Convection, Radiation
What is the difference between these heat transfer mechanisms?
Click for answer.
Conduction (or diffusion) of heat occurs due to temperature gradient across a space or material. After reaching thermal equilibrium, both temperatures become equal. Convection is transfer of heat associated with a flow - for example: air flow due to a pressure gradient. Radiation is emission of thermal energy in the form of electromagnetic waves - for example: emission of heat from the sun or a hot object. Unlike conduction and convection, radiated energy can be concentrated and used for power generation.
What are the main sources of heat gain in the buildings?
Click for answer.
Solar gain through windows, electric lighting equipment, people occupying space, heat conduction through roof and walls.
How trees can be part of green envelope design?
Click for answer.
For example, trees can provide seasonal shade, reducing the need for mechanical cooling.
7.6 Use of Land
7.6 Use of Land
Land use by buildings is a significant aspect in sustainable development. We can recognize direct use (because buildings and their related infrastructure occupy a certain land area for their entire lifetime) and indirect use due to impact on land via extraction of raw materials for construction, waste disposal, etc. Both types of land use impact should be considered in environmental assessment.
Here are some key land use impacts [Hakkinen et al., 2013]:
- Soil sealing
- Soil compaction
- Change of land use
- Fragmentation
- Extraction of raw materials
- Reduction of biodiversity
Read the explanations to these impacts on pages 24-26 of the following article:
Reading Assignment:
- Journal paper: Hakkinen, T., Helin, T., Antuna, C., Supper, S., Schiopu, N., and Nibel., S., Land Use as an Aspect of Sustainable Building, International Journal of Sustainable Land Use and Urban Planning, 1, 21-41 (2013).
This reading material is available in the Lesson 7 Module in Canvas.
To propose strategies to improve the building design with respect to land use, those impacts need to be assessed and possibly quantified. Introduction of metrics helps compare buildings and refer them to certain standards of advanced or poor practice. Land use indicators can be either included in the LCA for buildings or be used independently.
Examine the land use metrics proposed in some European countries in Tables 2 and 3 of the above reading [Hakkinen et al., 2013].
What are strategies to create avenues for more sustainable land use by buildings? Some of those strategies are:
- urban densification;
- complexity and mixed use;
- green zoning;
- accessibility to public services and transport.
Read about them on pages 34-35 of the Hakkinen’s paper.
Check Your Understanding:
What are adverse consequences of soil sealing?
Click for answer.
Loss of soil functions, such as crop production, water retention, chemical absorption
Can you define fragmentation impact? What environmental consequences it may have?
Click for answer.
Fragmentation involves isolation of natural habitats due to construction, disruption of ecological corridors and pathways. It increases vulnerability of ecosystem and decreases its resiliency.
What of the following would give a building a higher score on the land use metrics?
(a) Building plot has a large waterproof area.
(b) Significant amount of rainwater is retained on site.
(c) 10% of vegetated plot area.
(d) Ecologically useful plot area <50%.
Click for answer.
7.7 Indoor Air Quality
7.7 Indoor Air Quality
Indoor pollution consistently ranks among the top five environmental risks to public health. Because, by statistics, Americans spend up to 90% of their time indoors, the impact of building environment is increased compared to outdoor environment. Many air quality technologies need to be planned at the design stage of the building, since accumulation and removal of contaminants is largely dependent on air flow, moisture condensation patterns, and other physical properties. Physics and flow dynamics of the building need to be understood thoroughly in order to be used to the occupant benefit.
What are the main factors that can potentially make the indoor air a health problem?
Refer to the following reading source to study this question.
Reading Assignment:
Armstrong, J., Chapter 7. Health, Comfort, and Productivity (pp. 172-182), in Green Building: Project Planning and Cost Estimating [162], RSMeans, John Wiley & Sons Inc., 2011 [available online through PSU library system].
This reading introduces you to the main issues related to indoor air quality in buildings, as well as the methods and technologies to maintain it or improve it.
Check Your Understanding:
List typical measures to ensure good indoor air quality in buildings.
Click for answer.
*provide ventilation (passive or active design)
*minimize off-gassing - for example, select materials free from formaldehyde, VOCs, and other toxic chemicals
*prevent mold - for example by using moisture intrusion retarders and water-proofing
*mitigate noxious gases - radon, carbon monoxide, carbon dioxide, ammonia - by monitoring and design for removal
*mitigate dust (particulate matter) - for example, by air filtering and vacuuming
7.8 Building Hydrology Systems
7.8 Building Hydrology Systems
All buildings must use water for daily operation, but statistics indicate that currently employed buildings (residential or business) use too much of it. Centralized water supply and treatment creates an impression of abundance of water resource, but is virtually inefficient in showing how much water is actually used rather than wasted. Sustainable building designs target to improve that efficiency, implementing reuse systems within them and promoting water conservation through a number of technologies and strategies.
Reading Assignment:
Armstrong, J., Chapter 4. Efficient Use of Energy and Other Resources (pp. 115-118), in Green Building: Project Planning and Cost Estimating [162], RSMeans, John Wiley & Sons Inc., 2011 [available online through PSU library system].
Read pages 115-118 to learn about the main aspects of water conservation strategies in buildings.
Here are some of the features of resource-efficient building hydrology systems:
In resource-efficient buildings, plumbing fixtures that use minimum amounts or zero water represent important water conservation technologies. These technologies include:
- composting toilets, low-flow toilet (0.8 gal/flush), waterless urinals;
- low-flow shower heads (less than 2.5 gal/min);
- low-flow faucets (less than 2.5 gal/min), metered faucets.
Gray water systems allow reuse of the water coming from sinks and washing machines for toilet flushing and irrigation. Gray water can be reused directly or after cleaning with on-site sand filters.
Waste heat recovery systems can capture heat from the used gray water going down the drain and use it for heating the clean water. Heat recovery can be especially efficient in facilities with extensive hot water use (e.g., laundries, locker rooms).
Instead of trying to list all possible technologies and tactics related to sustainable water management in buildings and characterize them generally, it would be more useful to study a good example of practical implementation. Here is a report that describes a few case studies of sustainable buildings, which includes quite detailed characterization of their water management features.
Reading Assignment:
Sustainable Water Resource Management: Vol. 2 Green Building Case Studies [164], Electric Power Research Institute, January 2010.
Read only section 2.2.5 (pp. 2-21 to 2-27) Sustainable Water Management Features. This part of the report not only explains the design and function of all the technologies used in the building, but also shows how they enabled LEED certification of the building.
Summary & Activities
Summary & Activities
This lesson overviews the key aspects of high performance buildings. The bottom line here is that different systems inside the building require specific technical knowledge, so creating a sustainable building is a collaborative, multi-expert task. All of the design and technology efforts typically target two main directions: resource use efficiency and human health. Because of the complexity of building design, assessment of buildings requires a comprehensive framework, such as LEED, which was adopted as a universal metric set in the U.S. It is not the only certification system for buildings, but is probably the most well known and widely used in assessment of public facilities and large common use buildings. While we do not go through every step of the LEED system here, we explore a few common metrics and study several examples. The design + technology collaborative thinking made a Net Zero Energy Building a reality, so this lesson also took a brief tour of that concept.
| Type | Assignment Directions | Submit To |
|---|---|---|
| Reading | Complete all necessary reading assigned in this lesson. | |
| Forum Discussion |
Read the web-article "The Future of Green Buildings May Be Closer than You Think" [163] about the net-zero-energy building philosophy. Write a short post (<200 words) expressing your opinion on the following question: What are three most important features/qualities of a net-zero-energy building? Defend your opinion, presenting another example of such a building found on the web. Provide comment to at least one other post by your classmates. |
Canvas: Lesson 7 Discussion |
| Activity |
A. Perform a simple energy audit of your current house or residence and calculate the following LEED metrics: (a) energy use intensity (EUI) in kBtu/sf/year, (b) greenhouse gas emissions (GGE) in lb CO2e/sf/year. Compare your results to the numbers in LEED case studies in Section 7.2 of this lesson. Deadline: Wednesday (before midnight) - check Canvas calendar for specific deadlines. |
Canvas: Lesson 7 Activity |
References:
Green Building: Project Planning and Cost Estimating, [181] RSMeans, John Wiley & Sons Inc., 2011.
Hakkinen, T., Helin, T., Antuna, C., Supper, S., Schiopu, N., and Nibel., S., Land Use as an Aspect of Sustainable Building [182], International Journal of Sustainable Land Use and Urban Planning, 1, 21-41 (2013).
Lesson 8: Applied Renewable Energy Technologies
8.0 Overview
Overview
In Lesson 8, we will overview several renewable energy technologies that are currently considered the main players of the future sustainable energy economy. It would not be realistic to cover all technical details of these technologies within one lesson, and this is not our goal here. Your main focus in this lesson should be to grasp the basic idea of how these technologies operate, how their performance is compared to conventional energy options and to each other, and what is the promise. In the end of this lesson, you will be asked to perform an activity on the comparison of some energy technologies by several metrics that are relevant in sustainability analysis. Some examples of metric calculations and some technology applications are also included in this lesson.
Learning Objectives
By the end of this lesson, you should be able to:
- articulate the fundamentals of the key alternative energy technologies;
- understand standard metrics for analyzing and comparing alternative energy technologies.
Readings
You will be asked to read the following sources throughout the lesson. Please excuse the large number of readings – renewable energy is an extremely versatile area to cover. Some of these sources are concise and contain introductory information that will not require too much time to work through.
Website: Christiana Honsberg and Stuart Bowden, PV-Education.org [183]
Web article: "Solar Thermal Power Plants. Technology Fundamentals [184]," Renewable Energy World, 06/2003, pp. 109-113.
Web article: How Geothermal Energy Works [185]”, UCS, 4/1/2014
Book chapter: F.M. Vanek and L.D. Albright, Energy Systems Engineering. Evaluation and Implementation, McGraw Hill, 2008 – Chapter 12 Wind Energy Systems, pp. 331-366.
NREL Report: R. Thresher, M. Robinson, P. Veers, Wind Energy Technology: Current Status and R&D Future, [186] NREL, 2008.
EPA Report: Biomass Combined Heat and Power Catalog of Technologies [187], U. S. Environmental Protection Agency, Combined Heat and Power Partnership, September 2007. Chapter 5: Biomass Conversion Technologies, pp. 30-61.
Web article: "Environmental Impacts of Renewable Energy Technologies [188]," Union of Concerned Scientists, 4/26/2014
Questions?
If you have any questions while working through this Lesson, please post them to our Message Board forum in Canvas. You can use that space any time to chat about course topics or to ask questions. While you are there, please feel free to post your own responses if you are able to help out a classmate.
8.1 Renewable Energy Basics
8.1 Renewable Energy Basics
Renewable energy has been a catchphrase of recent decades. It has been both the subject of government policies and extensive research. We are searching for efficient ways to move from the easily accessible but finite fossil fuel energy to other types of energy available on earth that are either unlimited or can be replenished within a much shorter timescale.
We have one lesson to review this topic. This does not allow us to go anywhere in depth while discussing specific technologies, but we will take some time to consider a few examples of how the renewable energy technologies are chosen, implemented, and assessed from the sustainability standpoint.
The term renewable essentially means that the energy source is not exhaustible on a human timescale. This, however, does not always mean that it has infinite capacity or constancy. We will see that different sources of renewable energy have different limitations, which must be taken into account when tuning the technologies to a particular application and locale.
The main types of renewable energy resources are schematically summarized below:
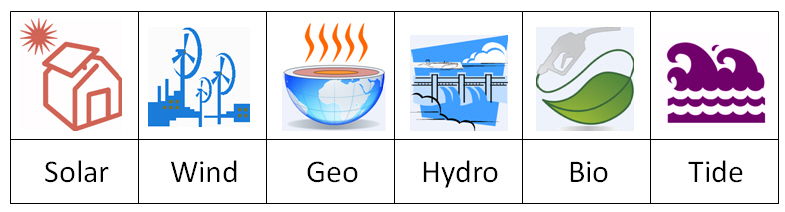
The technologies that are designed to convert the above kinds of available natural energy to usable power or heat are expected to play significant roles in future energy economy. However, markets involving those technologies are still developing, and at the moment it is not so easy to predict which of them will become most prominent.
I am sure you are somewhat familiar with the operating principles of these technological systems. You may be still curious to look through the Renewable Energy Wikipedia article [189] to refresh your basic knowledge on those types of energy conversion. Consider this as an optional resource unless you feel you have serious background gaps to fill.
Because we will be going through some numerical examples involving energy, it would be also useful to have a refresher on terms and units.
Quick refresher on energy terms and units
Energy is the capacity of a system to perform work. Energy is also an extensive quantity, measured by amount. Thus, you need a certain amount of energy to perform a certain work. Energy can be added, subtracted, converted from one form to another, but it cannot be created or destroyed according to energy conservation law.
Units to measure energy:
- Joule (J) - International SI system. Convention: 1 J is the amount of energy necessary to move an object over 1 meter against the force of 1 newton.
Joule = Newton x meter = Pascal x meter3 = Watt x second - British Thermal Units (btu) - used in fuel and thermal applications. Convention: 1 btu is the amount of energy necessary to heat 1 pound of water by 1 degree Fahrenheit. 1 btu = 1055 J
- Kilowatt-hours (kWh) - used in electricity. Convention: 1 kWh is the amount of energy being transmitted with the power of 1 kW over 1 hour
1 kWh = 3600 kJ
Power is the amount of work performed per unit of time. Power can be understood as the rate of energy conversion.
Units to measure power:
Watt (W) = Joule / second
Often, the energy converting systems are rated by power.
For example:
40 W light bulb - it means it consumes 40 Joules of electric energy per second;
250 W solar panel - it produces 250 joules of electric energy per second (under standard conditions), which converts to 6 kWh per day;
20 MW wind farm - it generates 20 MJ of electric energy per second or 20 MWh per hour (at maximum operation load).
Role of energy technologies in sustainability
Since energy is the main commodity ensuring well-being and sustainability of human society, the role of energy technologies is critical. The efficiency with which we can convert and distribute energy essentially determines our standard of living. Speaking the systems language, sustainability would require maintaining the stock of usable energy at the demand level. Consider the system diagram in Figure 8.2.
The main goal of the sustainability system shown above is to keep up the usable energy stock, as it is closely connected to the amount of demanded services and products for society. These two stocks are related through the energy utilization rate.
To make sure the society demand is met, the energy supply rate (left-hand valve) should match the energy utilization rate (right-hand valve). It is this supply valve where energy conversion technologies play the major role. The energy is supplied from a source (which we can assume to be unlimited, e.g., sun energy); however, the conversion rate of the available energy from the source to the usable energy will be the main limiting factor. Conversion rate will depend on technology efficiency, system size, and will be affected by environmental conditions at a particular locale.
So, what can be done to maximize the energy conversion rate at the supply valve?
- Maximize efficiency. This depends on the stage of the technology development, physics of the process, materials, design, and other things that may be improved through research and development efforts.
- Scale-up the conversion system. Feasibility of this measure may be limited by technology cost and available space or land area (to accommodate the equipment, etc.)
- Tune technology to local source and conditions. Local conditions will dictate the adequate choice of technology to employ (obviously, solar energy is great where there is a lot of sun, and wind energy option would be suitable to the places that are windy). Also, system design should be adapted to the geometry and timing of the natural resource – such supplemental technologies as tracking and energy storage help increase the overall conversion.
All the above factors shown on the diagram will affect the energy conversion rate.
While we can identify the factors that maximize the conversion and enhance the system’s function, the system may be not resilient until there is a return balancing loop. One of such loops (shown by dashed line on the system diagram in Figure 8.2) shows the investment of the energy generation revenue into creation of new energy conversion systems. This feedback has been more strongly established over the past decade, but it can be also driven to one side or the other by government incentives and social factors. Furthermore, wider implementation of the renewable energy conversion systems will result in an increase of renewable energy supply and higher energy stock for consumers.
Establishment of this system will eventually ensure renewable energy economy; however, this process is still hampered by strong economic competition from the non-renewable energy worldwide, which is currently in a dominating position by scale, profit, and infrastructure development in a number of major players - e.g. China, United States, Russia.
This is only one slice of the quite complex “tug-of-war” issue of commercialization of the renewable energy. It is anticipated that recent advances in research and development will be able to increase the energy conversion efficiency and thereby further upgrade its market value. The technical status of several prospective energy technologies is reviewed in the following sections.
8.2. Building Integrated Solar Energy Technologies
8.2. Building Integrated Solar Energy Technologies
Solar energy conversion is a large topic. The key technologies to mention here include:
- Photovoltaics (PV, optoelectronic systems) - convert solar visible radiation into electricity;
- Concentrating Solar Power (CSP, solar thermal, or optocaloric systems) - convert solar thermal radiation into electricity;
- Solar heating systems - utilize solar heat (concentrated or not) without conversion.
You can learn these technologies in depth, taking some of the courses in the Solar Energy Option of RESS. Here in this lesson, we will turn to one of the application examples of PV technology to study the factors that affect the practical implementation of solar panels in buildings. But before doing that, let us review the basic principles by which photovoltaic systems operate.
PV Basics
Photovoltaic (PV) technology is one of the ways to convert solar resource into usable energy - specifically sunlight to electricity. Photovoltaic conversion is enabled by certain semiconductor materials, which have a property to generate electric current when they absorb incident photons. The physics of the photovoltaic effect can be schematically envisioned as three step process [Brownson, 2014]:
- absorption of light;
- generation of charge carriers (electrons and holes);
- separation of charge carriers (so that they can perform work).
This effect is physically realized in certain semiconductor materials - for example, monocrystalline silicon, polycrystalline silicon, amorphous silicon, cadmium telluride, and copper indium gallium selenide/sulfide and some others, all of which can be potentially used for making the PV cells.
Watch This Video as an introduction to PV cell technology and the photovoltaic effect.
This first short video (2 min) provides an animated illustration of the photovoltaic effect:
Video: Energy 101: Solar PV (2:00)
All right, we all know that the sun's energy creates heat and light. But it can also be converted to make electricity-- and lots of it. One technology is called Solar Photovoltaics, or PV for short. You've probably seen PV panels around for years, but recent advancements have greatly improved their efficiency and electrical output. Enough energy from the sun hits the Earth every hour to power the planet for an entire year. Here's how it works.
You see, sunlight is made up of tiny packets of energy called photons. These photons radiate out from the sun and about 93 million miles later, they collide with a semiconductor on a solar panel here on earth. It all happens at the speed of light. Take a closer look and you can see the panel is made up of several individual cells, each with a positive and a negative layer, which create an electric field. It works something like a battery. So, the photons strike the cell, and their energy frees some electrons in the semiconductor material. The electrons create an electric current, which is harnessed by wires connected to the positive and negative sides of the cell. The electricity created is multiplied by the number of cells in each panel and the number of panels in each solar array.
Combined, a solar array can make a lot of electricity for your home or business. This rooftop solar array powers this home. And the array on top of this warehouse creates enough electricity for about 1,000 homes. OK, there are some obvious advantages to solar PV technology. It produces clean energy. It has no emissions, no moving parts. It doesn't make any noise, and it doesn't need water or fossil fuels to produce power. And it can be located right where the power is needed, in the middle of nowhere. Or it can be tied into the power grid. Solar PV is growing fast, and it can play a big role in America's clean energy economy, anywhere the sun shines.
Next, let us gather some more details on the structure, functions, parameters of the photovoltaic materials.
Reading Assignment:
The PVEducation website [183] is very good articulating many technical aspects of photovoltaic systems. Although we do not intend to study the PV physics here in detail, definitely bookmark this website as a useful resource.
Spend no more than 1 hour browsing through this website and self-learn or refresh the PV technology background.
PV Application in Buildings
Current applications of solar photovoltaics are adapted to the following scales:
- portable (small electronics - e.g., calculators, computers, etc.);
- distributed power generation (homes, isolated equipment);
- utility scale power (solar farms).
In the scale-up process, the single PV cells are combined to modules, and modules can be arranged into arrays:

In this lesson, we choose one of the applications – the building integrated photovoltaics (BIPV) – for more detailed consideration as an interesting example of sustainable technology implementation.
The building-integrated photovoltaics (BIPV) are multifunctional materials that are both structure-supporting and power-generating at the same time. There are some advantages and challenges associated with this technology, which are summarized in table below:
| Advantages | Challenges |
|---|---|
| Lower cost due to multi-functional nature of materials and due to more efficient design. Currently, PV contributes 0.5% to national energy demand; DOE expects it to reach 50% (!) with BIPV implemented. | System orientation, weatherability, durability are the factors that affect the system performance. Those parameters may be not easy to optimize if it is BIPV rather than add-on PV. |
| Improved aesthetics: panels are produced as facade lining, roof tiles, slates, shingles, windows (glazing, etc.). | BIPV modules can be heavier than regular building elements. Because of potential overload, new building standards and codes need to be in places to regulate this integration. |
| Thin-film PV can be applied directly to conventional building materials because the flexible and light. | BIPV modules are costly compared to regular add-on PV due to their multifunctional value, but that is not always recognized. BIPV is not mass-produced, but rather custom made, and that adds to the price. |
| Social acceptance: not many see long-term value because PV technology is thought to be soon outdated. There should be more acceptance from contractors and end-users alike. |

While the main function of a conventional PV system is efficient power generation, the building integrated PV systems, which become the components of the building envelope must satisfy a number of additional requirements, such as:
- appearance: color, image, size;
- weather-tightness;
- wind loading;
- durability and maintenance;
- safety during construction and in use (fire, electrical, structure stability);
- cost.
Reading Assignment:
Report: Building Integrated Photovoltaics: An Emerging Market [192], Greentech Media Inc., 2010.
This review summarizes factors affecting the market of the BIPV technology, related policies, and its promise.
In order to address all the necessary factors, the PV integration should be discussed early in the beginning of the design process. There are following PV integration options [Robert and Guariento, 2009]:
(a) Shading systems
These include louvers, either horizontal or vertical, which may be mounted outside the building over windows or balconies. Their function is to shade the windows from excessive light. The main issue with these structures is to make them resistant to wind load and easily accessible for maintenance. These subscreens can be made adjustable to maximize the sunlight gain.
(b) Rainscreen systems
Cladding panels can be used to protect the load-bearing external walls from rain water (especially masonry and concrete). PV panels can perform the function of such cladding and tiles. These structures are usually vertical. The ventilated cavity between the exterior cladding and the main wall help keep down the operating temperature of PV cells, enhancing their performance and provide space for cables. PV rain screens have moderate power output due to vertical orientation.
(c) Stick-system curtain walls
Curtain walls are used in those buildings that have internal columns or structural steel to support the main loads. Curtain walls are not weight-bearing and their main function is to resist air and moisture infiltration; also, building insulation is often attached to them (warm facade). A popular solution is to build the curtain walls from aluminum and steel framing filled with glass panels. PV panels can be sealed into curtain wall structures in both vision area or opaque area of the facade instead of regular glass.
(d) Unitized curtain walls
The unitized wall segments are pre-assembled at a factory and then are delivered to the building site. The controlled industrial environment provides more precision and quality for sealing the PV panels into the wall framework and making cable connections.
(e) Double-skin facades
Glass facades are often designed as "double-skin", i.e., when there is significant air space between the internal and external glass walls. This helps to reduce heat transfer losses through the walls. PV modules can be readily integrated into the external facade. Ventilation through the double-skin structure provides valuable cooling on the back of the panels.
(f) Atria and canopies
For the highest performance, PV are best integrated into horizontal or tilted elements, such as atria and canopies. These structures are usually free from overshadowing and are easy to ventilate. However, these structures may be more prone to heat transfer losses compared to plain opaque or insulated.
Supplemental Reading on BIPV technology:
Book: Robert, S. and Guariento, N., Building Integrated Photovoltaics. A Handbook [193], Birkhauser Verlag AG, 2009.
This handbook on BIPV technology (available online through PSU library) provides many details that are beyond the capacity of this course. If you have specific interest in this area of technology, you may find this book a useful resource.
NREL Report: Eiffert, P., Kiss, G.J., Building-Integrated Photovoltaic Designs for Commercial and Institutional Structure [194]s [195]" NREL, 2000
This report contains multiple examples of BIPV design, which complement the description of this technology.
Lifecycle Considerations
One of the main reasons why solar PV systems are being developed is their potential to replace fossil fuel combustion in power generation. While economically, fossil fuels are proved to be profitable, there is a sustainability concern (coal, oil, and gas will run out eventually) and there is an environmental concern (combustion pollutes and contributes to the greenhouse effect on earth). The solar PV can potentially address both of these concerns.
Because, unlike fossil fuels, solar energy is virtually unlimited, PV seems to be a perfect solution from the standpoint of energy sustainability. (Sunlight will not run out any time soon).
From the standpoint of environmental protection, the main question is whether or not the environmental benefit of reducing CO2 emissions achieved through the use of the solar systems will offset the impact of possible toxic emissions from the manufacturing of the solar modules and potential land pollution from the disposal of those systems at the end of their lifetime.
Let us make some rough estimations of the environmental benefit of PV technology. Consider the following example.
Example
Question: How much CO2 emissions will be mitigated by employing PV for electric power generation?
The European Photovoltaic Industry Association predicted that by 2030 the implemented PV units will be able to produce 2,646 TWh of electricity annually worldwide. This roughly accounts for 9% of the total population's needs.
Imagine this amount of energy to be produced by burning coal instead:
The general reaction of carbon combustion is: C(coal) + O2 = CO2
We know that the average coal energy content is ~24 MJ/kg.
We also know that the average efficiency of coal-fired power plants is ~33%, so, roughly, we need three times as much energy generated by coal combustion for obtaining the specified amount of electric energy:
Energy by combustion = Target electric energy / 0.33
To unify the units, convert the global PV energy to joules: 2,646 TWh = 9.53 × 10¹⁸ J
So, the energy we would need to generate through coal combustion is:
9.53 × 10¹⁸ J / 0.33 = 2.89 × 10¹⁹ J
Now, we can find how much coal we need to generate this amount of energy by dividing the amount of energy by coal energy content:
Amount of coal needed = 2.89 × 10¹⁹ J / 24 × 106 J = 1.2 × 10¹² kg (=1200 million ton)
Now, based on the assumed 95% content of carbon in the coal (let us consider anthracite coal), we calculate the amount of pure carbon burnt in the process:
1.2 × 1012 × 0.95 = 1.14 × 10¹² kg C
Because for each mole of carbon in the coal, there is 1 mole of CO2 produced, we can find the amount of CO2, taking into account the molar masses of the components – C 12 g/mol and CO2 44 g/mol, as follows:
Amount of CO2 released = 1.14 × 1012 kg × (44/12) = 4.18 × 10¹² kg CO2 (= 4180 Tg CO2)
This quite substantial mass of CO2 will not be released to the atmosphere due to the operation of the PV systems around the world. Let us compare this number to the total global CO2 emissions, currently estimated at 31,350 Tg CO2 [IEA Statistics, 2012]
4,180 / 31,350 × 100% = 13.3%
This is the fraction of CO2 emissions that would be prevented due to employment of PV technology (if it is employed as predicted by the European Photovoltaic Industry Association).
We should also remember that PV is only one of the promising renewable technologies on the list. All of those technologies are locale-sensitive and therefore will complement each other in global power generation. Localization of technologies by resource would also help reduce energy expenditures and emissions from transportation.
The above example demonstrates the scale of the benefit. Now, let us look at the other side of the medal. The accelerated growth of PV system manufacturing and use will have to become a major market and also should have infrastructure for maintenance and disposal of vast amount of PV-related components. While PV panels are considered are relatively durable with a long projected service life, high volume annual turnover of such systems can be expected. Here, we can do another estimation exercise.
Example
Questions:
- How many solar panels would be needed in the fossil fuel free economy?
- How many panels would need to be replaced and disposed off each year?
Precise analysis is hardly possible, since we cannot predict the market trends and know for sure which renewable technologies will be major in the distant future. So, we just create a hypothetical case with a few assumptions:
Assumption 1: There are no more fossil fuels left, so all energy has to come from renewable sources.
Assumption 2: Global energy demand is split evenly among the six major technologies: solar PV, solar thermal, wind, geothermal, hydro-power, and biomass. This is probably unrealistic, but let us take it as a starting point for simplicity. In this case, PV power generation has to cover 1/6 of the total energy demand.
Assumption 3: The total global energy demand is 13 TW of power (this is currently estimated value, which we will use in this example): 13 TW → 4.1 × 10²⁰ J (per year)
Then, the fraction of energy that has to come from PV is:
1/6 × 4.1 × 1020 = 6.833 × 10¹⁹ J (per year)
Let us consider 250 W silicon monocrystalline panels (64 x 39 x 1.57 in size; 44 lb (20 kg) in weight) as the main functional unit for this estimation.
If the panels are installed at a favorable location, we can take the measured output of 1200 kWh per kW of capacity per year. This is a typical output factor for the locations with favorable insolation [Vanek and Albright, 2008]. To explain this a little better: the nominal capacity of the solar system (250 W in this case) indicates the system output at full insolation; but the system does not operate at full insolation all the time (due to varying sun position and seasons). So, instead of the theoretically possible maximum output of 2190 kWh, the system produces only 1200 kWh per year. This value can be empirically estimated and is termed “regional factor”.
Then, we can find how much energy this panel will produce per year:
1200 (kWh/kW) x 0.25 kW = 300 kWh (= 1.08 × 10⁹ J)
Finally, we divide the total energy demand by the unit panel output to find # panels:
Number of panels required = 6.833 × 10¹⁹ J / 1.08 × 10⁹ J = 6.327 × 10¹⁰
63 billion panels (!) is many, but if we divide this number by current living population (~ 7.7 billion), we get 8.2 panels per person, which seems quite reasonable.
To answer the second question, let us make the following assumption:
Assumption 4: The panel lifetime is assumed to be 50 years.
In this case, 1/50 of all panels will need to be replaced each year:
63/50 = 1.26 billion panels
If all this decommissioned equipment is simply disposed off, the total volume of waste generated per year will range up to 8.1 × 10⁷ m3. If this waste in deposited in 20 m high dump, it would cover the area of 4.05 km2. (That means, the dump will cover the area of my home town in 9 years.)
The above-illustrated issue of waste disposal associated with the proliferation of the current PV technology calls for further development of solar cell design. The following improvements will be needed:
- development of thin, low volume solar elements;
- increasing efficiency of energy conversion to minimize the size of systems;
- designing cells for recyclable turn-over and conservation of valuable materials;
- using low-toxicity chemicals and materials in manufacturing;
- creating infrastructure for lifecycle management.
8.3. Solar Thermal Electric Power Generation
8.3. Solar Thermal Electric Power Generation

Solar thermal technologies are designed to convert the incident solar radiation into usable heat. The process of solar heat conversion implies using energy collectors - the specially designed mirrors, lenses, heat exchangers, which would concentrate the radiant energy from the sun and transfer it to a carrier fluid. The fluid passes through the sunlight collector and becomes very hot. Typical heat carrier fluids are water/steam, oil, or molten salt. Then the fluid is transferred to the heat engine, which converts the heat to electricity.
Please watch the following video, which provides an illustration of this technology.
Video: Energy 101: Concentrating Solar Power (2:16)
Ok. Take the natural heat from the sun. Reflect it against a mirror. Focus all of that heat on one area. Send it through a power system. And you've got a renewable way of making electricity. It's called concentrating solar power or CSP. Now, there are many types of CSP technologies: towers, dishes, linear mirrors, and troughs. Ok, have a look at this parabolic trough system. Parabolic troughs are large mirrors shaped like a giant U. These troughs are connected together in long lines and will track the sun throughout the day. When the sun's heat is reflected off the mirror, the curved shape sends most of that reflected heat onto a receiver. The receiver tube is filled with the fluid, and it could be oil, molten salt, something that holds the heat well. Basically, this super hot liquid heats water in this thing called a heat exchanger. And the water turns to steam. Now, the steam is sent off to a turbine and, from there, it's business as usual inside a power plant. A steam turbine spins a generator and the generator makes electricity. Once the fluid transfers its heat, it's recycled and used over and over. And the steam is also cooled, condensed, and recycled again and again. One big advantage of these trough systems is that the heated fluid can be stored and used later to keep making electricity when the sun isn't shining. Sunny skies and hot temperatures make the southwest, U.S. an ideal place for these kinds of power plants. Many concentrated solar power plants could be built within the next several years. And a single plant can generate 250 megawatts or more, which is enough to power about 90,000 homes. That's a lot of electricity to meet America's power needs.
There are several different kinds of solar collectors, which are described below. These collectors are only functional with the direct beam of sunlight and would also benefit from sun tracking - the technology that keeps the reflectors at an optimal angle to the sun.
Flat plate collectors
Flat plate collector is the simplest technology of this kind, which is typically used for reaching temperatures usually no more than 100 degrees above ambient.
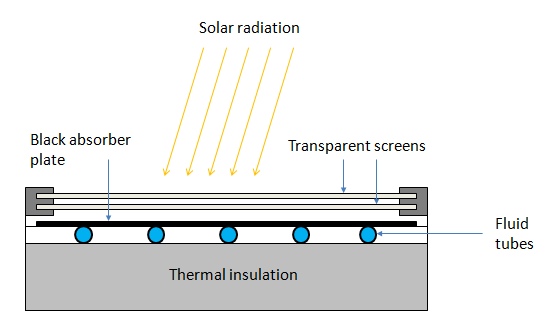
Concentrating collectors
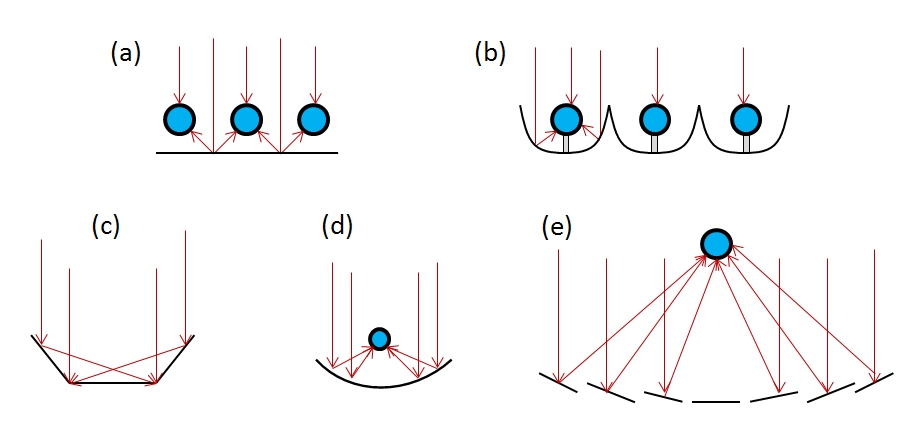
The above collectors are combined to a bigger energy conversion system. The larger scale solar thermal systems have higher efficiency than small systems.
The utility scale solar thermal systems include the following designs:
- linear reflectors (heating temperatures ~280 oC);
- parabolic trough (heating temperatures ~400 oC);
- dish / engine systems (heating temperatures ~650 oC);
- solar tower (heating temperatures ~>1000 oC).
Please refer to the following reading to learn more details about the solar thermal technologies.
Reading Assignment:
Solar Thermal Power Plants. Technology Fundamentals [184], Renewable Energy World, 06/2003, pp. 109-113.
This article explains the fundamentals of CSP well, but it already became obsolete in terms of technology commercialization. For example, it mentions that there are no commercial solar tower plants, but actually there are now. Here, I include the list of operating Solar Thermal Power Stations available on Wikipedia page [198], which indicates the capacity of the plants, their location, and technology used.
8.4. Utility Scale Geothermal Energy Systems
8.4. Utility Scale Geothermal Energy Systems

There is a vast amount of heat contained by the earth interior. This internal heat is mainly comprised of the residual heat of planetary accretion and radioactive heat (from radioactive element decay). The hottest part of the earth is the core, a big part of which is in molten state. Heat radiates and gets transferred from the core to the outer layers of the planet by interior fluids and melts. The general geothermal profile of the earth (Figure 8.6) provides an idea of the scale of the thermal resource and the gradual change of the earth temperature at different depths. Because the earth structure is not uniform, heat is more readily transferred in some zones than in others. High heat transfer is usually associated with fracture zones and major faults, which are often located at the boundaries of tectonic plates.
The temperature change rate with depth depends on the density and thermal conductivity of rocks. Subdivision of the earth structure into layers is made according to the rock composition and rheological properties, so we see that the thermal profile within each layer can be quite different. The drastic change in temperature pattern around the boundary between the lower mantle and outer core is apparently related to the transition of the molten state.
The heat flux within the crust (the thin top layer) is highly variable due to the existence of large unified fragments of the crust (plates) divided by plate boundaries, the more mobile zones, where plates collide, spread out, or move relative to one another. Increased mobility of the plate boundary zones may cause creation of faults of various depth, which favor heat transfer to the surface. If you want more background about plate tectonic theory, you will be able to find a lot of resource on the web. For example, An Introduction to Plate Tectonics [200] provides a nice and concise illustrated introduction to this whole idea.
There are a number of technologies that help convert the thermal flux and hydrothermal waters to usable energy. Next, we will refer to the following reading to learn how these technologies work.
Reading Assignment:
“How Geothermal Energy Works [185]”, UCS, 4/1/2014
The following short video (5 min) provides an additional illustration of a utility scale geothermal plant.
Video: How a Geothermal Plant Works (4:45)
Welcome to one of CalEnergy's geothermal power plants. Unlike other power plants that rely on coal or other fossil fuels to create electricity for homes and businesses, geothermal power plants use superheated fluids from the Earth's geothermal resources to generate electricity. The natural heat of the Earth creates geothermal resources. This heat comes from molten rock called magma, located at the Earth's core deep below the geothermal resource. Over thousands of years, rainwater seeps through cracks in the Earth's surface and collects in underground reservoirs. The magma heats the water until it becomes a superheated fluid. To reach the superheated fluid, wells are drilled 5,000 to 10,000 feet below the surface of the Earth. These wells, called production wells, bring the superheated fluid to the Earth's surface where it can be used to generate electricity for homes and businesses.
This geothermal power plant uses crystallizer-reactor clarifier technology-- a process that turns the geothermal superheated fluid into steam, while removing solids from it. The steam is used to drive a turbine and generate electricity. All remaining geothermal fluids are injected back into the reservoir for reuse. Under its own pressure, superheated fluid from the geothermal resource flows naturally to the surface through production wells. As the liquid flows toward the surface, the pressure decreases, causing a small portion of the fluid still within the well to separate, or flash into steam. At the surface, the superheated fluid and steam mixture flows through surface pipelines and into a wellhead separator. Inside the separator, the pressure of the superheated fluid is reduced. This causes a large amount of the superheated fluid to rapidly vaporize and flash into high-pressure steam. The geothermal fluid that is not flashed into steam in the wellhead separator flows to a second vessel, called a standard-pressure crystallizer, where an additional amount of standard pressure steam is produced. The flash process continues in the low-pressure crystallizer. The remaining fluid is again flashed, this time at a lower pressure, to produce low-pressure steam. All of the low-pressure, standard-pressure, and high-pressure steam is delivered to a turbine. The fluid that is not flashed into steam flows into the reactor clarifier system and is then returned to the geothermal reservoir through injection wells. Turbines are the primary piece of equipment used to transform geothermal energy into mechanical energy. Pressurized steam created from the geothermal superheated fluid flows through pipelines to large steam turbines. The force and energy in the steam is used to spin the turbine blades. The turbines turn a shaft directly connected to an electrical generator. An electrical charge is created when magnets rotate within the generator. Large copper bars carry the electrical charge to a step-up transformer outside the plant. Within the transformer, the voltage is increased before the power is sent to the power lines that carry it to homes and businesses.
Geothermal energy is a sustainable resource because with proper management, a geothermal resource can remain a renewable source of energy. Water trapped deep within the Earth will naturally replace the superheated fluid that is drawn from the geothermal resource through surface wells. However, it is possible to deplete the geothermal resource by removing fluid faster than it can be naturally replaced. To help prevent this, the steam used in the geothermal power plant passes through a condenser that turns it back into fluid. At this stage, it's possible to recover minerals from the geothermal fluid before it's injected back into the Earth. This condensed fluid, along with a fluid that did not flash to steam, is injected back into the underground reservoir. Magma naturally reheats the fluid, so it can be used again.
While geothermal energy seems to be another unlimited and “free” energy resource, effective conversion of that energy and power distribution incur substantial costs. From economic evaluations, utility scale geothermal and natural gas power plants are comparable in overall cost, but only in the long term. Significant up-front expenditures for construction of the energy facility are much higher for the geothermal plant.
8.5. Wind Energy Applications and Technologies
8.5. Wind Energy Applications and Technologies
Wind energy is primarily used for power generation. Wind power conversion systems have been increasingly employed in the U.S., Europe, India, and more sparingly in some other locations over the last decade, due to the development of technology that allows relatively high efficiency of the wind resource conversion. The key process is the conversion of the kinetic energy of moving air into the mechanical kinetic energy of the rotating shaft of the turbine. Similar to solar energy resource, one of the main challenges with wind power is its intermittence and high variability, which requires systematic adjustments in operation as well as strategies to integrate the wind power into the grid.
Video: Energy 101: Wind Turbines (2:16)
We've all seen those creaky old windmills on farms and, although they may seem about as low tech as you can get, those old windmills are the predecessors for new modern wind turbines that generate electricity. The same wind that used to pump water for cattle is now turning giant wind turbines to power cities and homes. Have a look at this wind farm in the California desert. A hot desert next to tall mountains. An ideal place for a lot of wind. Here's another one on the windy prairies of Wyoming. Now, today's wind turbines are much more complicated machines than the old prairie windmills, but the principle is the same. Both capture the wind's energy. Ok.
Here's how it works. First, a wind turbine blade works sort of like an airplane wing. Blowing air passes around both sides of the blade. The shape of the blade causes the air pressure to be uneven, higher on one side of the blade and lower on the other. And that's what makes it spin. The uneven pressure causes the blades to spin around the center of the turbine. On the top, there's a weather vane that's connected to a computer to keep the turbine turned into the wind, so it captures the most energy. Now, the blades are attached to a shaft which only turns about 18 revolutions a minute. And that's not nearly fast enough to generate electricity by itself. So, the rotor shaft spins a series of gears that increase the rotation up to about 1,800 revolutions per minute. And at that speed, a generator can produce a lot of electricity.
So, why are wind turbines so tall? Well, the higher up you go, the windier it is. More wind naturally means more electricity. And in many cases, larger turbines can also capture wind energy more efficiently. The blades can sweep a circle in the sky as long as a football field. Now, what's really cool is that even a small wind farm, like this one in Wyoming, can generate enough electricity to power more than 9,000 homes. And larger farms can provide much more clean energy for our homes and businesses.
Please refer to the following reading source for learning about wind energy systems below.
Reading Assignment:
Book chapter: F.M. Vanek and L.D. Albright, Energy Systems Engineering: Evaluation and Implementation, McGraw Hill, 2008 – Chapter 12 Wind Energy Systems, pp. 331-366. (See E-Reserves in Canvas.)
This chapter contains sufficient background on the topic, including global perspective of the technology, some technical details and performance parameters, and economic insight. Here, our goal is to understand the main characteristics of the system (both technical and economic) that can be useful for technology evaluation.
Focus Questions
Read pages 331-348 more carefully; you can just scan through the rest of the chapter. (We will not dig into the turbine design since it is beyond the scope of this course). While reading, try to spot the answers to the following questions:
- How is wind resource measured?
- How can we estimate the average wind speed at a particular locale?
- How do we estimate the available power of wind?
- What are the most favorable and least favorable wind conditions for high efficiency wind power conversion?
- Can you explain the meaning of capacity factor of a wind turbine?
Energy return on investment (EROI)
EROI is a common metric applied to the energy conversion systems. It is defined as the ratio of the lifetime usable energy generated by the system to the energy spent for the system manufacturing, operation, maintenance, and disposal. Obviously, EROI = 1 would mean that over its lifetime a system produces as much energy as has been consumed for its creation and operation. Such a situation would indicate very low feasibility.
For wind turbines, the typical estimate of the EROI is in the range from 5 to 35, depending on the type of system. This indicator significantly increases with the size of the turbine rotor. The latest generation large-scale turbines yield EROI values about 35 and higher (Kubiszewski et al., 2010).
Status of technology
The wind power generation systems have been commercialized for several decades now. The efficiency and durability of the systems was improved over time. So, recent developments explain the growing interest in wind energy and observed growth of wind energy market. Read more on the status of this technology in the NREL report:
Reading Assignment:
NREL Report: R. Thresher, M. Robinson, P. Veers, Wind Energy Technology: Current Status and R&D Future [186], NREL, 2008.
Economic aspects
Economic analysis of renewable energy systems mainly focuses on the ability of the system to pay back the initial investment and operation costs within a reasonable period of time.
The lifetime cost of the wind energy system can be split into the (i) initial cost for system manufacturing and installation, (ii) operating and maintenance cost, and (iii) decommission cost.
The initial upfront cost of wind energy system is usually the highest (~75%) and typically includes turbine (including rotor, tower, drivetrain), foundation, land rent, electrical equipment, connection to the grid, road construction and other infrastructure, transportation, installation labor and expertise, and associated soft costs (Figure 8.5).
Operating and maintenance costs are relatively low, especially that there is no fuel cost involved.
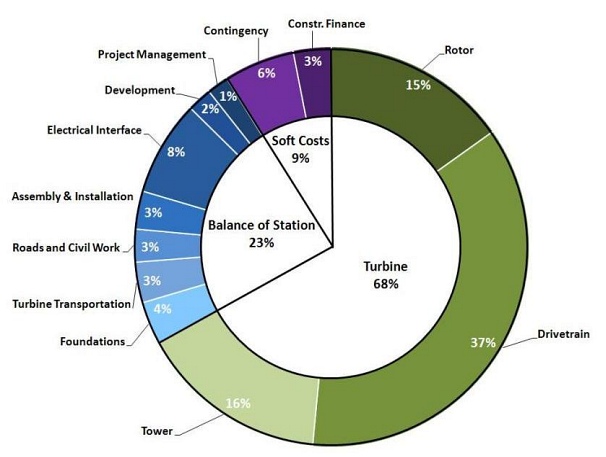
| per kW capacity | total for 1.5 MW turbine system | |
|---|---|---|
| Capital cost | $2,098 | $3,147,000 |
| Annual operating cost | $35 | $52,500 |
| Lifetime cost (25 years) | $2,973 | $4,459,500 |
Taking into account the typical costs listed in Table 8.2, one can perform a standard cost analysis to find out how long would it take for the wind system to pay back investments. Feasibility would depend on the lifetime of the system itself and how it compares to the payback period. Please refer to the example below, which tries to examine this question
Example:
Consider a simple payback estimate example here:
Question: What would be a simple payback time for a 1.5 MW wind turbine that produces annually 4,800 MWh of electricity (net generation)? Use the capital cost and annual operating cost from Table 8.2.
First, we can express the lifetime cost of the 1.5 MW system as:
Total cost = $3,147,000 + n x 52,500
where n is the number of years. Note, we are ignoring the salvage value or decommission cost in this example.
We assume that the facility is able to sell the electricity at a realistic average price of $0.05/kWh. (In reality, the market price for wind-generated power can vary). So, the total revenue generated through electricity sales will be:
Total revenue = 4,800 MWh/year x n years x 0.05 $/kWh = 240,000n
Then, simple payback time can be found by solving for n the balance equation between the total cost and total revenue:
3,147,000 + 52,500n = 240,000n
n = 16.78 years - will be necessary to cover the investment. This time is roughly 1/2 the lifetime of the turbine system.
The payback can be reached sooner if we consider a premium some customers would pay for purchasing "green" electricity. At the same time, if there is an interest rate on the initial investment (MARR), it will extend the payback period.
As a rule, the small-scale residential wind energy system have longer payback period, because they typically operate at less favorable wind conditions; so the capacity factors are usually lower (~10%) than that for the commercial utility scale wind systems (~30%)
More information on wind energy economics and costs can be found in the following reading (which is optional for this lesson):
Supplemental Reading on Wind Energy Economics and Costs:
- S. Tegen, E. Lantz, M. Hand, B. Maples, A. Smith, and P. Schwabe, 2011 Cost of Wind Energy Review [204], NREL (2011).
8.6. Bio-mass Fueled Combined Heat and Power Systems
8.6. Bio-mass Fueled Combined Heat and Power Systems

Biomass as a source of fuel has been part of the global energy economy throughout human history. Using biomass as fuel (via combustion) may help solve the fuel supply issue, since biomass is renewable, but does not help solve the global carbon emission and pollution problem: burning biomass produces CO, CO2, NOx, and other gases at the levels exceeding those from traditional fossil fuels (e.g., oil, gas).
Indirect utilization of biomass implies the production of various biofuels (for example, ethanol), which can be converted to energy in a cleaner way. Types of biomass currently on market and ways to produce them are well described in the Biomass Wikipedia [209] article
Biomass combined heat and power (CHP)
Biomass-fueled CHP or cogeneration is one of the applied technologies developed as a cost-effective method of energy recovery. Because the by-product heat generated in electricity generation is not wasted, but rather utilized as thermal energy, the total efficiency of such systems reaches 60-80%.
There are three main stages in the biomass-fueled CHP process:
- biomass collection and preparation
- biomass conversion: (i) to steam or (ii) to biogas
- power and heat generation
These three stages are integrated in one installation.
The following bio resources are considered for energy recovery:
- energy crops and crop residues
- forest residues and wood waste
- manure biogas and wastewater treatment biogas
- food processing residue
- municipal solid waste (MSW)
- landfill gas
Wood products currently make up the dominating stock in U.S. (Figure 8.8).
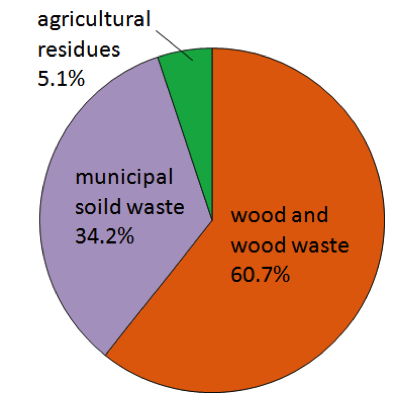
These different biomass resources require somewhat different approaches to the collection, storage, and conversion. In brief, there are two main categories of biomass conversion systems, as outlined in the table below:
| Direct-Fired Systems | Gasification Systems | |
|---|---|---|
| Process and Output | burning biomass in a boiler to produce high pressure steam | decomposing biomass to produce gaseous fuel - syngas |
| Feed | bark, chips, sawdust, end cuts - wide variety of fuels | shipped wood, rice hulls, shells, sewage sludge, wood residues |
| Output | high pressure steam | syngas fuel |
| Capacity | up to 300 MW | up to 50 MW |
| Notes | Direct-fired systems perform combustion of the solid biomass and produce hot flue gases that heat the boiler. This technology is dated back to 19th century. There are many different kinds of boilers, based on configuration, size, quality of steam. The two most common types of boilers are stockers and fluidized bed boilers. Boiler size is often measured in terms of fuel input in MMBtu per hours. Biomass fuels can be combusted separately in boilers or co-fired with coal and other conventional fuels. [US EPA, 2007] | "Biomass gasification involves heating solid biomass in an oxygen-starved environment to produce low or medium calorific gas. Depending on the carbon and hydrogen content of the biomass and the gasifier’s properties, the heating value of the syngas, can range from 100 to 500 Btu/cubic foot (10 to 50 percent that of natural gas)." The main combustible components of syngas are CO and hydrogen, and the main incombustible component is CO2. Biomass gasification offers certain advantages over directly burning the biomass because the gas can be cleaned and filtered to remove problem chemical compounds before it is burned. Gasification can also be accomplished using chemicals or biologic action (e.g., anaerobic digestion); however, thermal gasification is currently the only commercial or near commercial option." [US EPA, 2007 ] |
Chapter 5 of the EPA report on CHP biomass technology provides a good amount of technical details as for how these conversion methods work.
Reading assignment:
EPA Report: Biomass Combined Heat and Power Catalog of Technologies [187], U. S. Environmental Protection Agency, Combined Heat and Power Partnership, September 2007. Chapter 5: Biomass Conversion Technologies, pp. 30-61.
While reading, try to find answers to the following questions:
- What are basic technical principles of the direct-fired and gasification biomass conversion systems?
- How do these systems compare in size and efficiency?
- What is fluidized bed technology? How is it different from the fixed bed system and what advantages does it offer?
- What biomass conversion systems are most cost-effective?
Commercialization status
Biomass is used in the original solid form or can be gasified or converted to liquid fuels. There are a number of commercialized and emerging technologies to foster that conversion (Tables 8.4 and 8.5).
| Energy Conversion Technology | Conversion Technology Commercialization Status | Integrated CHP Technology (Prime Mover) | Prime Mover Commercialization Status |
|---|---|---|---|
| Anaerobic Digestion | |||
| Anaerobic digester (from animal feeding operations or wastewater treatment facilities) | Commercial technology | Internal combustion engine | Commercial technology |
| Microturbine | Commercial technology | ||
| Gas turbine | Commercial technology | ||
| Fuel cell | Commercial introduction | ||
| Stirling engine | Emerging | ||
| Direct Combustion - Boilers | |||
| Fixed bed boilers (stoker) | Commercial technology - Stoker boilers have long been a standard technology for biomass as well as coal, and are offered by a number of manufacturers. | Steam turbine | Commercial technology |
| Fluidized bed boilers | Commercial technology - Until recently fluidized bed boiler use has been more widespread in Europe than the United States. Fluidized bed boilers are a newer technology, but are commercially available through a number of manufacturers, many of whom are European-based. | ||
| Cofiring | Commercial technology - Cofiring biomass with coal has been successful in a wide range of boiler types including cyclone, stoker, pulverized coal, and bubbling and circulating fluidized bed boilers. | ||
| Modular (small, packaged, pre-engineered systems [<5 MW]) direct combustion technology | Commercial technology - small boiler systems commercially available for space heating. A small number of demonstration projects in CHP configuration. | Small steam turbine | Commercial technology |
| Organic Rankine cycle | Emerging technology - Some "commercial" products available | ||
| "Entropic" cycle | Research and development (R&D) status | ||
| Hot air turbine | R&D status | ||
Credit: USA EPA, 2007
| Energy Conversion Technology | conversion Technology Commercialization Status | Integrated CHP Technology (Prime Mover) | Prime Mover Commercialization Status | ||
|---|---|---|---|---|---|
| Gasification | |||||
| Fixed bed gasifiers |
Emerging technology - The actual number of biomass gasification systems in operation worldwide is unknown, but is estimated to be below 25. A review of gasifier manufacturers in Europe, USA and Canada identified 50 manufacturers offering commercial gasification plants from which 75 percent of the designs were fixed bed; 20 percent of the designs were fluidized bed systems. |
Gas turbine - simple cycle |
Prime movers have been commercially proven with natural gas and some medium heating value biogas. Operation on low heating value biogas and the effects of impurities on prime mover reliability and longevity need to be demonstrated. |
||
| Fluidized bed gasifiers | Gas turbines - combined cycle | ||||
| Large internal combustion (IC engines | |||||
| Modular (small, packaged, pre-engineered systems [<5MW]) hybrid gasification technology | Emerging technology - A small number of demonstration projects supported with research, design, and development funding. | IC engine | Commercial technology - But operation on very low heating value biogas needs to be demonstrated. | ||
| Microturbine | |||||
| Fuel cell | Commercial introduction | ||||
| Stirling engine | Emerging technology | ||||
| Modular (small, packaged, pre-engineered systems [<5MW]) hybrid gasification/combustion | Emerging technology - Limited commercial demonstration. | Small steam turbine | Commercial technology - But integrated system emerging. | ||
Credit: USA EPA, 2007
Social considerations
While the biomass energy offers benefits in terms of sustainable fuel supply, it can potentially aggravate the air pollution problem. Except for a very narrow range of applications of biofuels in no-combustion devices, such as fuel cells (which can generate electricity electrochemically with bio-hydrogen and syngas), most of the biomass energy technologies involve burning the fuel and result in greenhouse gas emissions. This drives public opinion away from biomass options towards such alternatives as solar and wind energy. The second issue debated is the potential competition for land use between the energy and food crops.
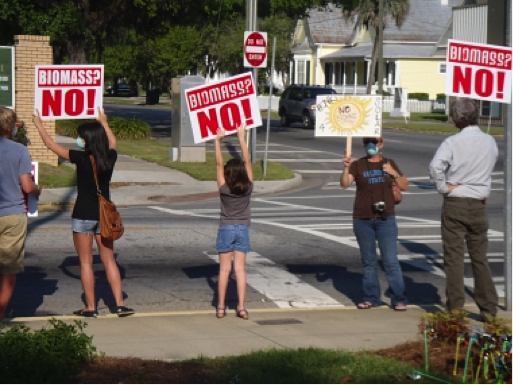
More information on the environmental issues associated with renewable energy technologies is included in the next page of the lesson.
8.7. Environmental Impact of Renewable Energy
8.7. Environmental Impact of Renewable Energy
Sustainability assessment of renewable energy technologies should certainly include analysis of environmental impact. By substituting notoriously harmful fossil fuel combustion, the renewable energy options help to mitigate such problems as air and water pollution, excessive water and land use, wildlife and habitat loss, damage to public health, and global warming.
At the same time, we must understand the non-zero impact of those alternatives when assessing their use at a particular locale. The intensity of environmental impact would vary depending on geographic location, climate, and other factors. For example, biomass energy generation may produce stronger environmental and economic impact in the areas where the land resources are limited, and energy crops would compete with food production. Also, technologies that are associated with significant water withdrawal for cooling and other operational needs can potentially strain the region where water shortages are an issue. So, careful decisions need to be made about deployment of particular technologies so that the most abundant local resources can be used most effectively, and overall impacts are minimized.
Reading Assignment:
Click on links below to read about the specific benefits of renewable energy technologies:
Source: Environmental Impacts of Renewable Energy Technologies, Union of Concerned Scientists, 4/26/2014
Solar [212] | Wind [213] | Geothermal [214] | Biomass [215] | Hydropower [216] | Tidal power [217]
Evidently, some of the renewable energy technologies, such as wind or solar, do not emit any greenhouse gases during operation. However, manufacturing, transportation, installation, maintenance, and decommission phases of the system lifecycle would involve some energy use, part of which may come from fossil fuel combustion. A number of lifecycle studies were performed to estimate the overall impact of the renewables.
Reading Assignment
NREL Release: Life Cycle Greenhouse Gas Emissions from Electricity Generation: Update [218], 2021
Such information can be used as a criterion for the sustainability analysis of those technologies. The activity assigned in this lesson asks for an online investigation of energy options with respect to a number of environmental and other metrics.
Summary & Activities
Summary & Activities
This lesson browsed through a number of renewable energy technologies and applications and provided you with some reading sources to understand how those technologies work and what is their current status of development. While we touched on the technical specs of different energy systems, mastering all the science that is behind those technologies would probably require you to take a separate course on each of those. Our goal here is to understand the role of these technologies in sustainable energy development and their potential pros and cons as decision-making factors. This lesson also contained some examples of metric calculations in order to illustrate the scale of technology impact.
| Type | Assignment Directions | Submit To |
|---|---|---|
| Reading | Complete all necessary reading assigned in this lesson. | |
| Discussion | This is a very obnoxious PR video on one of the emerging solar technologies. Your task will be to watch it with a critical eye and form an unbiased opinion on this technology. In your forum post, discuss the promise of this technology and also indicate what you do not "buy" in this video. Feel free to search additional information to support your argument. VIDEO [219] If you want to be truly unbiased, post your opinion first, then read others. Do not forget to comment on your classmates' posts. Deadline: for initial posting - this Sunday / for replies - Wednesday. |
Canvas: Lesson 8 Discussion |
| Activity |
Comparative Assessment
Please see more details in the Lesson 8 Activity Sheet posted on Canvas. |
Canvas: Lesson 8 Activity |
References for Lesson 8:
Alfe, D.; M. J. Gillan; G. D. Price, Thermodynamics from first principles: temperature and composition of the Earth's core" Mineralogical Magazine 67 (1), 113–123 (2003).
Brownson, J.R.S., Solar Energy Conversion Systems, Heliotactit Press, 2014.
Eiffert, P., Kiss, G.J., Building-Integrated Photovoltaic Designs for Commercial and Institutional Structures [194], NREL, 2000.
IEA Statistics, CO2 Emissions from Fuel Combustion, International Energy Agency, 2015.
Robert, S. and Guariento, N., Building Integrated Photovoltaics. A Handbook [220], Birkhauser Verlag AG, 2009.
Tegen, S., Lantz, E., Hand, M., Maples, B., Smith, A., and Schwave, P., 2011 Cost of Wind Energy Review [204], NREL (2011)
US EPA, Biomass Combined Heat and Power Catalog of Technologies, U. S. Environmental Protection Agency, Combined Heat and Power Partnership, 2007.
Vanek, F.M. and L.D. Albright, Energy Systems Engineering. Evaluation and Implementation, McGraw Hill, 2008.
Kubiszewski, I., Cleveland, C.J., and Endres, P.K., Meta-Analysis of Net Energy Return for Wind Power Systems".Renewable Energy. 35 (1): 218–225 (2010).
Lesson 9: Energy Management and Power Systems
9.0 Overview
Overview
Electricity is a heavily relied upon commodity, availability of which is critical in every part of modern world operation. In any sustainability model, power systems and management are of primary importance, and the current trends in energy management are highly technological. Innovations and introduction of smart metering and response demand technologies should make it possible to match the versatility of the energy conversion systems with the growing and "spiky" electricity demand. The evident goals of new technological developments are to survive, avoid crisis, and finally build an energy distribution system that is flexible and highly efficient in all circumstances. This lesson touches upon different sides of this complex task.
Learning Objectives
By the end of this lesson, you should be able to:
- describe how the power grid works and what the current challenges are;
- explain the "Smart Grid" strategy and list the key technologies involved in it;
- discuss the role of distributed power generation systems in energy sustainability;
- articulate the benefits of specific demand-response technologies.
Readings
You will be asked to read the following items throughout your lesson. Look for these readings in the required reading boxes throughout the lesson pages.
- Web article: Solar Power and Electric Grid [221] /NREL. Energy Analysis
- Web article: Can Renewables Provide Baseload Power? [222] / Skeptical Science. 2011
- Web article: Sunday Train: The Myth of Baseload Power [223] / Daily Kos, 2013
- Journal article: Taqqali, W.M. and Abdulaziz, N., Smart Grid and Demand Response Technology, 2010 IEEE International Energy Conference, p. 710-715.
- Journal article: Bushby, S.T. and Holmberg, D.G., Advancing Automated Demand Response Technology, ASHRAE Transactions, 2009, Volume 115, Issue 1, pp. 333-337.
- US DOE Report: The potential benefits of distributed generation and rate-related issues that may impede their expansion [224], US Department of Energy 2007
Questions?
If you have any questions while working through this Lesson, please post them to our Message Board forum in Canvas. You can use that space any time to chat about course topics or to ask questions. While you are there, please feel free to post your own responses if you are able to help out a classmate.
9.1. Base Load Energy Sustainability
9.1. Base Load Energy Sustainability
Base load power sources are the plants that operate continuously to meet the minimum level of power demand 24/7. Base load plants are usually large-scale and are key components of an efficient electric grid. Base load plants produce power at a constant rate and are not designed to respond to peak demands or emergencies. The base load power generation can rely on both renewable or non-renewable resources.
Non-renewable resources (fossil fuels) include: coal, nuclear fuels. Renewable resources include: hydropower, geothermal heat, biomass, biogas, and also a solar thermal resource with associated energy storage.
Typically, the power demand varies cyclically from day to day, reaching maximum during day business hours and dropping to minimum during late night and early morning, but never dropping below a certain base. (Figure 9.1) This base load is typically at 30-40% of the maximum load, so the amount of load assigned to base load plants is tuned to that level. The above-base power demand (above the base) is handled by intermediate and peak power plants, which are also included to the grid. The main advantages of the base load power plants are cost efficiency and reliability at the optimal power levels. The main disadvantages are slow response time, lack of fuel flexibility, and low efficiency when operated below full capacity.
Base load plants (as well as other energy converting facilities) are characterized by a nominal capacity rating. For example, if a plant rated at 1000 MW, it means it can generate 1000 MWh of electricity per hour when working at full capacity. The actual generation can be less, depending on the demand or operating conditions, and can be characterized by the capacity factor (CF):
CF = [actual generated output] / [maximum possible output]
For example, let us calculate the capacity factor for a 1000 MW base load power plant that generated 512,000 MWh of electricity over the month of January.
In this case, the maximum energy that can be generated by the plant at full capacity over this month can be determined as follows:
E(max) = 1000 MW x 31 days x 24 hour/day = 744,000 MWh
Then
CF = E(real) / E(max) = 512,000 / 744,000 = 0.69 (69%)
There are the number of reasons why a plant can have lower than 100% capacity factor. Some of them are:
- lower demand for electricity over certain periods of time;
- under-capacity operation due to maintenance;
- equipment failures / interruptions;
- resource/fuel shortage;
- equipment upgrade (resulting in high nominal capacity).
The base load power plants typically are coal-fueled or nuclear plants due to low-cost fuel and steady state power they can produce. Hydropower and geothermal power can also be used for base load electricity generation if those resources are regionally available.
The renewable energy systems, such as solar and wind, are most suitable for intermediate load plants. These are intermittent energy sources, with their output and capacity factor depending on weather conditions, daily, and seasonal variations. So, unless there is an effective energy storage system in place, they cannot be relied upon to meet constant electricity supply needs, nor can they be immediately employed to respond to peak demands. However, as intermediate sources, solar and wind systems can be efficient and can help reduce dependence on fossil fuels.
The peak power generation is usually attributed to the systems that can be easily stopped and started. Possibilities are natural gas and oil plants, hydro-facilities.
From the situation as it is right now, we can see that the niche of base load power is currently occupied by mainly non-renewable energy systems and therefore non-sustainable. But here is a probing question:
Can the base load power be entirely provided by renewable energy sources? Or we cannot avoid coal altogether?
Apparently, the difficulty with renewables is their intermittence in time and location bias. Comparison of typical capacity factors of various energy systems reflects this difficulty (see Table 9.1 below)
| Energy Conversion System | Capacity Factor % |
|---|---|
| Nuclear power | 90.3 |
| Coal | 63.8 |
| Natural gas | 42.5 |
| Hydroelectric | 39.8 |
| Concentrating solar | 33 (CA) |
| Wind | 20-40 |
| Photovoltaic solar | 15-19 |
In the table above, the lower the capacity factor, the more susceptible the system to potential interruptions or drops in performance. We can see that solar and wind technologies, which are notoriously weather-dependent have the lowest CF numbers. At the same time, nuclear power and coal systems are most advantageous when operated continuously and at full load.
To explore this question further, refer to the following readings:
Reading Assignment:
- Web article: Solar Power and Electric Grid [221] /NREL. Energy Analysis
- Web article: Can Renewables Provide Baseload Power? [222] / Skeptical Science, 2011
- Web article: Sunday Train: The Myth of Baseload Power [223] / Daily Kos, 2013
Using the above-listed resources and other materials you may find on this topic, try to formulate answers to the following questions:
- Is it a realistic idea to use a mixture of renewable energy technologies to provide baseload power to the grid 24/7?
- What new technologies or engineering solutions would be required to pursue this idea?
At this point, we can see at least two major issues that make contemporary grid management more complicated: first is the efficient management of the baseload-peak variations and second is the incorporation of renewable energy systems. An array of new technologies and strategies that enable an information-based sensitive approach to electricity mass-market is summarized by the term smart grid, which is introduced in more detail in the next section.
Supplemental Reading on the Base Load Power:
Are Solar and Wind Really Killing Coal, Nuclear, and Grid Reliability? [225] - The Conversation
Why Base Load Power is Doomed [226] - Smart Planet
9.2. Smart Grid and Demand Response Technologies
9.2. Smart Grid and Demand Response Technologies
National electric power infrastructure, also called “the grid”, has been developing over more than a century and plays an important role in the nation’s energy security (Figure 9.2). Electricity production traditionally relies on a steady fuel supply (primarily fossil fuels), which would keep the power plants operating on the permanent basis. Eventual switching from the traditional fuel-burning plants to cleaner alternatives requires redesigning the grid in such a way that it properly responds to the sharp variations in demand, adequately compensates for the intermittent operation of the renewable energy systems, and can interact with distributed power generation systems.
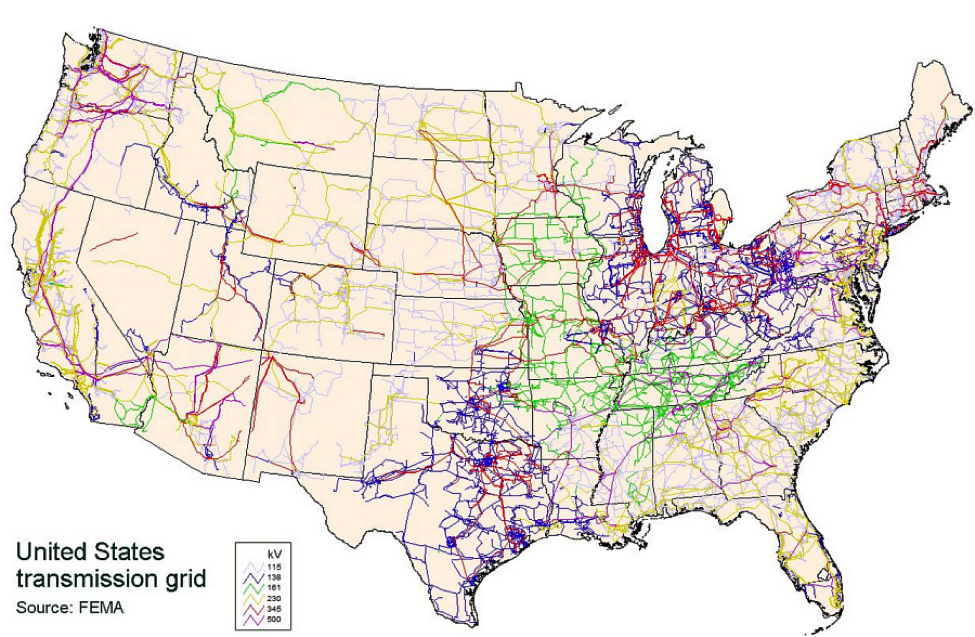
The transmission grid shown in the figure above shows the interconnection of power generating facilities with distribution sub-stations. The local distribution grid is designed to supply power to end users and usually has a radial structure. While some of the components of the grid are subject to renovation, it is not the physical structure of the grid that is the focus of current redesign efforts; it is the informatics component that is supposed to bring the grid to a new level of intelligence. Hence, the interactive combination of information technologies and transmission systems creates the smart grid system.
Reading Assignment:
Read the following article to learn about the smart grid and associated demand response technologies in more detail. Beyond the background, this article also provides a nice illustration of how the incorporation of demand response tools influences the real-life power demand curves
Journal article: Taqqali, W.M. and Abdulaziz, N., Smart Grid and Demand Response Technology, 2010 IEEE International Energy Conference, p. 710-715.
This article is available online through the Penn State library system and in Module 9 in Canvas.
Introduction of the demand response technologies is especially relevant to the power supply for buildings. According to US DOE (DOE 2007), buildings in the US consume around 72% of total electricity, and sensitive regulation of building energy demand is considered a major factor in sustainable development. Transitioning buildings to the smart grid is a complex task, which requires efforts in three areas:
- legislation to mandate the government and business actions;
- standard and technologies enabling building-utility communications;
- business model to balance the demand-response interactions. The following article describes how these three factors can be synergistically combined to radically change the way building electricity use is managed.
Supplemental Reading:
This article discusses the prerequisites of applying automated demand response technologies for power management and provides a case study of implementation of BACnet - a tool for load management and utility communication:
Journal article: Bushby, S.T. and Holmberg, D.G., Advancing Automated Demand Response Technology, ASHRAE Transactions, 2009, Volume 115, Issue 1, pp. 333-337.
This article is available online through the Penn State library system (see e-Reserves) and in Module 9 in Canvas.
Based on what you learned from these readings, please answer the following self-check questions:
Check Your Understanding
1. What are the key elements of the Smart Grid?
Click for answer.
- Advanced Metering Infrastructure (AMI)
- Demand Response
- Optimization and self-recovery
- Integration of large-scale renewable energy
- Integration of large-scale energy storage
- Integration of electric vehicles
2. The Demand Response system helps manage the peak power consumption via
A. direct access to consumer’s appliances
B. signaling customers about shifting tariffs during peak hours
C. temporary reducing or switching off the power supply
D. working out commitment from users to shed load at specified conditions
Click for answer.
3 What three layers are distinguished in the Smart Grid infrastructure?
Click for answer.
- power layer (power transmission and distribution structure)
- communication and control layer (including sensing and control devices)
- application layer (data analysis and feedback)
4. Which legislation in the US (year?) mandated the actions for the Smart Grid development?
Click for answer.
Supplemental Reading on Smart Grid:
Book chapter: Gevorkian, P., Large Scale Solar Power Systems: Construction and Economics. Chapter 10: Smart Grid System Deployment and Economics, pp. 203-220.
This book chapter overviews many things about the Smart Grid that have been already described in other reading assignments. Look on page 112 for examples of some physical and informational technologies that facilitate smart grid operation. This book is available online through the PSU Library system.
Government document: U.S. DOE, The Smart Grid: An Introduction [229]
9.3. Examples of Demand Response Innovations
9.3. Examples of Demand Response Innovations
The demand response business models are currently being developed by many companies. Those models require all-system analysis, since successful feedback between the different actors is key to effective operation. Behavioral aspects are seriously considered because they eventually control the decision-making on both sides of the utility-customer chain.
Below are links to some recent studies and pilot programs that seek to promote a demand response approach in power management. Please look through those examples and take a note which parties actually benefit from implementation of those approaches. Are there economic drivers behind them?
- Jeff St. John, Innovari Wants to Make Demand Response the Same As an Independent Power Plant [230], June 9, 2014
- Stephen Lacey, Opower Expands Behavioral Demand Response to 1 Million Customers [231], May 20, 2014.
- Severin Borenstein, Peak-Time Rebates (PTR): Money for Nothing? [232], May 12, 2014
- Jeff St. John, Tendril Is Back: Could Nest and SolarCity Benefit From Its Microtargeting Model? [233], May 7, 2014.
The activity in the end of this lesson will involve assessment of demand response technologies, so the above-listed reports may be useful illustrations for that assignment.
Supplemental Reading on demand response systems:
- Industry report: Hurley, D., Peterson, P., and Whited, M., Demand Response as a Power System Resource. Program Designs, Performance, and Lessons Learned in the United States [234], RAP. Synapse Energy Economics, Inc. 2013
9.4. Can Renewables Meet Global Energy Demand?
9.4. Can Renewables Meet Global Energy Demand?
When we talk about our energy future and contemplate the idea of eliminating fossil fuel combustion entirely and replacing it with cleaner renewable energy technologies, the key question everyone wants to know the answer to is:
Will renewables be enough?
The renewable resources - solar energy, wind, geothermal, biomass, hydro resources - are truly enormous. However, conversion of those resources to accessible, usable energy has a big "overhead". Creation, installation, and support of those technologies takes time, manpower, materials, and (you guessed it) more energy. The net consumable energy is what we hope to match with the existing global energy demand.
This question is very carefully addressed in the documentary "SWITCH" created by documentary director and writer Harry Lynch and Geology Professor Scott Tinker (University of Texas). The authors travel around the globe to visit the best state-of-the-art renewable and non-renewable energy facilities to understand the pros and cons of each and to put some numbers together.
Please watch the trailer below.
Video: Switch Trailer (2:24)
PRESENTER 1: Energy powers our lives. Everywhere we live, everywhere we go, everything depends on energy. But everything is changing. Oil is running out, or is it? Coal can be clean, or can it? Renewables will power the future, or will they? I'm Scott Tinker, and for 10 years, I've been searching for the truth about our energy transition. So many challenges.
Fresh on the minds of people, of course, is the Deepwater Horizon accident. You look on the news and there's people talking about fracturing. They're looking at it in Washington.
We have 600 million people in this country without access to electricity. Can you imagine? That's two United States. And the only way to find the solution is to go out and get it.
PRESENTER 2: For the first time ever, these landlords have an opportunity to receive a regular paycheck.
PRESENTER 3: And of course, when the wind does not blow, we generate nothing.
PRESENTER 1: But the benefits of new energies come with challenges of their own.
PRESENTER 4: We can make ethanol. It's a no-brainer. We know how to do that. I can tell you for sure that we can do it economically.
PRESENTER 5: And one of the great challenges then is scale.
PRESENTER 6: Scale is exactly the challenge because we use so much energy. It's mind-boggling.
PRESENTER 7: We will see a gradual electrification.
PRESENTER 8: Whoa.
PRESENTER 7: But where are you going to get the extra electricity to run all those electric cars?
PRESENTER 1: It was only by relearning everything I knew about energy that I would find the answer. What will it really take to go from the energy that built our world to the energy that will shape our future?
PRESENTER 9: Switch
One good thing about this film is that it does not push a certain political agenda and avoids polarized discussion about what types of energy should or should not be pushed forward. It attempts to take an objective look at the reality of the present-day energy situation, with its opportunities and challenges. Finally, and most importantly, it includes all pillars of sustainability in the discussion.
In this lesson, I ask you to watch this complete documentary [236] (98 min) as part of your learning and provide your reflection on the discussion forum.
Please refer to the Summary and Activities page for further instruction on the Lesson 9 Discussion Forum.
Summary & Activities
In this lesson, we have learned about different elements of power grid system, current issues with maintaining stable power supply, and options for better flexibility and "smart" management of electricity generation and distribution. The demand response technologies are considered game-changing in the Smart Grid models, so we looked at some recent trends and innovations reported in that area. This lesson also touched on the subjects of base load power and energy storage, since both of those topics present key questions for the sustainability of electric power.
| Type | Assignment Directions | Submit To |
|---|---|---|
| Reading | Complete all necessary reading assigned in this lesson. | |
| Discussion |
Watch the documentary "SWITCH [236]" (90 min), which explores the options for the future world's energy economy. Write a reflection (limit to ~500 words) on the following questions: 1. What do you see as main challenges standing in the way of switching from conventional energy sources to renewable energy sources? Is such a switch at all possible? 2. Are there any issues shown in the movie that you disagree with or would like to debate? Please provide an example and proper argument. Post your reflection onto the Lesson 9 Discussion Forum on Canvas. Comment on at least two other posts. Reply to any questions asked on your post. Deadline: for initial posting - this Sunday / for comment to other posts - Wednesday night (check exact due dates on Canvas calendar). |
Canvas: Lesson 9 Discussion |
| Reading Quiz |
Energy Storage Technologies (6 short questions) - see Canvas Deadline: Wednesday (before midnight) - check exact due dates on Canvas calendar. |
Canvas: Lesson 9 Activity |
References for Lesson 9:
DOE, 2007. DOE Buildings Energy Data Book [237]. U.S. Department of Energy.
Lesson 10: Sustainable Transportation Technologies
10.0. Overview
Overview
Sustainable transportation refers to not only vehicles, but also includes fuels, infrastructure to deliver distribute these fuels (pipelines, stations), road networks and railways. Assessment of the transportation system needs to address the system effectiveness to meet society needs and environmental load associated with employed vehicles and infrastructures. This lesson overviews three important topics: alternative fuels and their associated impacts, zero-emission vehicles and status of electric vehicle technologies, and perspectives of the mass transit in sustainable community.
Learning Objectives
By the end of this lesson, you should be able to:
- understand the choices of alternative fuels and list their pros and cons;
- explain the principles of technologies employed in zero-emission vehicles;
- compare performance of different transportation technologies by environmental and economic metrics.
Readings
Report: Boutwell, M., Hackett, D.J., Soares, M.L., Petroleum and Renewable Fuel Supply Chain [238], Stillwater Associates, 2014.
Book: National Research Council. Transitions to Alternative Vehicles and Fuels. Washington, DC: The National Academies Press, 2013. Sections 2.5 and 2.6.
Web article: Penalosa, E., Role of Transport in Urban Development Policy [239], Federal Ministry for Economic Cooperation and Development, 2005.
Questions?
If you have any questions while working through this Lesson, please post them to our Message Board forum in Canvas. You can use that space any time to chat about course topics or to ask questions. While you are there, please feel free to post your own responses if you are able to help out a classmate.
10.1. Alternative Fuel Vehicle Technologies
10.1. Alternative Fuel Vehicle Technologies
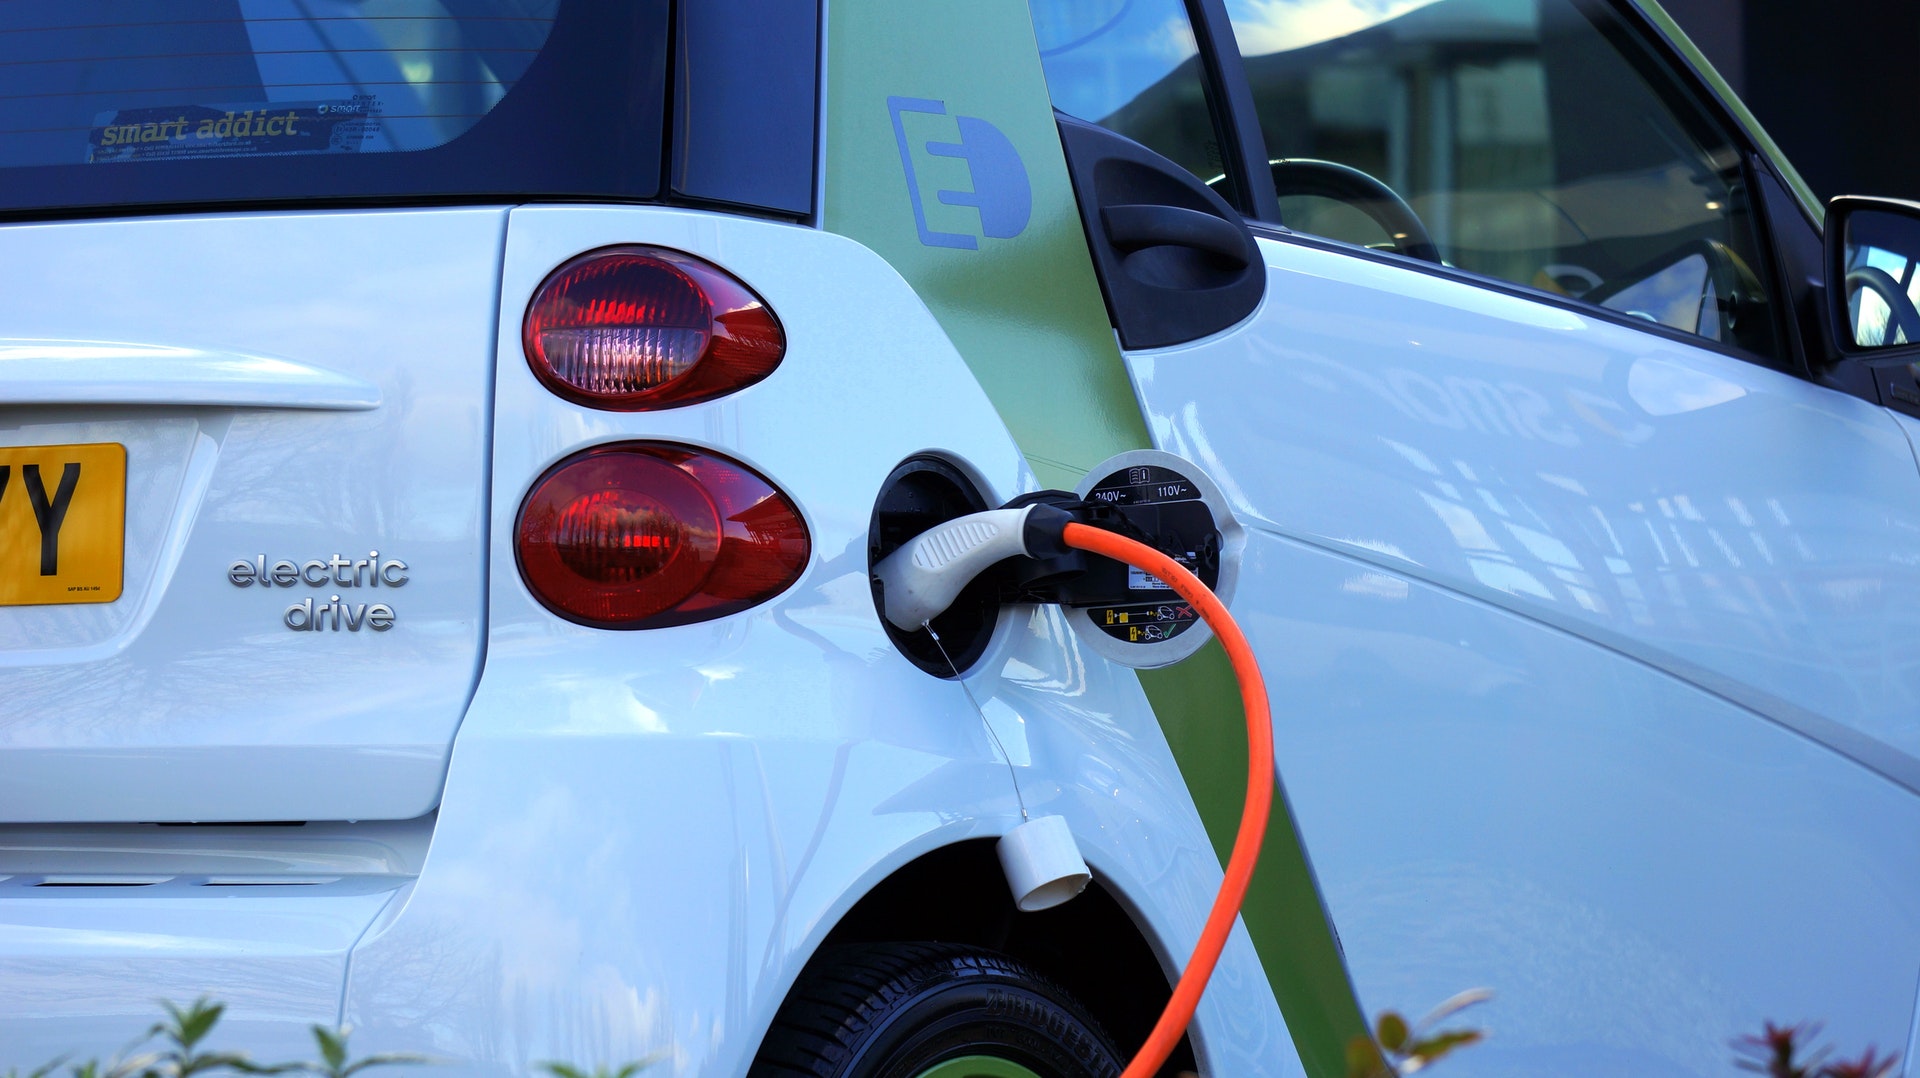
Let us start with some facts (Source: Sierra Club, 2014):
- Every day, the U.S. uses ~400 million gallons of oil to move people, goods, and vehicles.
- There are ~230 million gasoline-fueled vehicles in the U.S. that travel average 12,000 miles per year.
- About 70% of all oil used in the U.S. is used for transportation.
- About 70% of all oil used in the U.S. is imported from the countries at "high risk" of instability.
- Every day, the U.S. sends about $1 billion abroad for oil expenses.
While the demand for transportation fuels is increasing, the continuing dependency of the U.S. economy on the foreign oil has put the country in an extremely vulnerable position with respect to meeting its transportation energy needs. This vulnerability is the critical motivator in searching for alternative fuels for vehicles and looking for alternative types of transportation as well. Sustainability of transportation basically means the flexibility and ability to provide for your own needs using the resources that are local, widely available, or renewable. What are the options there?
A number of alternatives (including both liquid and gaseous transportation fuels) have been a subject of research and implementation for the last few decades. Let us review the background behind those options. Click on the following links to read about the various classes of alternative fuels considered for transportation purposes:
- Biofuels [243] (biodiesel, ethanol)
- Natural gas (NGV) [244]
- Hydrogen [245]
- Electricity [246]
All of the alternative fuels have their current advantages and disadvantages, which are briefly summarized in US DOE Data Table [247] (U.S. DOE, 2007).
Please note, the second row of this table shows an important metric used to characterize fuels (not only transportation fuels) - energy content or energy density. It is measured in energy units per unit volume or unit mass of the fuel. For example, from the data in the table, we can see that diesel and biodiesel fuels provide the highest amount of energy compared to other liquid fuels.
Alternative fuel supply chain and distribution
Viability of certain types of transportation fuels is closely related to the processing, supply, and distribution infrastructure. This is especially critical in the U.S. society and economy, which are heavily reliant on the usage of road vehicles for personal and industrial needs.
The following reading will introduce you to the strategies and facts associated to the transportation liquid fuel supply chains. This covers both existing renewable and non-renewable fuel infrastructures:
Reading assignment:
Report: Boutwell, M., Hackett, D.J., Soares, M.L., Petroleum and Renewable Fuel Supply Chain [238], Stillwater Associates, 2014.
While reading, try to find answers to the following self-study questions:
- What are the main types of liquid alternative fuels intended for transportation?
- What are the main feedstocks to produce those alternative fuels at the national scale?
- What are the main fuel delivery systems used to distribute petroleum and alternative fuels from the source of treatment to the consumers? Are those systems similar or must be different?
- Can you understand the nomenclature of ethanol blends? For example, what are E85 or B20 fuels by composition?
Transportation Emissions
Strong motivators for developing alternative vehicle technologies and fuels are growing emissions and alarming urban air pollution levels. According to US EPA, in 2017, CO2 emissions from transportation sector surpassed the long-time leader – electric power sector – in the total national emissions budget. This change in “leadership” in part happened due to increasing addition of natural gas and renewable sources to the power generation mix while retiring older coal power plants in a number of states. Here is how the last half-decade of CO2 data looks like:
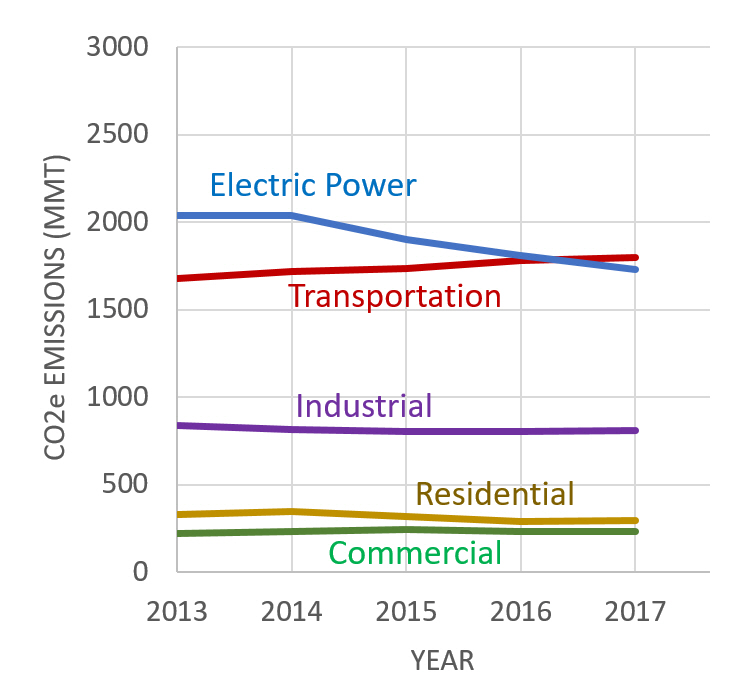
It is also estimated by EPA that nearly 60% of those transportations emissions in the United States come from passenger vehicles – cars, SUVs, and pickup trucks. There are economic reasons for that growth. In the late 2000s, the automobile emissions were moderated by the policies adopted by the Obama administration, which limited the amounts of gasoline the vehicles were supposed to use per mile. The Trump administration initially aimed at elimination of those fuel efficiency standards, which would most likely push future transportation emissions up. However, the proposal was recently revised, and after receiving comments from industry and public, the government did not eliminate the Obama standards, but adjusted them, to enforce only 1.5% annual MPG increase for passenger vehicles (as opposed to 5% under Obama regulation). The main argument for this change was that less stringent standards would make new cars more affordable, and thus increase driving safety for the families who would be otherwise be forced to drive older cars (USA Today [248]).
Low gas prices have also been contributing to the trend, tempting Americans to drive more miles and purchase larger personal vehicles (SUVs and such), which typically have lower gas mileage.
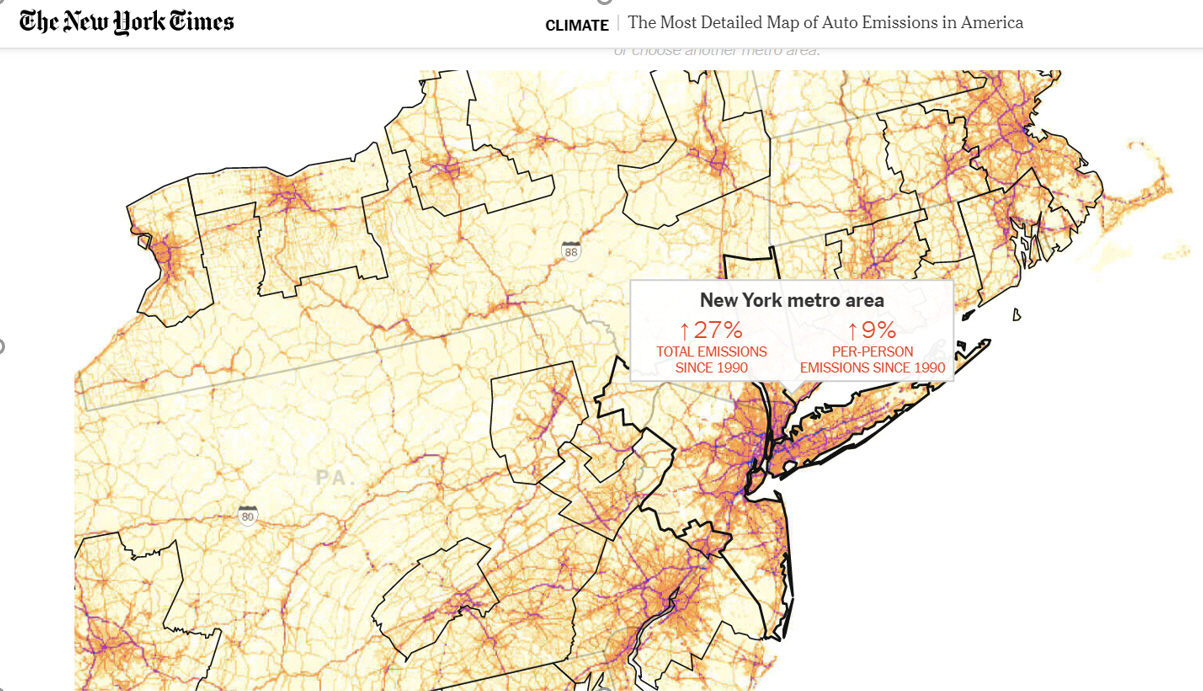 [249]
[249]Click on the image to access the interactive map showing the transportation emissions in America. Mouse over a city area to display the emission metrics. Note the difference between the total emissions and emissions per person. While New York City leads the way among US cities in total emissions, if those emissions are normalized by population, contribution per person appears rather moderate (Popovich and Lu, 2019).
From these data, we see two drivers behind increasing emissions: population growth in metropolitan areas and increasing time behind the wheel. Some areas do better than others in terms of limiting driving through encouraging alternative mobility options. One example is DC Metro area, which shows the drop in emissions per person. In spite of increasing total population and total emissions, people appear to drive less than in other urban regions with high reliance on suburban commute.
Curbing vehicle emissions will require several factors working in synch: more efficient cars, developing alternative engine technologies (e.g., electric, hydrogen, natural gas), and changing in human lifestyle. Cities and states look for expanding transit options, such as rail, bus, and subway services, as well as encouraging carpooling and vehicle sharing programs. It is also anticipated that in 2021, New York will become the first city in the US to adopt a congestion pricing plan [250] to discourage drivers from entering the busiest areas of the city.
10.2. Zero Emission Vehicles
10.2. Zero Emission Vehicles
The concept of zero-emission vehicles is typically attributed to the transportation options that do not result in any harmful emissions during vehicle operation. Harmful emissions are defined as those known to have a negative impact on the environment or human health. They can include carbon dioxide, carbon monoxide, nitrogen and sulfur oxides, ozone, various hydrocarbons, volatile organic compounds (VOC), heavy metals in volatile forms (e.g., lead, mercury, etc.), and particulate matter.
Typical examples of zero-emission vehicles are electric (battery-powered) cars, electric trains, hydrogen-fueled vehicles, and human / animal powered transportation (e.g., bicycles, velomobiles, carriages, etc.). The battery technology for electric vehicles is based on charge/discharge cycles, meaning that the battery is charged beforehand using an electricity source and is discharged during vehicle operation. Because electricity production may involve some emissions, there is also a concept of well-to-wheel emissions, which includes not only operating emissions, but also those associated with the fuel source and other stages of the vehicle operating cycle. So, the "zero-emission" term is conditional in that sense.
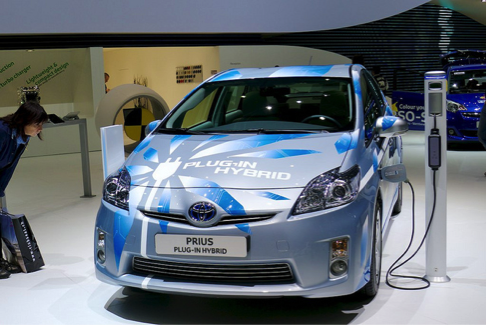
The hydrogen-fueled vehicles are typically based on fuel cell technology, which imply electrochemical conversion of the fuel energy into electricity (as opposed to combustion). As a result, the only emissions of fuel cell operation are water and heat, which are not classified as harmful and therefore allow placing the fuel cell transport vehicles in the zero-emission category. The same as electric vehicles, fuel cell vehicles shift the emissions to the stage of fuel production. Thus, manufacturing of hydrogen gas via reforming of natural gas results in CO2 emissions, which must be taken into account in the life cycle assessment.

However, there is a possibility of designing a sustainable zero-emission lifecycle for electric and hydrogen vehicles, if electricity for recharging the batteries is supplied from renewable sources such as wind, solar, hydro-power converters, and the hydrogen to power fuel cells is produced via electrolysis or other emission-free technologies.
The energy conversion technologies that support the electric vehicles rely heavily on special chemistry and materials necessary to facilitate the efficient charge transfer processes. Understanding the components and principle of those technologies is important to foresee potential barriers on the way to their wide implementation and commercialization. The following learning materials will provide you with the basic knowledge on how the battery and fuel cell systems work.
Li-ion battery technology for cars
A schematic representation of a generic Li-ion battery is given in Figure 10.1. Roughly, Li-ion cell consists of three layers: electrode 1 (cathode) plate (usually lithium cobalt oxide), electrode 2 (anode) plate (usually carbon), and a separator. The electrodes inside the battery are submerged in an electrolyte, which provides for Li+ ion transfer between the anode and cathode. The electrolyte is typically a lithium salt in an organic solvent.
.svg)
During the charging process, a DC current is used to withdraw Li+ ions from the cathode and to partially oxidize the cathode compound:
LiCoO2 → Li1-xCoO2 + xLi+ + xe-
The released Li+ ions migrate through electrolyte towards the anode, where they become absorbed in the porous carbon structure:
xLi+ + xe- + C6 → xLiC6
At the same time, electrons travel through the external circuit (electrolyte is not electron conductive).
During the battery discharge, the reverse process takes place. Li+ ions spontaneously return to the cathode, where electrochemical reduction occurs.
Please watch this short video for an animated illustration of the Li-ion battery principle:
Video: Lithium-ion batteries: How do they work? (2:40)
The lithium ion battery is the power source for modern electric vehicles. These days, everyone's heard of lithium ion batteries. But what makes them so special? First of all, each battery is made up of many smaller batteries called cells. Let's take a closer look at one to see how it works. The electrical current reaches the cells via conductive surfaces. In this case, aluminum on one side and copper on the other. And just as in every other battery, there's a positive and negative electrode called the cathode and the anode. The cathode, or positive electrode, is made of a very pure lithium metal oxide. The more uniform its chemical composition, the better the performance and the longer the battery life is. As you'd expect, the anode, or negative electrode, is located on the other side. It's made of graphite, a form of carbon with a layered structure. The battery is filled with a transport medium, the electrolyte, so that the lithium ions carrying the battery's charge can flow freely. This electrolyte must be extremely pure and as free of water as possible in order to ensure efficient charging and discharging. To prevent a short circuit, there's a layer placed between the two electrodes, the separator. To the tiny lithium ions, the separator's actually permeable. The experts call this property microporosity.
Let's take a look at what happens when a battery is charged. The positively charged lithium ions pass from the cathode through the separator into the layered graphite structure of the anode where they're stored. Now, the battery is charged. When the battery discharges, that is, when energy is removed from the cell, the lithium ions travel via the electrolyte from the anode through the separator back to the cathode. The motor converts the electrical energy into mechanical energy making the car go. The amount of energy available and how long the batteries last is closely related to the quality of the materials used. To sum it all up, higher quality, pure materials, along with customized formulations lead to longer battery life and better battery performance. PRESENTER 2: BASF, The Chemical Company.
If we compare the energy densities of the typical rechargeable Li-ion battery (~ 0.875 MJ/kg weight) and regular gasoline fuel (~46 MJ/kg), we can see that the gasoline beat battery electricity in potential to deliver power at least by a factor of 50. Thinking that typical engine is normally used at ~50% capacity, to match the capabilities of the internal combustion engine, the Li-ion battery has to be made at least 20 times more efficient, or the size of the on-board battery should be increased 20 times, which is a prohibitive option.
Limitations of the Li-ion batteries are rooted in the material properties.
For example, the LiCoO2 ⇔ Li1-xCoO2 conversion is only reversible with x<0.5, which limits the depth of the charge-discharge cycle. But, with a wider variety of materials available, research is underway to develop new generations of Li-ion batteries.
For example, take a look at Sigma Aldrich website [256], which lists multiple alternatives for cathode, anode, electrolyte, and solvents.
| Advantages | Limitations |
|---|---|
| Relatively high energy density and potential of finding even better formulations | Circuit protection needed to avoid damaging high voltage / current |
| No need for priming - new battery is ready to operate | Aging - battery gradually loses its capacity even if not in use |
| Low self-discharge (compared to other types of batteries) | Toxic chemicals are subject to regulations |
| Low maintenance | High cost of materials and manufacturing process |
| Capability to generate high current / power | Technology is not fully mature; varying components and chemicals |
Supplemental Reading on Li-ion Battery Technology:
- Goodenough, J.B. and Park, K.S., The Li-Ion Rechargeable Battery: A Perspective, J. Am. Chem. Soc., 2013, 135 (4), pp 1167–1176.
- Etacheri, V., Marom, R., Elazari, R., Salitra, G., and Aurbach, D., Challenges in the development of advanced Li-ion batteries: a review, Energy & Environmental Science, 2011 (9), 3243-3262.
Fuel Cell Technology for Cars
Fuel cell is similar to a battery in the electrochemical principle of energy conversion, but different in operational design. Instead of storing the reagents and products of chemical reactions inside, like batteries do, fuel cells operate on continuous inflows/outflows of reagents and products. In that sense, they are not limited by discharge time and can generate electricity non-stop as long as fuel is supplied. Hydrogen is the best-proven fuel for fuel cells, although its storage and supply imposes some constraints on this technology.
A schematic representation of a hydrogen/oxygen fuel cell is given in Figure 10.2. The main components of the fuel cell include: membrane electrode assembly, which consists of a proton-exchange membrane and electrodes (anode and cathode) attached to the membrane on each side, gas diffusion layers, bipolar plates, and supporting structure. The fuel cell electrodes contain dispersed catalyst particles (usually platinum), which are necessary to promote electrochemical reaction.
A hydrogen-powered fuel cell combines hydrogen with oxygen in the electrochemical reaction to produce water and electricity. In case of direct contact of these gases, the reaction H2 + ½ O2 = H2O is very active and generate significant amount energy (under certain conditions – explosion). In a fuel cell, hydrogen is separated from oxygen by a proton conductive membrane, so, in order to react, it is forced to transform into ionic form by losing electrons:
H2 -> 2H+ + 2e- - this reaction occurs on the cell anode.
Further, the formed hydrogen ions (protons) are transferred through the proton-exchange membrane, while electrons are transferred through the external circuit, where they can be harvested as electric current. Once reaching the cathode, protons (H+) react with oxygen molecules, consuming electrons from circuit and producing water:
2H+ + ½O2 + 2e- -> H2O - this reaction occurs on the cell cathode.
As long as the supply of reagents, hydrogen and oxygen gases is maintained, the process continuously generates electric energy and water.
Please watch the animated illustration of this process in the following video:
Video: Honda's video guide to Hydrogen fuel cell technology in cars (eg. FCX Clarity) (3:30)
Fuel cell cars, which run on electricity produced from compressed hydrogen, emit zero harmful emissions and could be the future of motoring. They can be just as fast, practical, and can travel as far as a conventional petrol or diesel engine car, but their technology is very different. And importantly, the only thing that comes out of the exhaust is water vapor. Rather than having a petrol or diesel tank like a conventional car, the fuel cell car has a tank that stores compressed hydrogen as a gas. Hydrogen is used as an energy carrier so that a fuel cell car can produce its own electricity onboard, rather than storing it in batteries. This compressed hydrogen is expanded and then fed into the fuel cell stack. The fuel cell stack is like a tiny electric power station. Inside it, the hydrogen combines with oxygen from the air to generate electricity and water as a byproduct. Water vapor is the fuel cell car's only emission. The electricity created inside the fuel cell stack is used to power the electric motor, which is in turn used to drive the car. The fuel cell stack is made up of hundreds of individual cells stacked together like a loaf of bread. In fact, each cell is like a sandwich with a Membrane Electrode Assembly, or MEA, between two separators, or bi-polar plates. The MEA is made up of a Proton Exchange Membrane, or PEM, which sits between hydrogen and oxygen electrode layers and gas diffusion layers. In each cell, hydrogen gas passes over the hydrogen electrode. Each hydrogen atom is converted into a hydrogen ion in a catalytic reaction, releasing an electron in the process. The hydrogen ions then pass through the electrolytic membrane, where they bond with oxygen ions straight from the atmosphere. The previously-emitted electrons from the hydrogen molecules arrive at the oxygen electrode via an external circuit. The released electrons create a flow of direct electrical current in the external circuit, and water is generated at the oxygen electrode as a byproduct. This water is drained from the system and exits the car as water vapor via the exhaust. Because the electricity is generated from hydrogen and oxygen, no carbon dioxide or other pollutants are emitted from the car. It's the ultimate in clean performance. Honda's FCX Clarity is the world's first production fuel cell car and is already on sale in the US and Japan.
The productivity of this simple process, i.e., how much electricity a single fuel cell can produce, is limited by a few factors. First is the proton conductivity of the membrane. The membrane consists of a special polymer (for example, sulfonated tetrafluoroethylene, Nafion®) which performs as an ionic conductor only under specially controlled temperature and humidity regime. This and other polymers produced for such applications are quite expensive. Second, the platinum (Pt) catalyst is necessary to provide sufficiently fast kinetics of the electrochemical reactions. Platinum is a noble metal, which has high cost and limited availability.
When it works, the fuel cell process is very efficient (80-90% efficiency) and can generate electricity pollution free and with no mechanical degradation to the cell components.
| Advantages | Limitations |
|---|---|
| No recharging required, so the power can be generated away from electricity sources | Costly components, especially platinum catalysts |
| Hydrogen-fueled fuel cells do not pollute: the only exhaust is water | High sensitivity to temperature (slow start-up when cold, degrade when hot) |
| Compact cell size and possibility of stacking to fit applications of various scale | High sensitivity to impurities in fuel; catalyst is easily poisoned |
| High efficiency even at low power levels | Hydrogen supply infrastructure is not developed |
| No noise | On-board hydrogen storage is a challenge |
| Low toxicity (compared to batteries) |
For quite a while, battery- and fuel-cell-operated cars were parallel track for future implementation of electric automotive engines, and the advancement of one or the other depended on breakthroughs in materials and device efficiency.
To overview the current status and trends in these technologies, please refer to the following reading.
Reading Assignment:
-
Book: National Research Council. Transitions to Alternative Vehicles and Fuels. Washington, DC: The National Academies Press, 2013. Sections 2.5 and 2.6. (See E-Reserves in Canvas.)
Please read Section 2.5 to learn about the status and promise of the battery-powered vehicles.
Please read Section 2.6, "Hydrogen Fuel Cell Electric Vehicles to learn about the status and promise of the hydrogen engines for cars.
Based on the above reading, try to shape your opinion on the following question: Which type of electric vehicles in your opinion may have a better future – fuel cell or battery? Find specific arguments, pros and cons, to support it. In this lesson activity, you will be asked to perform an investigation to compare these technologies based on some common metrics. For more details, see Summary and Activity section.
10.3. Sustainable Community and Mass Transit Technologies
10.3. Sustainable Community and Mass Transit Technologies

Sustainable community is a term usually applied to a certain inhabited entity, a neighborhood, a town, or a city that is economically, socially, and environmentally healthy and resilient. The typical feature of a sustainably developing community is a holistic approach to meeting the local society needs, as opposed to fragmented efforts, which focus on one specific need and ignore others. Ideally, a sustainable community should have a better quality of life, which is built upon responsible and organized citizenship of its members (not on businesses compromising well-being of other communities. A sustainable community also provides economic security through reinvestments in the local economy, diverse and financially viable economic base, sustainable business (PCSD, 1997). The National Partnership for Sustainable Communities defined six principles of livability that make a community sustainable (PSC, 2014):
- Provide more transportation choices.
- Promote equitable, affordable housing.
- Enhance economic competitiveness.
- Support existing communities.
- Coordinate policies and leverage investment.
- Value communities and neighborhoods.
Availability of transportation choices is the number one factor mentioned on this list. It is interesting that transportation is one thing that becomes worse with economic growth. Other important parts of society development, like information, sanitation, manufacturing, and energy efficiency typically improve with economic development, but not transport. And now, especially, development of new mass transit options become a significant part of plans of orienting communities towards sustainable development.
Urban communities are essentially shaped by their transportation systems. Mainstream city planning in the U.S. has been based on the networks of motor roadways and personal car use, with public transit as second priority. In the second half of the 20th century, the car use and automotive fuel consumption steeply increased, as did greenhouse gas emissions from the transportation sector (~20-25% of world energy consumption). The sustainability of the current communities that are heavily reliant on car transportation becomes questionable for at least two reasons:
- environmental impact - greenhouse gas emissions, air pollution, depletion of petroleum resource, increased land and water use demands; and
- social impact - overdependence on cars for basic needs and commuting, limited infrastructure to support growing car culture, decreased quality and aesthetics of urban life.
Development trends were slightly different in Asia and Europe, where planning was influenced by lower availability of resources or land required for automotive culture. Traditionally, European culture is more reliant on mass transit and has invested more into it. Thus, the International Association of Public Transport (UITP) based in Brussels, Belgium, supports a holistic approach to urban transportation and advocates public transportation development in 92 countries worldwide [Source: Wikipedia / International Association of Public Transport [260]]. On the average, transport emissions of a U.S. city are about 4 times higher than that in Europe and about 24 times higher than that in Asia (UITP, 2014).
Recent trends, however, show that public transit may be re-establishing its role in American metropolitan areas, as several factors suggest that transit may be a more sustainable transportation option (Rutsch, 2008). Incentives that may affect people's choice of public transit versus private cars may include economic benefits, convenience, and speed. Strategies to enhance these factors via new technologies, policies, and business models raise competitiveness of the mass transit.
Please refer to the following reading to learn about possible measures and strategies to make the public transportation more attractive in urban settings.
Reading Assignment:
-
Penalosa, E., Role of Transport in Urban Development Policy [239], Federal Ministry for Economic Cooperation and Development, 2005.
This paper examines a range of social impacts of urban development, and especially addresses alternatives to transportation models. It also features a number of real-world examples of how transformation of mobility systems in cities contributed to the well-being of their inhabitants.
Based on this reading, try to formulate your vision of the sustainable urban community and share it on this lesson discussion forum. What are your most favorite and least favorite measures to undertake? If you had a power of policy making, what transportation model would you choose?
According to experts, modification of public transit systems through introducing new technologies would be a critical step in meeting the world's future mobility needs. The future urban transportation networks should help cities lower their per capita carbon footprint, make cities more livable by easing commute, and increase accessibility and safety. The Sustainable Cities Institute [261] names “holistic transportation” one of the key principles for urban sustainability. Holistic transportation planning with environment in mind means that besides vehicles themselves, planning should include such elements as streets, sidewalks, pedestrian spaces, bicycle routes, and enabling technologies for private and public fleets.
The following video features a few innovations related to long-distance and short-distance transit, which are discussed in the context of sustainable city planning. Although some technologies and ideas sound and look somewhat futuristic, others started their way up the TRL scale and get much closer to commercialization.
A couple of points / questions to focus on while watching the video:
- See how the new ideas for transport technologies are evaluated. What criteria and metrics make the top of the list?
- Try to watch critically and recognize both GO and NO-GO factors for these technologies in the future.
- What role is played by policy and city planning in the implementation of new transportation ideas?
Video: Sustainable Energy: The big ideas changing transport (24:42)
[MUSIC PLAYING] ASHLEY HOUSE: Hi, Afua.
AFUA ADOM: Hi, Ashley.
ASHLEY HOUSE: Have you ever wondered how we might get from A to B in the future? Maybe we'll trade in our bicycles and hail helicopters like cabs.
AFUA ADOM: Or even magnetically float through tunnels at close to the speed of sound.
ASHLEY HOUSE: In today's episode, we'll flash forward to look at mobility in the city of tomorrow.
[BELL RINGS]
[MUSIC PLAYING]
Over the last 100 years or so, no one has invented a major new mode of transport. In fact, here in Oxford, people were riding on their bikes almost as much back then as they do today. But whether you travel on two wheels or four, commuting can be a real drag. It's no wonder we complain about it.
AFUA ADOM: Navigating blocked and congested roads, waiting for packed and delayed trains, again and again, on a loop. Luckily, that could be about to become a Hyperloop. Coming up.
ASHLEY HOUSE: We'll be zooming through tubes in floating pods and looking into the hype around Hyperloop. We'll also be jumping into state-of-the-art helicopters and pacing the streets of Gothenburg, where city planning is one step ahead.
AFUA ADOM: I was lucky enough to get the lowdown on future planning from Professor Malcolm McCulloch here at the University of Oxford.
ASHLEY HOUSE: But first of all, let's get our figures and our facts straight.
Today, 55% of the world's population live in urban areas. But by 2050, this is expected to increase to 68%. Robotaxis are expected to take off rapidly after 2025, with 80% of people using them where available. As a result, car ownership should drop dramatically.
By 2030, a quarter of passenger miles traveled on America's roads is expected to be in shared, self-driving electric vehicles, reducing the number of cars on city streets by 60%, emissions by 80%, and road accidents by 90%. How would you like to ditch your slow train and instead levitate straight to your destination in record time? In downtown, LA a revolution in mobility is making the seemingly impossible possible.
[MUSIC PLAYING]
Virgin Hyperloop One is designed to be an energy-efficient pod that will travel from origin to destination at speeds of up to 1,100 kilometers an hour, over or underground, on demand. Its inventors see it as one of the most innovative new major modes of transport in 100 years. Once passengers board the Hyperloop, it accelerates via electric propulsion through a low-pressure tube. The vehicle floats above the track using magnetic levitation and glides at airline speeds for long distances due to ultra low aerodynamic drag.
It's fully autonomous and enclosed, so the hope is that this will eliminate operator error and avoid adverse weather conditions. It's also clean, insomuch that there are no direct carbon emissions.
ROB LLOYD: When we look at the technology we're developing, when we look at the progress we've made, when we look at the fact that we've built a proof of concept already, I think we're going to change people's lives. I think we're going to improve the lives of people around the world. It's not just going to be for people that have a lot of wealth or in wealthy areas. We're going to dramatically change how people live.
We're going to increase opportunities for jobs. We're going to change relationships. We're going to change their expectations of how commerce is conducted. So when we really think about it at Virgin Hyperloop One, we have a unique opportunity to change the world.
ASHLEY HOUSE: People have been dreaming about new forms of high-speed travel, including in a vacuum, for more than a century. Now, thanks to Hyperloop technology, that dream is about to become a reality. The Virgin Hyperloop One team started by combining existing technologies-- linear electric motors, maglev, vacuum pumps-- and built on a basic design to create a revolutionary mode of transport.
JOSH GIEGEL: So we started this company in a garage in Los Angeles in November of 2014, and the goal was to create the fifth mode of transportation. What we wanted to do was completely revolutionize how you thought about getting somewhere till you got there. So from the app experience, integrating with the last mile, to something that doesn't have turbulence. It goes where you want to, when you want to, for a price that you can afford.
And you're not stopping in other destinations along the way. And, ultimately, you get your time back, which is what we're trying to give to everyone.
ASHLEY HOUSE: So how will it feel to step onto a Hyperloop system? Will we levitate from one end of the country in the blink of an eye? Not quite. It'll take 35 minutes from Las Vegas to Los Angeles. And its engineers say there'll be no turbulence, no wind in your hair. You'll accelerate and decelerate gently, just like riding a passenger plane or stepping into a lift. And from the outside, all you'll hear is a loud whoosh due to the fact that the travel pod isn't touching anything.
In May 2017, Hyperloop One was the first company in the world to test a full-scale Hyperloop.
ROB LLOYD: To describe my feelings, I only have to look at the faces of the engineers as that test proved successful, as the vehicle levitated and moved down the track. An immense sense of pride and accomplishment in doing something that the world had never seen before.
ASHLEY HOUSE: It's not just good news for passengers. It's also good news for freight. Virgin Hyperloop One will deliver high-priority, on-demand goods, such as fresh food, medical supplies, and electronics at the speed of flight, making same-day delivery and efficient supply chains for businesses entirely possible.
ROB LLOYD: It will truly transform commerce, decrease the inventories invested in supply chain, and be part of what is becoming a world based on demand economy.
So next time you're chugging along on a slow train, just think, in only a couple of decades, you may well be levitating through a tunnel at mind-blowing speed in a revolutionary new mode of transport.
AFUA ADOM: Malcolm McCulloch is associate professor in engineering science and group leader of the Energy and Power Group here at the University of Oxford. As well as researching the domestic energy sector, user-centric demand site management technologies, and behavioral change, he's at the forefront of developing powertrains for innovative electric vehicles. Malcolm, thank you so much for having us here at Oxford University. Now, firstly, tell me a little bit about yourself and what you do here.
MALCOLM MCCULLOCH: So I'm an engineer. And I've been looking, in the last 20 years or so, in sustainable energy. I've been looking at the role of transport and the way it's changing, and also the way energy systems are evolving.
AFUA ADOM: Malcolm, firstly, tell me, what are the key technologies that will revolutionize mobility in the city of tomorrow? Well, there are going to be three new technologies that we're going to need in the near term, the mid term, and the long term. In the near term, it's going to be cheaper and more compact batteries for electric vehicles. In the medium term, it's going to be autonomous driving and making sure that works to an acceptable level.
And then, the long term is going to be looking to say, what are the alternative fuel choices for long-distance traveling? And one of the interesting ones is going to be ammonia, which is basically a better form of carrying hydrogen.
AFUA ADOM: What are the key challenges behind these new kinds of technology?
MALCOLM MCCULLOCH: So in battery technology, it's more about saying, how do we make things compact and very cost effective. And that's mainly about how do we scale that up. And that's happening.
On autonomous vehicles, it's all about saying, how do we get those algorithms to be even better than they are now and to be a lot more safer? And again, that's on its route to being viable in the near future. I think the real interesting challenge comes through looking to say, what are the alternative fuels? And in ammonia particularly, it's saying, how do we produce ammonia from green energy sources?
And there's some really exciting work that's going on at the moment is saying, how I can we use renewable energy to actually produce ammonia? But the really nice thing about ammonia is it's actually used in a multi-billion-pound industry, which is for fertilizer. So there's a lot of work and effort in developing a green source of ammonia. And I think that's going to be the winner in the next decade in terms of long-distance transport fields.
AFUA ADOM: Tell me, how do you think innovation like the Hyperloop can help climate change?
MALCOLM MCCULLOCH: So what that technology does is addresses the challenge and how do we do long distances and high speed. And as many from point-to-point travel. And the advantage is that the Hyperloop One allows us to do that high speed on ground, which means that we got access to renewable energy sources to actually undertake that mobility option, which we can't easily do by doing air travel.
But interestingly, about 15 years ago, I set a challenge to my students to say, how do you get to London to New York on zero carbon. And they looked at actually developing a concrete version of the Hyperloop over that distance. And they found it was actually feasible, and they found that the carbon payback period on that was about five or six years.
So it is possible, but it's a-- the technology enabling us to do that is still going to be decades away. But who knows in 2030, 2040, what we might be doing?
[MUSIC PLAYING]
ASHLEY HOUSE: When I'm stuck in traffic, I often wish I could just fly over it all direct to my destination. Wishful thinking? Maybe not anymore. In Germany, there's an inventive team looking to make it happen.
[MUSIC PLAYING]
The Volocopter is a fully electric aerial mobility solution. The inventor's vision is that it will connect vital hubs, such as airports, with city centers, and flights can take off every minute and be available on demand.
FLORIAN REUTER: The Volocopter is intended to add a new mode of transport that will help us alleviate current congestion levels. Certainly, this is a transport in the air, and I don't expect 100% of the ground transport to vanish and go up into the third dimension. But certainly a large part of it on certain routes.
Since its inception, the Volocopter has been flying all electric. So we intend to make it as sustainable as possible.
ASHLEY HOUSE: The developers say the system will be similar to current ground-based ride sharing apps. Simply order a Volocopter via your smartphone, and one will be assigned within minutes. Then they say all you have to do is sit back and enjoy the bird's-eye view.
FLORIAN REUTER: The Volocopter is an entirely novel type of vertical takeoff and landing aircraft. By its DNA, it's a drone, so you can fly remotely controlled. It can fly all by itself. Or you can put a pilot in and have them operate it via the joystick. And all in all, it's an extremely safe, sustainable, and very quiet vehicle.
ASHLEY HOUSE: So the inventors hope that anyone and everyone can just jump in and fly whenever and wherever they fancy. But how are they ensuring it's safe?
FLORIAN REUTER: Any individual critical component can fail, and the Volocopter is prone to compensate for that. It goes so far that when we were walking onto the airfield with the certifier, we were able to show him failure scenarios. So for example, he could say, OK, now turn off propeller two and nine. Can I see battery six failing? Can I see flight control number two providing erroneous sensor data, for example? And we were able to demonstrate, in full flight, how the vehicle fully compensated for all of these scenarios.
ASHLEY HOUSE: It sets a new benchmark where carbon emissions are concerned, as fuel is replaced by electricity. In addition, maintenance, repair, and overhaul time should be reduced as the system avoids complex mechanical components.
FLORIAN REUTER: So when we talk about the operational costs of the Volocopter maintenance, repair, overhaul-- MRO, as we say-- our primary cost driver in today's helicopter operations. In the Volocopter we have a very different outset, which is none of our individual components is absolutely safety critical. So we can reduce the level of maintenance required significantly, one.
Secondly, all of our components are very well accessible and have extremely low wear and tear over time. So we expect, in general, the MRO costs to be dramatically lower than with traditional helicopters today.
ASHLEY HOUSE: In December 2017, Brian Krzanich, former CEO of Intel Corporation, test drove the Volocopter for the first time.
FLORIAN REUTER: So we are testing the Volocopter regularly on our test field here in Brussels. So it's pretty much every day flying. We expect to see a number of demonstrations in relevant environments in cities in 2019. Nevertheless, demonstrations. And we expect to see first commercial operations somewhere between three to five years, hopefully on the lower end of that timeline.
ASHLEY HOUSE: So it might be just a matter of years until we all have access to our very own private Volocopter with a simple swipe of our smartphone. It looks like the sky's the limit.
AFUA ADOM: Malcolm, how do we make all these new, revolutionary transport systems interoperable?
MALCOLM MCCULLOCH: Well, the key is to make it really easy for people to move from one mode to another mode. And the way we do that is make sure that it's co-located. So when we come off our planes, for instance, we can just go a few steps, and there's our Volocopter ready for us to be able to take us to the final distance. And if we're really smart, we have the same ticket to enable us to do the complete end-to-end journey.
AFUA ADOM: Tell me, how realistic is it that the air will become the new public transport highway?
MALCOLM MCCULLOCH: In one sense, we already use the air a lot for long-distance travel. If you're looking at intracity travel, then I think there is a possibility that it might become more viable, especially as the density of batteries increases and we have our high-powered motors. It allows these technologies to become more feasible. What the price point is going to be and whether we can get the regulatory environment in place, that's going to be the challenge.
AFUA ADOM: So we could see a time where we're using Volocopters like a taxi service to get to work?
MALCOLM MCCULLOCH: That is a possibility. The question is, is it going to be at the right price point, and are we going to get the regulatory framework in place?
AFUA ADOM: How can we make sure that green transport solutions are accessed by everyone?
MALCOLM MCCULLOCH: Well, the issue is that we have to make the service affordable, fast, and equitable for everybody. And the interesting thing is that, as batteries are being produced more and more, we're getting much smarter in the way that we make them so that we're finding that the costs are really coming down. And that means that these technologies are now becoming much more accessible to a wider range of people.
AFUA ADOM: Malcolm, thank you so much for that. Stay with me, I've got some more questions for you. But first, I thought you knew everything there is to know about mobility in the city of tomorrow? Well, here's one common misconception.
ASHLEY HOUSE: You thought you knew? Think again. Myth-- vehicle sharing could provide environmentally friendly transport to everyone in the world. Fact-- in order to take off globally, vehicle sharing requires a critical population mass, and still has a series of challenges to overcome.
Car sharing needs to overcome serious competition from other modes of transport, such as affordable taxi services that are easily summoned on smartphones. Rates need to be irresistibly attractive. For electric and hydrogen car sharing to grow successfully, city councils have to step up and support it with adequate infrastructures like public chargers and dedicated parking, which make the cars straightforward to use.
If car sharing services can bring all these factors together, there's nothing to stop the 2 billion cars expected to hit the roads by 2040 being shared, cleaning up the cities of tomorrow.
[MUSIC PLAYING]
The invention of automated vehicles is racing forward at the speed of Formula One. But we also need a magic formula to fit everything onto our city streets. City planners in Sweden are the first in the world to put firm plans in place for the future.
[MUSIC PLAYING]
City planners plan for the future. So how do they see autonomous vehicles becoming part of the way you get around? And how do they make sure they take to the streets smoothly, especially in historic cities?
MONICA WINCENTSON: As city planners, we realize that, around the world, there is a huge focus on developing the new technology for autonomous vehicles. But as yet, there has not been significant collaboration between city planners and car manufacturers. In order for autonomous vehicles to work well, we absolutely have to work together.
ASHLEY HOUSE: In order to map out the future of the city's streets, the planners are using the same world-class rendering 3D models used by Hollywood film makers to experiment and try out different ideas.
ERIC JEANSSON: There's one project that was very successful using this virtual model. Is a project concerning a cable car over Gota alv, the river in Gothenburg. Then we use the virtual model as a background, and then we have the cable car, the new cable car, the planned cable car. And we can use this model to show the citizens how the cable car should look like from different angles, from the ground, from different apartments, from windows. And you can actually make a tour on the gondola over the river.
ASHLEY HOUSE: The vision is that automated vehicles will flow smoothly around the city center, reducing congestion and CO2 emissions, and that traffic lights, road signs, and car parks will all become retro relics of the past, freeing up valuable space.
MONICA WINCENTSON: We think the benefits for the city will be safer and more secure transportation the flow of traffic will be more even, smooth, and efficient. And it could also free up space for green areas, playgrounds, meeting spaces, wider sidewalks, and bike lanes. And large parking areas that require a lot of space can be used in a better way.
ASHLEY HOUSE: It sounds idyllic, but can pedestrians remain safe crossing roads dominated by robots?
MONICA WINCENTSON: The safety for both pedestrians and passengers is important, and comprehensive testing of the technology is required. We will continue to have traffic regulations for vehicles and pedestrians. And from an urban perspective, it is desirable that separation and restrictions of movements are no worse than today, with fences, main roads, and similar barriers.
ASHLEY HOUSE: City planners are already test driving their plans. And in 2017, 100 self-driving Volvo cars took to the streets of Gothenburg. This was the biggest experiment of its kind in the history of the automated vehicle.
MONICA WINCENTSON: It's still early days, and we are currently making studies and do workshops together with the industry, academia, and test the interaction between autonomous vehicles and city planning. So we're working on it.
ASHLEY HOUSE: 100 cars operating automatically around Gothenburg city center. It may seem like a scene straight out of a sci-fi film, but soon, this is set to become a reality.
ERIC JEANSSON: If these vehicles are used right, it will not just make the individual travel options more attractive, but also mass transit. And this is one way to make the sustainability goals a reality.
ASHLEY HOUSE: Word on the street is that other major cities are already hot on the heels of Gothenburg. So it might not be long before incorporating automated vehicles into city plans will be as automatic as the vehicles themselves.
AFUA ADOM: What does the future hold for electric cars?
MALCOLM MCCULLOCH: Well, I think we're at an interesting point where I think we're at a tipping point for electric vehicles where, in the next two or three years, you're going to see a large amount of battery production coming online, which is going to make them really much cheaper.
AFUA ADOM: How can new technologies, such as automated vehicles, fit into old cities?
MALCOLM MCCULLOCH: Well, I think they actually can fit in quite well. Automated vehicles are really good at perceiving their surroundings. And actually, there are a lot of clues for them to pick up in older cities, so looking at buildings and the like. The real challenge is going to be to say, how do they interact with motorcycles, with bicycles, and with pedestrians, because quite often we use human cues when we interact with it. And that's where the challenge at the moment is, how do they pick up on those small micro cues, and then make their challenges. But in terms of old cities, it's absolutely fine.
AFUA ADOM: Say I'm the mayor of a city. How would you advise me to prioritize over the next 10 years to meet Paris Climate Change Agreement goals and to achieve zero-emission cities?
MALCOLM MCCULLOCH: So the first point that I would start with is to say, make your public transport really high quality and green it up. So one of the interesting things we found in Oxford is, soon as they put in hybrid electric vehicles for their buses, actually, we found that the passengers really preferred them because they were much smoother and actually provided a much more enjoyable ride. Secondly, I would start to look at considering zero-emission zones, but make them really small to start off with so people get used to the idea that one day they might have to go to a zero-emissions vehicle.
AFUA ADOM: So bikes, pedestrians, and electric vehicles only?
MALCOLM MCCULLOCH: Correct. And so, for instance, in Oxford, we're starting with a small section on the high street which is turning to a zero-emissions zone in the next year or two. And that then enables people to get ready to say, actually, what we now need to do-- when I make a decision for my next vehicle, I actually want to consider either a hybrid or an electric vehicle. And that gentle nudge transforms the way we think about what mobility should look like.
And actually, it's much more pleasant because we don't have the noxious fumes anymore. It's much quieter. And actually, often a lot more fun.
AFUA ADOM: What's your ideal vision for a transport in the city of tomorrow?
MALCOLM MCCULLOCH: Well, for the city of tomorrow, I would love to see a city that's redesigned, that's much more greener, where actually my preferred mode of transport is walking, and actually enjoying moving from one place to the other. And potentially, if I need to move longer distances, is to go in a quiet, clean transport, such as either electric bus or electric vehicles. But to me, it's about saying how do we improve our overall quality of life, and not just be stuck to the old ways of doing things, but to envisage something that's fun, healthy, and a lot more exciting.
AFUA ADOM: Malcolm, thank you so much for having us today.
MALCOLM MCCULLOCH: It's been a pleasure.
ASHLEY HOUSE: So after a century waiting for a major new mode of transport to arrive, inventors now are making up for lost time. And pretty soon, we'll be cutting emissions and journey times, traveling in automated vehicles gliding around perfectly planned streets. The future of mobility in the city of tomorrow looks bright.
AFUA ADOM: Next time, we'll look at mobility of energy. How important is it for our energy to be mobile? Can we source what we need locally? We check out developments in everything from batteries to tanks and outer space, keeping us all powered up.
ASHLEY HOUSE: And if you have any questions for our expert on the next episode of "Sustainable Energy," you can get them to us in all the usual ways at @CNBCEnergy using the hashtags #AskSE and #SustainableEnergy. But until next time, keep thinking green.
BOTH: Goodbye.
[MUSIC PLAYING]
Supplemental Reading on Mass Transit Strategies
- Rutsch, R, The Role of Public Transit in Sustainable Communities [264], Sustainable Community Development Code Research Monologue Series, The Rocky Mountain Land Use Institute, 2008
Summary & Activities
Summary & Activities
As 95% of transportation energy currently comes from petroleum, significant restructuring of the transportation sector would be required to reach sustainable operation in the future society. This is one of the areas where breakthrough in technologies are in the highest need, and success in research and implementation of those technologies in the nearest ten to fifteen years would dictate what vehicles the next generations will be driving. Strong reliance of vehicles on infrastructure of fuel supply makes the problem of transition to new transportation technologies even more complex. The activity in the end of this lesson touches upon some key technologies employed in zero-emission vehicles, which may or may not become a significant part of the future transportation system. You get a chance to explore this question on your own and make your prediction.
| Type | Assignment Directions | Submit To |
|---|---|---|
| Reading | Complete all necessary reading assigned in this lesson. | |
| Discussion |
Based on reading Penalosa, E., Role of Transport in Urban Development Policy [239], Federal Ministry for Economic Cooperation and Development, 2005 (see page 10.3). Formulate your vision of the sustainable urban community and share it on this lesson discussion forum. What are your most favorite and least favorite measures to undertake in order to modify the current transportation system? If you had a power of policymaking, what transportation model would you choose? Comment on at least one other post on the forum. Response to any questions asked to your posts. Deadline for initial posting: this Sunday, for comments: Wednesday. |
Canvas: Lesson 10 Discussion |
| Activity |
After reading sections 2.5 and 2.6 of the book, "Transitions to Alternative Vehicles and Fuels". Washington, DC: The National Academies Press, 2013. (see page 10.2 of this lesson), perform independent investigation and compare three transportation options listed below:
Imagine that you need to take a road trip from New York to Chicago (~800 miles), and based on that scenario, evaluate the above transportation options by the following metrics:
For this hypothetical case, you can assume that no maintenance is required to the cars during the trip (except for re-fueling/ re-charging). You can use approximated data as needed, but explain your assumptions. Present your numerical results in the table. Show your calculations. Provide a discussion to address the following question: Which type of electric vehicle in your opinion may have a better future – fuel cell or battery? Support your argument with some listed pros and cons and numbers. You can also say “both” or “neither” but provide proper argument. Make sure to provide proper citations for data sources. Please see more details in the Lesson 10 Activity Sheet posted on Canvas Deadline: Wednesday (before midnight). |
Canvas: Lesson 10 Activity |
References for Lesson 10:
Battery University, Is Lithium-ion the Ideal Battery?, 2010, URL [265], accessed 2014.
PCSD, President's Council on Sustainable Development, Sustainable Communities, Task Force Report, 1997.
Popovich, N. and Lu, D., The Most Detailed Map of Auto Emissions in America, The New York Times, Oct. 10, 2019. URL [249], accessed 4/3/2020
Rutsch, R, The Role of Public Transit in Sustainable Communities [264], Sustainable Community Development Code Research Monologue Series, The Rocky Mountain Land Use Institute, 2008.
Sierra Club, U.S. Oil Dependence Threatens Security, Economy, Environment [266], accessed July 2014.
UITP, Advancing Public Transport [267]; accessed 2014.
U.S. DOE, Transportation Fuels: The Future is Today, NEED 2007.
Lesson 11: Behavioral Aspects and Feedbacks
11.0 Overview
Overview
Analysis of sustainability systems requires broad knowledge of technologies that provide for the urgent needs of society. But, even more so, it requires well-balanced thinking that encompasses causal connections and factors both within and outside the apparent system boundary. How do we appropriately account for various environmental, economical, and social concerns? What strategy should we choose to promote sustainability ideas to society? Which technologies would be optimal for addressing local needs and building a sustainable market? All these and other questions are subject to decisions at the levels of policymaking, business development, and community development. In this lesson, we will study factors that influence human decision with respect to innovations and technology. In the end, we get to see that the human factor is a key leverage point that can control the dynamics of the whole sustainability system.
Learning Objectives
By the end of this lesson, you should be able to:
- identify the factors that affect human decisions with respect to innovation and technology;
- set up a framework for collaborative decision-making on a specific problem;
- articulate the fundamentals of the Diffusion of Innovation theory;
- analyze the role of the technologies in the dynamic feedback within the global sustainability context.
Readings
Business report: Network for Business Sustainability, Making Sustainable Choices. A Guide for Managers [268], 2012.
Website: Structural Decision Making [269], Compass Resource Management Ltd., 2014.
Journal article: Simpson, L., Community Informatics and Sustainability: Why Social Capital Matters [270], J. Community informatics, 1(2) (2005).
Book Chapter: Sterman, J.D., Sustaining Sustainability: Creating a Systems Science in a Fragmented Academy and Polarized World [271], in Sustainability Science: The Emerging Paradigm, Weinstein, M.P. and Turner, R.E. (Eds.), Springer Science+Business Media, LLC 2012.
Questions?
If you have any questions while working through this Lesson, please post them to our Message Board forum in Canvas. You can use that space any time to chat about course topics or to ask questions. While you are there, please feel free to post your own responses if you are able to help out a classmate.
11.1 Collaborative Decision Making
11.1 Collaborative Decision Making
The process of collaborative decision making is aimed at combining the input from all stakeholders and therefore at making the best choice from the standpoint of the objectivity. It is typical that decisions made by groups differ from those made by individuals. However, there is no clear indication that the group decisions are consistently better (or worse) than individual decisions. Also, collaborative decisions are apparently linked to group behaviors, interactions between members, role distribution, and psychological factors that can affect people's thinking.
The decisions regarding policies, economic actions, and assessments of alternatives for sustainable development especially require collaborative thinking due to the complexity and polarity of factors and interests involved. Design of the decision making process is therefore an important issue to learn for managers, policymakers, and experts involved in evaluation of business alternatives.
Study the following reading material based on the research of the Network for Business Sustainability (nbs.net), which examines the factors that steer people towards or away from sustainable choices.
Reading Assignment
- Network for Business Sustainability, Making Sustainable Choices. A Guide for Managers [268], 2012.
Focus questions in this reading:- - What is bias, and how it affects the individual decision? Why sustainability decisions are more subject to various biases than other decisions?
- - How do you understand the term intervention in sustainable decision making and what main types of interventions have been successful?
- - Can you define active supports and passive supports for sustainable decisions? Which ones do you think are more efficient?
Supplemental Reading
- "Sustainable Futures and the Status Quo [272]" The Guardian / 2014.
- "Sustainablity and Systemic Change Resistance [273]", Wikipedia / 2014.
The discussion forum in the end of this lesson will involve you in a self-evaluative exercise where you can try to recognize your own bias towards any theme in sustainability or related technology.
Structured Decision Making (SDM) methodology
Structured Decision Making (SDM) is a specially developed organized approach to making complex decisions. For example, when we face a choice of developing and implementing a new technology (versus an older status-quo technology), that is certainly considered a complex decision. Assuming that reaching high sustainability level is the focus of our decisions, technical feasibility, economic viability, environmental impact, and social impact are the main cornerstones of such an assessment, as we learned before. The SDM method is designed to organize information and direct the process of collaborative decision making towards the optimal solution, and helps to eliminate bias and find win-win scenarios if those exist. SDM was proved to be especially beneficial for the organizations that require transparency and efficient response to diverse public needs.
Please study the materials on the SDM website, referenced below, starting with SDM Overview [274], which explains in more details the purpose and structure of this method. Then proceed to the pages describing Steps [275] and Tools [276] used in the SDM analysis. Make sure to open the "Read More" links on those pages to study details.
Reading Assignment
-
Website: Structural Decision Making [269], Compass Resource Management Ltd., 2014.
In the end of this lesson, you will be asked to perform an activity related to the SDM framework.
11.2 Role of Community and Social Networking
11.2 Role of Community and Social Networking
Social networks, both inter-personal and virtual, are known to have a strong influence on people's life, behavior, and choices. This influence can take any direction, negative or positive, conservative or destructive, depending on the network dynamics and trends. Lately, significant attention has been paid to the opportunities related to the promotion of sustainable behaviors through social networks.
As was shown by some community models (Xu et al., 2012), physical and social networks within which residents are connected and influence one another via certain relationships tend to foster notable savings in community energy consumption. Interestingly, the interpersonal closeness between members in the community, identified as a place-affiliated network, was found to create leverage for encouraging energy conservation behavior. Based on this study, the primary spheres of the community network include integrated buildings, occupant social networks, and surrounding neighborhood facilities. The integrated energy efficient building infrastructure is shown to have the potential for 2.3-22.3% energy savings; however, a social network is noted as an even more powerful factor, resulting in additional 11.7-31.1% of energy savings, when energy awareness is promoted through the interpersonal relationships (Xu et al., 2012). Social encouragement is seen as a more cost-effective way to energy conservation than physical upgrades and renovations. The residents are seen to be motivated to conserve energy when they are aware if their neighbors and friends are changing in similar ways. The third sphere of the community network - surrounding neighborhood facilities - are shown to promote social networking and its benefits. These facilities provide additional channels for people to communicate, and also provide physical grounds for shared monitoring systems and shared appliances and services.
Similarly, the social networks may play an important role in the diffusion of innovative technologies. Diffusion of Innovation is a theory describing patterns of technology adoption to society and predicting whether a particular innovation can be successful or not (Rogers, 2003; Kautz, 1999). The theory emphasizes the process of communicating an innovation through various channels in a social system. The four key elements that influence the spread of a new technology or idea are (i) innovation, (ii) communication channels, (iii) time, and (iv) social system (Rogers, 2003). Rogers also identifies five main steps in the innovation adoption process; those steps are: awareness, interest, evaluation, trial, and adoption. Theoretical timeline of technology adoption is illustrated in Figure 11.1.

The Diffusion of Innovation theory puts the importance of the social networks and interpersonal channels above the mass media when it comes to adoption decisions, emphasizing several key agents - opinion leaders, electronic communications, social and organizational hierarchies - as triggers for change. There is an observation that people often evaluate a new idea based on the subjective recommendation by someone like themselves, who has evaluated and adopted that idea previously (Simpson, 2005).
The following article is a case study exploring the role of social involvement in the adoption of ideas of technology and sustainability. It provides an example of an application of the Diffusion of Innovation theory to rural communities in Australia.
Reading Assignment
- Journal article: Simpson, L., Community informatics and sustainability: Why social capital matters, [270] J. Community Informatics, 1(2) (2005).
Here are several interesting questions to focus on in this reading:- Not all members of social networks are regarded to be equal. There is a hierarchy, which sets apart influential leaders who can champion or reject the innovation and lead trends by example.
- Although transferable between different cultures and communities, innovations need to be connected to the local values, thus acquiring a special place and meaning.
- Critical mass of potential adopters needs to be reached before the rate of diffusion is accelerated, and the innovation becomes widely adopted in the community. This critical mass is estimated at ~10-25% and includes individuals classified as innovators and early adopters in Figure 11-1.
- Timeline for technology adoption (X-axis in Figure 11-1) is different for different cases of technology adoption and depends on the type of community and technology itself. What characteristics of technology do you think shorten or prolong the time of adoption?
- The time of diffusion of innovation is central to the sustainability analysis because it determines the delays in feedback loops in a sustainability system. Thus, identifying the factors that affect the technology adoption timeline can be directly connected to the dynamics of the sustainable society development. This issue is discussed further in Section 11.3.
Supplemental Reading
- Book: Rogers, E.M., Diffusion of Innovations, 5th Edition, Science, 576 p. (2003).
- Web: Wikipedia, Diffusion of Innovations [278]
11.3 Human Factor in Sustainability Paradigm
11.3 Human Factor in Sustainability Paradigm
In sustainability analysis, we are often reminded to broaden our view beyond the immediate boundaries of the problem and try to recognize the various forces that control the system, sometimes against our expectations. Thus, looking at a technological system, and being focused on the dynamics of the process and on the physical principles, it is easy to miss the human factor, which may be as powerful in the final success of the technology as its physical efficiency or economic benefit. Solar panels may be working and bring environmental and economic profits in some cases, but why do we still not have them on our roof? Human resistance has its causes, well justified, which are often left behind the scenes.
The following book chapter written by J.D. Sterman of MIT Sloan School of Management reflects on the intricacy of connections that surround the sustainability paradigm. The author picks a number of factors that are connected to human thinking and behavioral feedbacks. One of the surprising observations the author makes is how intuitive judgment of a situation, perception of benefit or urgency can sometimes be far off the reality.
Reading Assignment
-
Book Chapter: Sterman, J.D., Sustaining Sustainability: Creating a Systems Science in a Fragmented Academy and Polarized World, in Sustainability Science: The Emerging Paradigm, Weinstein, M.P. and Turner, R.E. (Eds.), Springer Science+Business Media, LLC 2012. (access via PSU Library: https://link-springer-com.ezaccess.libraries.psu.edu/chapter/10.1007/978-1-4614-3188-6_2 [279])
Because our particular focus in this course is on technologies, how they develop, and how they can impact the future being of society, please especially pay attention to the system analysis on pages 46-52 of the above-referenced chapter, which explains the balancing feedback loops created by technological innovation and markets. There is a discussion if those loops are powerful enough to "save the world", and, I think, it is a good point to reflect on. Spend some time examining the system diagram in Fig. 10 of the chapter. You may agree or disagree with the author on certain points, and maybe in that process you can find additional loops (not shown on the diagram) to provide leverage to the system survival.
On the other hand, solving the carrying capacity problem with new technology creates the condition for further growth, and further growth creates a problem with carrying capacity again. Solve the scarcity problem again through innovation and efficient markets, the system will grow again and create new scarcity. What follows from this logic is that we can solve the problem of available resources for earth population for some time, but we may not be able to keep solving it forever. Simply because the typical delays in technology development would not diminish, and innovations themselves will require more and more planet resources. On the other end of the dragon, intentional control of the growth may have some promise as a strategy to bring the technology and consumption to some kind of balance.
You can treat this reading as a recap of the sustainability issues discussed in this class. Technologies, methodologies, policies, economic models, and social trends are all building blocks of the bigger concept, and now we can look back to review the big picture and think how to put all those building blocks together. This effort would require a new type of thinking, personal and societal change – a task no less challenging than building a new technology. “To move beyond slogans, we need to develop our systems thinking capabilities, methods that avoid both self-defeating pessimism and mindless optimism, while remaining true to scientific methods and ecological realities.” (Sterman, 2012)
I hope that this discussion does not push you to the pessimistic side of the story, but rather urges you to develop more knowledge and insight into the real working mechanisms of sustainable development. While advocating for new technologies, we should also fully understand the limits of time and resources behind them and recognize other necessary leverage points, in particular, required social and behavioral adjustments.
Proper sustainability assessment should always strive to include systems analysis, which places a technology or subject matter into social context. Copy the Fig. 10 diagram for your reference - it may be a good baseline for system discussion of technology in your course project report.
Summary & Activities
Summary & Activities
We reached the end of Lesson 11, which explored some important social and behavioral factors affecting the development and adoption of new technologies. This process of adoption goes through several decision points - both at the business level (for example, through collaborative decision making) and at the community level (through social networking and hierarchies). Social networks are seen to grow in power with respect to how they can influence group decisions and trends. One important factor to emphasize at any stage is time. Timeline of technology development and adoption is directly linked to the delays in feedback loops, which control the dynamics of the whole sustainability cycle.
This lesson is the last one in this course, and it is capped with a discussion of the global system of connections and trends, in which technology has a definite leverage point. Through all the lessons, we reviewed and got some exercise with a few methods of technology assessment, which will be useful, hopefully, in your future professional practice.
This will be the end of our formal content for this class. You will spend the remaining time on finalizing your course project report, which is supposed to synthesize the ideas learned over these eleven weeks.
| Type | Assignment Directions | Submit To |
|---|---|---|
| Reading | Complete all necessary reading assigned in this lesson. | |
| Discussion |
After reading the lesson materials on page 11.1, engage in discussion on how individual bias often affect people's decisions. But how about starting with yourself? We all are biased in some way, and it often depends on our previous experience, asymmetry in our knowledge system, media, and various random factors. It is not easy to recognize your own bias, but this forum challenges you to try. For this forum:
Deadline: for initial posting - this Sunday; for comment to other posts - Wednesday night. |
Canvas: Lesson 11 Discussion |
| Activity |
Activity: Building an agenda for a decision making session Study the methodology of structured decision making (SDM) in section 11.1 of this lesson prior to doing this assignment. Imagine a scenario when you need to moderate a decision making session on a topic of sustainable technology implementation. The goal of this activity would be to create a plan for such a meeting based on the steps and tools described in the above-mentioned SDM method. The topic for this session should be a prospective technology of your interest, and the target for decision making would be choosing between existing alternatives. You may choose the same technology or subject that you have researched for your individual course project. When building the agenda, please incorporate the specifics of the particular technology into your plan. Some questions to answer:
In this assignment, you do not need to arrive at a justified decision, but simply set up a framework for a productive session. For more details, please see Lesson 11 Activity Sheet on Canvas Deadline: Wednesday (before midnight) - check specific due dates on Canvas calendar. |
Canvas: Lesson 11 Activity |
| Individual Course Project |
Reminder: The last week of the course is entirely reserved for Individual course project completion. The final report accounts for a major part of your course grade, so do your best putting together a high-quality document. The final report will be due a week after the end of Lesson 11. Good luck! |
Canvas: Lesson 12: Course Project |
Lesson 12: Course Project
12.0 Overview
12.0 Overview
This lesson pulls together all the information related to the development of the project proposal in EME 807, Technologies for Sustainability Systems. Even though we start to discuss the elements of the project early on in this course, and previous lessons have prompts for you to prepare and submit various pieces one by one, this Lesson is specially built to provide all the project directions in one place. It is not tied to a specific week of the semester. Whenever you need guidance on steps and content of the project or additional instructions on your milestone submissions, this is the place you go to!
Lesson 12 is essentially the Reference Guide for your course project preparation!
In EME 807 we are building the technology implementation proposal for a potential client in several stages so that you have time to test your ideas in the peer group and do some background research. This process is spread out over the course of the semester. It allows you to implement different skills and frameworks you learn in other lessons, and even use some of your prior lesson assignments as pieces of your project.
Questions?
If you have any questions while working through this Lesson, please post them to our Message Board forum in Canvas. You can use that space any time to chat about course topics or to ask questions. While you are there, please feel free to post your own responses if you are able to help out a classmate.
12.1 Goals and Milestones
12.1 Goals and Milestones
The course project is a significant part of learning in this course. In this process, you are set to perform a detailed evaluation of a specific technology, design, or approach, and, as the next step, you explore the path of this technology to implementation in a specific setting or locale.
For your project, you will need to pick a topic – a specific technology for assessment. Here, by technology, we mean a concept, a process to produce or convert something, design, approach, or a device. It should be relatively innovative and promising from your point of view. You can choose something from the area of your professional experience or a new area that you’d like to explore. The work you do on the project will surely push you to learn more about the topic you choose, so it is good to link it to your current or future professional interest.
There are two main objectives of the course project:
- Perform assessment of a particular type of technology in the sustainability context
- Develop a proposal for implementation of this technology at a specific locale
By locale, we mean the geographic location, but not only that! Location of the project will also dictate a variety of conditions, such as climate, terrain, available infrastructure, local market and economy, political situation, policy landscape, population, cultural aspects - all those things, in fact, will have a profound impact on how a specific technology is perceived by stakeholders and how effective its implementation may be. In other words, building and implementation of a project should always be specific to the locale to ensure maximum benefits and economic success.
To ensure successful technology implementation, you will need to look at your subject from different angles - technical performance, environmental impact, marketability, social impact - and recommend metrics for such evaluation. An important aspect of the project will be to apply your assessment to a specific setting and, based on your findings, propose an implementation scenario for your case.
The table below lists the key milestones for the EME 807 Course project development with submission requirements and the portion of the grade assigned for each step. The due dates for submissions are in Canvas; please look them up and plan ahead.
| Milestones | What should be submitted | % of total grade |
|---|---|---|
| Milestone 1: Selection of Topic |
Preliminary title of the project and one paragraph justification | 1% |
| Milestone 2: Project Outline |
PowerPoint Presentation (5-8 slides) with audio to present project ideas to the class (subject to peer review) | 5% |
| Milestone 3: Peer Reviews (2 outlines) |
Constructive commentary on 2 peers project outlines: ~1 page summary by set of rubrics | 4% |
| Milestone 4: Technical Review |
Comprehensive review on technical background and status of technology – written report (5-10 pages) | 15% |
| Milestone 5: Proposal Draft |
First draft of project proposal – written document with all required sections (optional) | |
| Final Project Proposal | Written final proposal of technology implementation (limit of 20 pages, total) | 25% |
Note: More guidance on these submissions is provided in the following sections of this Lesson.
12.2 Choosing a Topic
12.2 Choosing a Topic
As the first step (Milestone 1), you need to choose a particular technology for developing your assessment and implementation scenario. It should be relatively new and show promise for sustainable development. The topic can represent a specific manufacturing process, approach, device, design, or conversion system. You may want to choose something close to your professional area, as in that case, you will know better where to find information, technical data, technology status etc. However, it does not have to be in your professional area and can be just a topic of your special interest. In that case, you can use this project as a vehicle to develop your expertise in it.
Some generic examples of project topics can include:
- an innovative method for wastewater treatment
- a technology implemented in a high performance building
- an novel approach to grow food locally in urban environment
- a way to replace toxic chemicals in construction materials
- a technology to efficiently produce fuel from CO2
- a recyclable product design
- off-grid cheap power for displaced communities
These are just examples that should in no way limit your scope.
Frankly, you do not need to invent. Search up and pick an existing or developing technology and give it a thorough assessment to evaluate its promise. But remember that such an assessment would only make sense and have value when you tie it to a specific economic, social, and environmental context.
Always think where, when, and how this technology will be set to work.
Furthermore, you are encouraged to explore how your project topic and goals of your assessment line up versus the seventeen UN Sustainability Goals. When you submit the final version of your proposal, you will be asked to specifically reflect on those connections in the Introduction, but you can also include those ideas in your topic justification paragraph (your submission for Milestone 1).
Check how your project is related to the UN Sustainable Development Goals [281].
12.3 Presenting Your Project Idea
12.3 Presenting Your Project Idea
To present your project ideas to the class, you will need to develop an outline of your assessment and preliminary implementation idea and put it in a PowerPoint presentation that can be delivered to the class audience. This is Milestone 2 of the EME 807 project development.
Because it is quite challenging and time-consuming to have a synchronous session with all the presentations in the class, you are asked to supply your slides with audio commentary, which can be easily narrated in PowerPoint. It may work somewhat better than a video, as in the case of a narrated presentation you can listen to commentary separately for each slide and input your comments right in the file. If you have never done it, it is certainly a neat skill to learn. Please read more instructions at the bottom of this page.
Your Project Outline presentation should contain 5 to 8 slides, including information on the following:
- Preliminary title and your name (in lieu of a brief intro)
- Main subject: technology, process, or approach – what it is and what it does
- Motivation and goals for the project – why you are interested, what benefits are expected
- Current status of the chosen technology, examples of implementation, pilots (if any) and outcomes
- Plan for your assessment – what research / analysis is needed to put this project in place
- Preliminary implementation scenario: choice of facility, location, scale, potential client (this may not be yet finalized, but you can think of some possible options and let people comment)
Feel free to include some images in your presentation for better illustration.
The assessment plan may have a good amount of flexibility. Think about what particular aspects of the technology should matter most in your case of implementation. For example, you may choose to put a heavier focus on the socio-economic side or go deeper into the environmental impact assessment if you feel that it is best for project justification. Some scenarios would benefit from comparing to the baseline technology case to demonstrate the benefits of the new implementation.
All submitted presentations will be shared within the class, and each will be subject to peer review by your classmates. As well, as you will have an opportunity to review a couple of other outlines and provide constructive feedback. More explanation of the peer-review process is given on the next page of this lesson.
Instructions for how to narrate your presentation in PowerPoint, 2016
Microsoft PowerPoint has the capability to add narration to your slides, which will be suitable for our presentation purposes. It is best if you use a headset microphone, but most built-in mics now also provide a decent quality of sound.
- In the top menu, go to "Slide Show" >> "Record Slide Show"
- On the little dialog box, click "Start Recording"
- As the presentation starts, talk over the first slide. You can pause the recording by clicking the pause button in the top left corner control pane.
- If you need to quit recording and start all over again, press “Esc” (it will still keep the recorded audio up to that point)
- While recording, click on the slide or press “Enter” to advance to the next slide. Proceed until you reach the last slide. Pressing “Enter” will stop your recording
- Run your presentation in Slide Show mode to check how it sounds
Note: If you start recording again, it will start from the first slide and will overwrite your previous speech, so if you want to edit audio in a specific slide, copy and paste that slide to a new file and re-record it there and then paste it back to the original presentation.
When you are done recording, you have two options for saving your presentation:
(1) PowerPoint file - this produces a relatively small file, which you can add as an attachment to your post in Canvas. People will need to download the file to their computer to hear the audio.
(2) MPEG-4 video - this produces a relatively big file. You will have to upload it to a video sharing platform (such as YouTube) and then share the link to your video at the Canvas forum. Please do not attach the video file to your post - that will force people to download it to their computer, which we try to avoid.
12.4 Peer Reviews of Project Outlines
12.4 Peer Reviews of Project Outlines
The main idea of the peer review process is to collect constructive feedback on your ideas and assessment plans, as well as to learn from what other people do for the project. The list of who will be reviewing whom will be sent to the class once all the presentations have been submitted. Typically, you are assigned to review at least 2 other projects.
Here is what we are looking for in peer reviews:
- Express your opinion on the importance of the topic chosen (is the technology promising, potentially transformative, suitable for that area?)
- Comment on the proposed plan of assessment (is it feasible; is anything important missing; is there something that can be skipped since it is already well known or irrelevant; is it too wide or too narrow?)
- Provide some constructive suggestions. (Where do you think the main focus of the project should be; what would increase the value of this assessment?)
- Explore the topic yourself a little and recommend some resources that may be helpful to the author in your opinion: you can include links, references, videos, or just information you know;
- Ask questions! If something needs clarification or if you want to challenge any ideas, ask.
All that said, try to be helpful and valuable, not just critical. But it is appropriate to provide critique if you feel it will help people to improve their project. Note that peer-review is more than just a general comment (like we do on a discussion forum) -- think of making a contribution to project quality.
Compose your review in the form of a letter to the author. For example, you can start as:
Dear <Author's Name>,
It was a pleasure to listen to your presentation on <...topic...>. Below are my comments, which I hope you will find helpful...
Further, you will need to structure your review summary by the above-listed rubric.
Please email your Review directly to the author and also upload it to the Canvas Dropbox for the instructor to assess.
Note that you may need to download the presentation files from Canvas to your computer to hear the audio in PowerPoint.
12.5 Preparing the Technical Review
12.5 Preparing the Technical Review
Milestone 4 of the project preparation process is the technical review. This task involves first of all the evaluation of the technology status – where it is with respect to technical performance, how far it is from meeting market and society requirements. This stage of your project will probably involve the reading of some research papers and other documents explaining the technical background and performance criteria. At this stage, you should present your findings about the technology readiness level (TRL – see methodology in Lesson 2). Learning details about the technological process, materials used, efficiency will also become useful in subsequent environmental and economic assessment.
This review can be as deep and as broad as you deem appropriate for your case study. But you can omit the information that is too specialized for being used in project justification.
Things to include in the Technical Review
- Technical principles (how this approach or technology works)
- Schematics and images as appropriate
- Any relevant scientific information
- Technology readiness (TRL) and cases of success or failure trials
- History of development and prospects for the future
- References
While you are welcome to use any literature and online sources to collect information, the review should be your original writing. And do not forget to cite your sources. The prepared review will further serve as your resource to pull information from for your final technology implementation proposal.
Check this out: CSE Citation Style
This PSU library resource provides guidance and examples on how to cite your sources in technical papers.
CSE Quick Citation Guide [282]
Please pay special attention to citing Web sources, and what information to include, since, understandably, you will do most of your research online!
12.6 Final Proposal Preparation
12.6 Final Proposal Preparation
The technology implementation proposal is prepared in two steps: Pre-Proposal (Milestone 5) and Final Proposal (except for the Summer version of this course, which is more compact and therefore skips the Pre-Proposal stage).
At the Pre-Proposal stage, you put together all elements of your assessment and implementation ideas in the form of a written paper. At this point, it may still look like an extended outline with sections partially developed, and some material still in the works. However, the Pre-Proposal document needs to have the final structure and include all the required elements.
The key sections to include in the proposal:
- Title page - it should include your name, project title, course number (EME 807), year. At the bottom of your title page, please include the icons of the UN sustainability goals (up to 3) that are specifically addressed by your project.
- Executive summary (1 page, to be added for the Final submission) – it should deliver your proposed idea in a concise and compelling way and present the main findings. Executive summary is a "snapshot" of your entire project, rather than a preface to the introduction. It should be readable as a separate document.
- Introduction – Explain what this project is about, what problem it solves, what the motivation and goals are, and where it would be implemented. This would be a good place to tie your project idea to the UN Sustainable Development Goals, as well as local and State sustainability targets.
- Proposed Implementation Scenario - Provide information on the locale, facility, or community where this project would be implemented. This is where you can express your reasoning why utilizing this particular technology is a good idea and how you envision it.
- Technical background - Select the most relevant technical information that supports your implementation idea. (Do not simply copy the entire Technical Review here, as it may be too bulky and distract the reader from the main ideas of the proposal).
- Environmental assessment – Discuss both positive or negative impacts of the project, present a few key metrics to evaluate those impacts. If appropriate, you can present some elements of LCA. (Note that performing a full-scale LCA would not be feasible within the proposal limits and would probably make your message too bulky and less compelling).
- Economic analysis – Present any relevant cost information and other metrics to demonstrate economic viability or challenges for the project. Elements of cash flow analysis can be included if appropriate. You can tap into online resources to understand the costs of related materials and services.
- Social impacts - Think of a few social metrics that may be important to consider for your proposed locale. How would the project benefit the community and how it may impact the local life level and culture.
- Conclusion – Present a strong closing statement with your recommendation for the implementation of the chosen technology. Re-iterate the most important findings and comment on how the goals set up front have been met. Do not underestimate the power of this section - some reviewers read the Conclusion first!
- References – Include the full list of citations for the sources used to build your proposal. Be sure to use the professional citation style (especially for web references - URL is not enough!)
On the general note, when preparing your proposal, think about a potential client you are writing it for. It is not the most comprehensive but most compelling proposal that wins. Also be specific – tie your analysis to a specific locale – clearly, implementing a certain technology in the US, or Africa or Australia may have very different effects, promise, and final outcomes.
If at the Pre-Proposal stage, your document still misses some of the information, that is okay, but leave space holders and mark them as, for example, “more information on the environmental impact of this material will be included here,” etc. The Pre-Proposal document will be reviewed by the Instructor and you will have a chance to make changes for the final submission based on that feedback.
Your Final Proposal, which is submitted during the last week of the semester, should be an originally written document that summarizes your investigation of a chosen technology and your implementation scenario. It will be evaluated based on a number of criteria, including idea justification, clear articulation of the social, economic, and environmental benefits, implementation scenario and final recommendations. See final project rubric for more info on how the projects are graded.
12.7 Style Recommendations
12.7 Style Recommendations
During the preparation of the course project, you will have to deal with two types of technical writing, which will be principally different in style, purpose, and content.
Type 1: Technical Report
This type involves articulation of comprehensive technical information on an issue, technology, or application. The style is more of a technical paper with lots of details and graphical material, references, and the scope will be rather broad. The purpose of technical reports is to collect versatile information on an issue in one place, present it logically and fully, and make it available for further use by scientists, engineers, government representatives, businessmen, entrepreneurs, the public, and other interested parties. Technical reports may present really large volumes of information from multiple sources, and typically, the broader the view, and the more different aspects and angles of the subject matter are discussed, the better! Technical reports are extremely useful when you try to research and learn as much as possible about a specific topic. The examples of technical reports are commonly available (free or for a charge) on the websites of Government agencies such as DOE, NREL, EPA, etc. [EXAMPLE Technical Report [283]], and many commercial companies also produce such reports for their internal R&D efforts.
Type 2: Project Proposal
This type of writing should include ONLY the information that justifies the implementation of the proposed idea. The style will be geared towards a reader – a client, a reviewer, an authority, an investor, a committee, or the public – anyone who would have to make a go/no-go decision on the project. Here, any technical excursions should be articulated in a way to convince the client of the project idea (not to confuse them) or to justify an investment. The primary purpose of this kind of writing should be to deliver the idea clearly, quickly, and in the most compelling way. That would not mean the most comprehensive or most scientific way, but rather via the structure and narrative most accessible and appealing to a particular "client." In this case, including more information is not always good and can even be bad in terms of clarity and focus of your narrative. For project proposals (even in scientific and academic fields), the technical justification is much more compact, and more effort is spent on highlighting the competencies and capabilities of the proposer, and justification of expected outcomes. The language in a proposal is usually geared towards a broader audience, with fewer area-specific terms and slang, to make sure the message is understandable to a wide range of stakeholders.
These two types of writing can be parts of the same investigation. For example, a technical report can be prepared to justify project development and investigate technology alternatives. At the same time, the project proposal will deal with narrowing down the focus and transferring the knowledge into the implementation stage.
These two types of writing should not be mixed up, though. If you are writing a technical report, you are dealing with a broad variety of factual data and need to make sure that every description or key statement has justification and references. You can go broad and deep without yet knowing which of that information will be ultimately needed. You do not have to convince anyone of anything, but rather build a resource and sometimes provide objective recommendations based on your research. On the contrary, if you are writing a project proposal, you should focus on the client and how they would read it and understand your information. If you overload them with technicalities and present ALL of your great research, chances are they will lose focus and will not appreciate the idea you are trying to deliver in the long run. Here, a concise and compelling presentation most often wins over a sophisticated and scientific one. If there is information that is interesting and relevant to the topic but does not directly “sell” your ideas to the client, maybe it’d rather be omitted not to become a distraction. Sometimes less is more, but you need to make a careful call here not to become too plain and too simplistic in your message, either.
When working on this course project, we exercise both types of writing style for different milestones.
Make sure that the style and content of those different written pieces are tailored to their purpose.
Your Technical Review should be prepared in the style of a technical report (Type 1). You should feel free to collect any information that helps you to learn the topic and present the key findings without reservation. However, the Technical Review will only serve as a resource, an informational depository for the project proposal to pull data from, and in no way should it be presented as an organic chapter in the final proposal as is.
Your Final Proposal should be prepared in the Type 2 style, obviously. The assessment you perform should not be just a class exercise, but rather should justify the project implementation in the specific societal context. Introduction and Conclusion sections should speak of that purpose in particular, since, as you know, most proposal reviewers with their busy schedules will read those sections first and then see if they want to go on and read the rest.
Use of Graphics
Use of graphic information, such as images, plots, maps, schematics, charts, tables, etc. is highly encouraged. I agree with a common statement that often a picture is worth a thousand words. Representation of your findings or background information in the figure helps organize it, summarize it, and to make it an easier reference. Also, it increases the credibility of your proposal and makes it easier to read, especially since most of us are visual learners.
However, there are a few things about figures to keep in mind. First, please be sure that the graphics you present are indeed relevant and actually serve the purpose of making your message clearer rather than vague. Pictures should not be just placeholders (they can be on a website, but not in a technical proposal) – they need to have a good load of useful information. Second, quality is essential. Nothing irritates the reader more than a copy/pasted blurry image with a barely readable font. If you cannot get a good-quality image to use, better include none. Third, provide a caption. Ideally, the figure in a technical document should be readable independently of the text, at least at first approximation, so provide a short but informative title under the image of what it is that you are showing. And also if you include it, the text narrative should refer to it and use it in the story. The same tips go for tables.
A few words about image credits. These days, millions of pictures are available from the internet, and they are easy to borrow. Many of those images you find are in fact subject to copyright, meaning that you cannot use them publicly without permission. This is important to keep in mind if you think of publishing or distributing your work in any way. So I recommend two things:
- Create your own graphics – it is fun and makes you better understand the information you present (and you also earn extra credit for this in the final proposal!).
- Provide credit for any borrowed graphics in your reports (this should include the author/organization that owns the image and URL you got it from). In case your report ever goes public, you will be able to track it back to the source and work out any permissions you need.
Page limit and formatting
Please follow these format requirements when preparing your final document for submission:
- Font: size 12 pt / any professional font of your choice
- Spacing: at least 1.5 (except for reference list)
- Page limit: 20 including graphics and references (over-limit papers will be returned for re-formatting)
- Title page (including project title, author's name, year, SDG icons for the goals addressed)
- Figures and Tables should be numerated for easy reference.
- Figure captions: under the figure / Table captions: above the table.
12.8 Grading Rubric for the Final Proposal
12.8 Grading Rubric for the Final Proposal
In EME 807, the course project activities will account for 50% of the total course grade. 30% of those 50 will be distributed over the preliminary submissions (topic description, outline, and technical review). The other 20% of the total 50 will be assigned to the final report, which will be graded independently as a final document. The following grading rubric will be used for grading the final report (based on 100 pt. scale):
| Grading Criteria | Low Grade (pt. range) | Medium Grade (pt. range) | High Grade (pt. range) |
|---|---|---|---|
| Title Page (total 5 pts.) | 0-3 pts No title page / No SDG / Title does not reflect the topic of the proposal. |
4 pts Title needs to be more descriptive. |
5 pts Title is descriptive, page includes SDG icons, author's name, class number. |
| Executive Summary (total 5 pts.) | 0-2 pts No executive summary / Summary is vague or does not present the topic well. |
3-4 pts Executive summary is similar to introduction, and does not present any findings / Summary is too short or too long |
5 pts Executive summary is descriptive and serves as a snapshot of the entire project / 1 page length. |
| Introduction (total 10 pts.) | 0-3 pts No introduction section / Introduction does not provide a clear reference to the technology to be assessed or goals of the implementation / References are missing. |
4-7 pts Introduction sets the context for the project, but the motivation and goals need to be better defined / Need a stronger argument for the "why" question |
8-10 pts Introduction clearly describes motivation and goals for technology implementation / Connection is made to the local sustainability goals as well as UN SDG / Sources are properly cited. |
| Implementation Scenario (total 10 pts.) | 0-3 pts No separate section describing implementation scenario/ It is unclear where (location) and how the project would be implemented. |
4-7 pts The scenario may need to clarify the steps for implementation / additional information may be needed for the "where" and "how" questions / stakeholders are not clearly defined. |
8-10 pts Implementation scenario is clear regarding the project scale, stakeholders, and resources. It is tied to a specific locale and takes into account the local need or the problem identified in the introduction. |
| Technical Background (total 10 pts.) | 0-3 pts Description of the technology is missing or poorly presents the underlying principles / Reader is unable to understand how the technology works. |
4-7 pts Acceptable presentation of the purpose of the assessed technology / Some technical aspects may need to be illustrated or supported by references / Section may be too long and information is excessive. |
8-10 pts Very clear presentation of the technical principles and the purpose of the assessed technology, supported by sufficient technical data / Appropriate graphics are included. |
| Environmental Impact Assessment (total 10 pts.) | 0-3 pts Environmental impact assessment is too general and does not use any metrics. |
4-7 pts Assessment is adequate but misses important metrics to show the technology impact / Metrics are defined, but no data shown for a real case scenario / Comparison to the baseline technology should be used where appropriate. |
8-10 pts Environmental impact assessment clearly defines metrics and taps into real-life data. Both positive and negative impacts are taken into consideration. The assessment has a clear reference to a baseline. |
| Economic Assessment (total 10 pts.) | 0-3 pts Economic viability or role of the technology is not well defined or not applied to any specific practical or hypothetical case / Cost information is not presented. |
4-7 pts Basic economic analysis is presented / Assessment is too generic and misses some local specifics / Comparison to the baseline should be further discussed. |
8-10 pts Economic analysis uses several metrics to justify the project at a certain locale / Both direct costs and environmental costs are compared for the proposed implementation and the baseline. |
| Social and Broader Impacts (total 10 pts.) | 0-3 pts Social impacts are not explicitly discussed / Broader impacts are identified but need more supporting data. |
4-7 pts Social impacts are discussed, but may not be linked to the specific case scenario at a locale / Metrics should be used more to compare the proposed scenario to the baseline. |
8-10 pts Both positive impacts and barriers are identified in the assessment / Broader (systemic) impacts are discussed, and interconnections between the societal, environmental, and economic values are well demonstrated. |
| Conclusion (total 10 pts.) | 0-3 pts Conclusion is absent or is not very well related to the assessment presented / Conclusion contradicts the assessment results. |
4-7 pts Proper conclusion is presented, although it ignores some key points and outcomes of the presented assessment / Recommendation for the technology implementation is poorly justified or undecisive |
8-10 pts Conclusion statement is rooted in the preformed analysis, provides strong closure to the proposal, and includes a clear recommendation for the project. |
| Style and Presentation (total 10 pts.) | 0-3 pts Text is difficult to read, confusing, or poorly organized / Some sections are missing / Goals of the project are not logically connected to the assessment / Text formatting and graphic quality issues. |
4-7 pts The proposal is logically organized and easy to navigate / Goals are clearly stated and tied to the proposed ideas / The argument presented may not sufficiently conclusive or deep to justify the proposal / Technical edits are recommended to improve the quality of text and graphics. |
8-10 pts The proposal provides a strong case supported by assessment results / The text is logically organized and contains all the required sections / Visual graphic tools are properly used to enhance delivery / The proposal is sized appropriately and is not overloaded. |
| References (total 10 pts.) | 0-3 pts Too few information sources are used / Lack of citations makes the assessment speculative / Random formatting / Missing credits. |
4-7 pts References are provided in the text and are in correspondence to the list / Some missing citations and credits / Reference format should be improved or unified for better presentation. |
8-10 pts A variety of sources searched to support the assessment / Citations and credits are included for all graphics and data sources / Citations are properly formatted according to the APA style. |
| Graphics (extra credit up to 3 pts.) | Inclusion of originally prepared graphics – plots, flow diagrams, tables - to organize data and to improve the delivery of the proposed ideas is highly encouraged. Clarity of visual tools makes difference in evaluation of reports and proposals and helps communicate information to stakeholders at all levels. | ||
12.9 Summary
12.9 Summary
This Lesson 12 is an essential guide on how Course Project is developed in EME 807. I hope it clarified the path for you and answered some of your questions on where to start and how to proceed.
Overall, the project proposal activities in this course are seen as strong motivators for students to develop a number of important transferable skills that will benefit them in their future careers. Some of those skills are:
- Searching and critically assessing information (research)
- Compiling and citing information sources (both printed and online)
- Delivering “pitch” presentation / recording presentation for online delivery
- Technical report writing
- Critical review of written and verbal communications
- Combining various types of data (technical, economic, etc.) in higher-level analysis
| Type | Assignment Directions | Submit To |
|---|---|---|
| Individual Course Project |
The final report accounts for a major part of your course grade, so do your best putting together a high-quality document. The final report is due at the end of Lesson 12. Good luck! |
Canvas: Lesson 12: Course Project |
You have done it all. Congratulations! I hope you found this process rewarding and are ready to build on it! Best of luck with your future endeavors!