Lesson 8: Applied Renewable Energy Technologies
8.0 Overview
Overview
In Lesson 8, we will overview several renewable energy technologies that are currently considered the main players of the future sustainable energy economy. It would not be realistic to cover all technical details of these technologies within one lesson, and this is not our goal here. Your main focus in this lesson should be to grasp the basic idea of how these technologies operate, how their performance is compared to conventional energy options and to each other, and what is the promise. In the end of this lesson, you will be asked to perform an activity on the comparison of some energy technologies by several metrics that are relevant in sustainability analysis. Some examples of metric calculations and some technology applications are also included in this lesson.
Learning Objectives
By the end of this lesson, you should be able to:
- articulate the fundamentals of the key alternative energy technologies;
- understand standard metrics for analyzing and comparing alternative energy technologies.
Readings
You will be asked to read the following sources throughout the lesson. Please excuse the large number of readings – renewable energy is an extremely versatile area to cover. Some of these sources are concise and contain introductory information that will not require too much time to work through.
Website: Christiana Honsberg and Stuart Bowden, PV-Education.org [1]
Web article: "Solar Thermal Power Plants. Technology Fundamentals [2]," Renewable Energy World, 06/2003, pp. 109-113.
Web article: How Geothermal Energy Works [3]”, UCS, 4/1/2014
Book chapter: F.M. Vanek and L.D. Albright, Energy Systems Engineering. Evaluation and Implementation, McGraw Hill, 2008 – Chapter 12 Wind Energy Systems, pp. 331-366.
NREL Report: R. Thresher, M. Robinson, P. Veers, Wind Energy Technology: Current Status and R&D Future, [4] NREL, 2008.
EPA Report: Biomass Combined Heat and Power Catalog of Technologies [5], U. S. Environmental Protection Agency, Combined Heat and Power Partnership, September 2007. Chapter 5: Biomass Conversion Technologies, pp. 30-61.
Web article: "Environmental Impacts of Renewable Energy Technologies [6]," Union of Concerned Scientists, 4/26/2014
Questions?
If you have any questions while working through this Lesson, please post them to our Message Board forum in Canvas. You can use that space any time to chat about course topics or to ask questions. While you are there, please feel free to post your own responses if you are able to help out a classmate.
8.1 Renewable Energy Basics
8.1 Renewable Energy Basics
Renewable energy has been a catchphrase of recent decades. It has been both the subject of government policies and extensive research. We are searching for efficient ways to move from the easily accessible but finite fossil fuel energy to other types of energy available on earth that are either unlimited or can be replenished within a much shorter timescale.
We have one lesson to review this topic. This does not allow us to go anywhere in depth while discussing specific technologies, but we will take some time to consider a few examples of how the renewable energy technologies are chosen, implemented, and assessed from the sustainability standpoint.
The term renewable essentially means that the energy source is not exhaustible on a human timescale. This, however, does not always mean that it has infinite capacity or constancy. We will see that different sources of renewable energy have different limitations, which must be taken into account when tuning the technologies to a particular application and locale.
The main types of renewable energy resources are schematically summarized below:
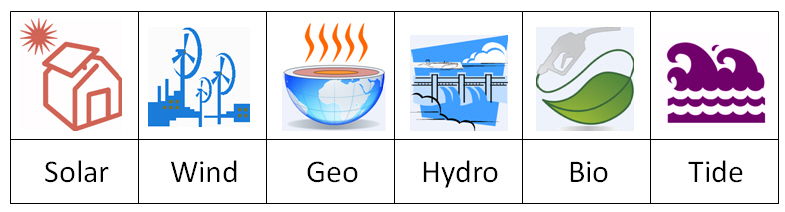
The technologies that are designed to convert the above kinds of available natural energy to usable power or heat are expected to play significant roles in future energy economy. However, markets involving those technologies are still developing, and at the moment it is not so easy to predict which of them will become most prominent.
I am sure you are somewhat familiar with the operating principles of these technological systems. You may be still curious to look through the Renewable Energy Wikipedia article [7] to refresh your basic knowledge on those types of energy conversion. Consider this as an optional resource unless you feel you have serious background gaps to fill.
Because we will be going through some numerical examples involving energy, it would be also useful to have a refresher on terms and units.
Quick refresher on energy terms and units
Energy is the capacity of a system to perform work. Energy is also an extensive quantity, measured by amount. Thus, you need a certain amount of energy to perform a certain work. Energy can be added, subtracted, converted from one form to another, but it cannot be created or destroyed according to energy conservation law.
Units to measure energy:
- Joule (J) - International SI system. Convention: 1 J is the amount of energy necessary to move an object over 1 meter against the force of 1 newton.
Joule = Newton x meter = Pascal x meter3 = Watt x second - British Thermal Units (btu) - used in fuel and thermal applications. Convention: 1 btu is the amount of energy necessary to heat 1 pound of water by 1 degree Fahrenheit. 1 btu = 1055 J
- Kilowatt-hours (kWh) - used in electricity. Convention: 1 kWh is the amount of energy being transmitted with the power of 1 kW over 1 hour
1 kWh = 3600 kJ
Power is the amount of work performed per unit of time. Power can be understood as the rate of energy conversion.
Units to measure power:
Watt (W) = Joule / second
Often, the energy converting systems are rated by power.
For example:
40 W light bulb - it means it consumes 40 Joules of electric energy per second;
250 W solar panel - it produces 250 joules of electric energy per second (under standard conditions), which converts to 6 kWh per day;
20 MW wind farm - it generates 20 MJ of electric energy per second or 20 MWh per hour (at maximum operation load).
Role of energy technologies in sustainability
Since energy is the main commodity ensuring well-being and sustainability of human society, the role of energy technologies is critical. The efficiency with which we can convert and distribute energy essentially determines our standard of living. Speaking the systems language, sustainability would require maintaining the stock of usable energy at the demand level. Consider the system diagram in Figure 8.2.
The main goal of the sustainability system shown above is to keep up the usable energy stock, as it is closely connected to the amount of demanded services and products for society. These two stocks are related through the energy utilization rate.
To make sure the society demand is met, the energy supply rate (left-hand valve) should match the energy utilization rate (right-hand valve). It is this supply valve where energy conversion technologies play the major role. The energy is supplied from a source (which we can assume to be unlimited, e.g., sun energy); however, the conversion rate of the available energy from the source to the usable energy will be the main limiting factor. Conversion rate will depend on technology efficiency, system size, and will be affected by environmental conditions at a particular locale.
So, what can be done to maximize the energy conversion rate at the supply valve?
- Maximize efficiency. This depends on the stage of the technology development, physics of the process, materials, design, and other things that may be improved through research and development efforts.
- Scale-up the conversion system. Feasibility of this measure may be limited by technology cost and available space or land area (to accommodate the equipment, etc.)
- Tune technology to local source and conditions. Local conditions will dictate the adequate choice of technology to employ (obviously, solar energy is great where there is a lot of sun, and wind energy option would be suitable to the places that are windy). Also, system design should be adapted to the geometry and timing of the natural resource – such supplemental technologies as tracking and energy storage help increase the overall conversion.
All the above factors shown on the diagram will affect the energy conversion rate.
While we can identify the factors that maximize the conversion and enhance the system’s function, the system may be not resilient until there is a return balancing loop. One of such loops (shown by dashed line on the system diagram in Figure 8.2) shows the investment of the energy generation revenue into creation of new energy conversion systems. This feedback has been more strongly established over the past decade, but it can be also driven to one side or the other by government incentives and social factors. Furthermore, wider implementation of the renewable energy conversion systems will result in an increase of renewable energy supply and higher energy stock for consumers.
Establishment of this system will eventually ensure renewable energy economy; however, this process is still hampered by strong economic competition from the non-renewable energy worldwide, which is currently in a dominating position by scale, profit, and infrastructure development in a number of major players - e.g. China, United States, Russia.
This is only one slice of the quite complex “tug-of-war” issue of commercialization of the renewable energy. It is anticipated that recent advances in research and development will be able to increase the energy conversion efficiency and thereby further upgrade its market value. The technical status of several prospective energy technologies is reviewed in the following sections.
8.2. Building Integrated Solar Energy Technologies
8.2. Building Integrated Solar Energy Technologies
Solar energy conversion is a large topic. The key technologies to mention here include:
- Photovoltaics (PV, optoelectronic systems) - convert solar visible radiation into electricity;
- Concentrating Solar Power (CSP, solar thermal, or optocaloric systems) - convert solar thermal radiation into electricity;
- Solar heating systems - utilize solar heat (concentrated or not) without conversion.
You can learn these technologies in depth, taking some of the courses in the Solar Energy Option of RESS. Here in this lesson, we will turn to one of the application examples of PV technology to study the factors that affect the practical implementation of solar panels in buildings. But before doing that, let us review the basic principles by which photovoltaic systems operate.
PV Basics
Photovoltaic (PV) technology is one of the ways to convert solar resource into usable energy - specifically sunlight to electricity. Photovoltaic conversion is enabled by certain semiconductor materials, which have a property to generate electric current when they absorb incident photons. The physics of the photovoltaic effect can be schematically envisioned as three step process [Brownson, 2014]:
- absorption of light;
- generation of charge carriers (electrons and holes);
- separation of charge carriers (so that they can perform work).
This effect is physically realized in certain semiconductor materials - for example, monocrystalline silicon, polycrystalline silicon, amorphous silicon, cadmium telluride, and copper indium gallium selenide/sulfide and some others, all of which can be potentially used for making the PV cells.
Watch This Video as an introduction to PV cell technology and the photovoltaic effect.
This first short video (2 min) provides an animated illustration of the photovoltaic effect:
Video: Energy 101: Solar PV (2:00)
All right, we all know that the sun's energy creates heat and light. But it can also be converted to make electricity-- and lots of it. One technology is called Solar Photovoltaics, or PV for short. You've probably seen PV panels around for years, but recent advancements have greatly improved their efficiency and electrical output. Enough energy from the sun hits the Earth every hour to power the planet for an entire year. Here's how it works.
You see, sunlight is made up of tiny packets of energy called photons. These photons radiate out from the sun and about 93 million miles later, they collide with a semiconductor on a solar panel here on earth. It all happens at the speed of light. Take a closer look and you can see the panel is made up of several individual cells, each with a positive and a negative layer, which create an electric field. It works something like a battery. So, the photons strike the cell, and their energy frees some electrons in the semiconductor material. The electrons create an electric current, which is harnessed by wires connected to the positive and negative sides of the cell. The electricity created is multiplied by the number of cells in each panel and the number of panels in each solar array.
Combined, a solar array can make a lot of electricity for your home or business. This rooftop solar array powers this home. And the array on top of this warehouse creates enough electricity for about 1,000 homes. OK, there are some obvious advantages to solar PV technology. It produces clean energy. It has no emissions, no moving parts. It doesn't make any noise, and it doesn't need water or fossil fuels to produce power. And it can be located right where the power is needed, in the middle of nowhere. Or it can be tied into the power grid. Solar PV is growing fast, and it can play a big role in America's clean energy economy, anywhere the sun shines.
Next, let us gather some more details on the structure, functions, parameters of the photovoltaic materials.
Reading Assignment:
The PVEducation website [1] is very good articulating many technical aspects of photovoltaic systems. Although we do not intend to study the PV physics here in detail, definitely bookmark this website as a useful resource.
Spend no more than 1 hour browsing through this website and self-learn or refresh the PV technology background.
PV Application in Buildings
Current applications of solar photovoltaics are adapted to the following scales:
- portable (small electronics - e.g., calculators, computers, etc.);
- distributed power generation (homes, isolated equipment);
- utility scale power (solar farms).
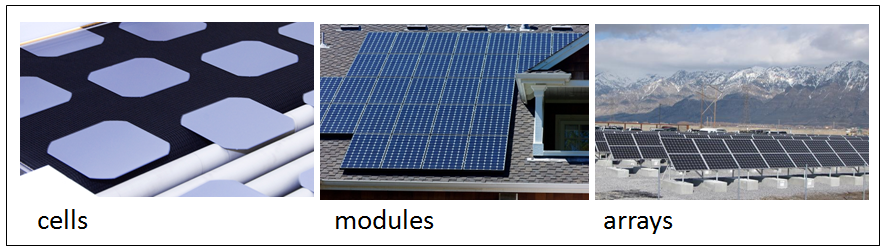
In the scale-up process, the single PV cells are combined to modules, and modules can be arranged into arrays:
In this lesson, we choose one of the applications – the building integrated photovoltaics (BIPV) – for more detailed consideration as an interesting example of sustainable technology implementation.
The building-integrated photovoltaics (BIPV) are multifunctional materials that are both structure-supporting and power-generating at the same time. There are some advantages and challenges associated with this technology, which are summarized in table below:
| Advantages | Challenges |
|---|---|
| Lower cost due to multi-functional nature of materials and due to more efficient design. Currently, PV contributes 0.5% to national energy demand; DOE expects it to reach 50% (!) with BIPV implemented. | System orientation, weatherability, durability are the factors that affect the system performance. Those parameters may be not easy to optimize if it is BIPV rather than add-on PV. |
| Improved aesthetics: panels are produced as facade lining, roof tiles, slates, shingles, windows (glazing, etc.). | BIPV modules can be heavier than regular building elements. Because of potential overload, new building standards and codes need to be in places to regulate this integration. |
| Thin-film PV can be applied directly to conventional building materials because the flexible and light. | BIPV modules are costly compared to regular add-on PV due to their multifunctional value, but that is not always recognized. BIPV is not mass-produced, but rather custom made, and that adds to the price. |
| Social acceptance: not many see long-term value because PV technology is thought to be soon outdated. There should be more acceptance from contractors and end-users alike. |

While the main function of a conventional PV system is efficient power generation, the building integrated PV systems, which become the components of the building envelope must satisfy a number of additional requirements, such as:
- appearance: color, image, size;
- weather-tightness;
- wind loading;
- durability and maintenance;
- safety during construction and in use (fire, electrical, structure stability);
- cost.
Reading Assignment:
Report: Building Integrated Photovoltaics: An Emerging Market [10], Greentech Media Inc., 2010.
This review summarizes factors affecting the market of the BIPV technology, related policies, and its promise.
In order to address all the necessary factors, the PV integration should be discussed early in the beginning of the design process. There are following PV integration options [Robert and Guariento, 2009]:
(a) Shading systems
These include louvers, either horizontal or vertical, which may be mounted outside the building over windows or balconies. Their function is to shade the windows from excessive light. The main issue with these structures is to make them resistant to wind load and easily accessible for maintenance. These subscreens can be made adjustable to maximize the sunlight gain.
(b) Rainscreen systems
Cladding panels can be used to protect the load-bearing external walls from rain water (especially masonry and concrete). PV panels can perform the function of such cladding and tiles. These structures are usually vertical. The ventilated cavity between the exterior cladding and the main wall help keep down the operating temperature of PV cells, enhancing their performance and provide space for cables. PV rain screens have moderate power output due to vertical orientation.
(c) Stick-system curtain walls
Curtain walls are used in those buildings that have internal columns or structural steel to support the main loads. Curtain walls are not weight-bearing and their main function is to resist air and moisture infiltration; also, building insulation is often attached to them (warm facade). A popular solution is to build the curtain walls from aluminum and steel framing filled with glass panels. PV panels can be sealed into curtain wall structures in both vision area or opaque area of the facade instead of regular glass.
(d) Unitized curtain walls
The unitized wall segments are pre-assembled at a factory and then are delivered to the building site. The controlled industrial environment provides more precision and quality for sealing the PV panels into the wall framework and making cable connections.
(e) Double-skin facades
Glass facades are often designed as "double-skin", i.e., when there is significant air space between the internal and external glass walls. This helps to reduce heat transfer losses through the walls. PV modules can be readily integrated into the external facade. Ventilation through the double-skin structure provides valuable cooling on the back of the panels.
(f) Atria and canopies
For the highest performance, PV are best integrated into horizontal or tilted elements, such as atria and canopies. These structures are usually free from overshadowing and are easy to ventilate. However, these structures may be more prone to heat transfer losses compared to plain opaque or insulated.
Supplemental Reading on BIPV technology:
Book: Robert, S. and Guariento, N., Building Integrated Photovoltaics. A Handbook [11], Birkhauser Verlag AG, 2009.
This handbook on BIPV technology (available online through PSU library) provides many details that are beyond the capacity of this course. If you have specific interest in this area of technology, you may find this book a useful resource.
NREL Report: Eiffert, P., Kiss, G.J., Building-Integrated Photovoltaic Designs for Commercial and Institutional Structure [12]s [13]" NREL, 2000
This report contains multiple examples of BIPV design, which complement the description of this technology.
Lifecycle Considerations
One of the main reasons why solar PV systems are being developed is their potential to replace fossil fuel combustion in power generation. While economically, fossil fuels are proved to be profitable, there is a sustainability concern (coal, oil, and gas will run out eventually) and there is an environmental concern (combustion pollutes and contributes to the greenhouse effect on earth). The solar PV can potentially address both of these concerns.
Because, unlike fossil fuels, solar energy is virtually unlimited, PV seems to be a perfect solution from the standpoint of energy sustainability. (Sunlight will not run out any time soon).
From the standpoint of environmental protection, the main question is whether or not the environmental benefit of reducing CO2 emissions achieved through the use of the solar systems will offset the impact of possible toxic emissions from the manufacturing of the solar modules and potential land pollution from the disposal of those systems at the end of their lifetime.
Let us make some rough estimations of the environmental benefit of PV technology. Consider the following example.
Example
Question: How much CO2 emissions will be mitigated by employing PV for electric power generation?
The European Photovoltaic Industry Association predicted that by 2030 the implemented PV units will be able to produce 2,646 TWh of electricity annually worldwide. This roughly accounts for 9% of the total population's needs.
Imagine this amount of energy to be produced by burning coal instead:
The general reaction of carbon combustion is: C(coal) + O2 = CO2
We know that the average coal energy content is ~24 MJ/kg.
We also know that the average efficiency of coal-fired power plants is ~33%, so, roughly, we need three times as much energy generated by coal combustion for obtaining the specified amount of electric energy:
Energy by combustion = Target electric energy / 0.33
To unify the units, convert the global PV energy to joules: 2,646 TWh = 9.53 × 10¹⁸ J
So, the energy we would need to generate through coal combustion is:
9.53 × 10¹⁸ J / 0.33 = 2.89 × 10¹⁹ J
Now, we can find how much coal we need to generate this amount of energy by dividing the amount of energy by coal energy content:
Amount of coal needed = 2.89 × 10¹⁹ J / 24 × 106 J = 1.2 × 10¹² kg (=1200 million ton)
Now, based on the assumed 95% content of carbon in the coal (let us consider anthracite coal), we calculate the amount of pure carbon burnt in the process:
1.2 × 1012 × 0.95 = 1.14 × 10¹² kg C
Because for each mole of carbon in the coal, there is 1 mole of CO2 produced, we can find the amount of CO2, taking into account the molar masses of the components – C 12 g/mol and CO2 44 g/mol, as follows:
Amount of CO2 released = 1.14 × 1012 kg × (44/12) = 4.18 × 10¹² kg CO2 (= 4180 Tg CO2)
This quite substantial mass of CO2 will not be released to the atmosphere due to the operation of the PV systems around the world. Let us compare this number to the total global CO2 emissions, currently estimated at 31,350 Tg CO2 [IEA Statistics, 2012]
4,180 / 31,350 × 100% = 13.3%
This is the fraction of CO2 emissions that would be prevented due to employment of PV technology (if it is employed as predicted by the European Photovoltaic Industry Association).
We should also remember that PV is only one of the promising renewable technologies on the list. All of those technologies are locale-sensitive and therefore will complement each other in global power generation. Localization of technologies by resource would also help reduce energy expenditures and emissions from transportation.
The above example demonstrates the scale of the benefit. Now, let us look at the other side of the medal. The accelerated growth of PV system manufacturing and use will have to become a major market and also should have infrastructure for maintenance and disposal of vast amount of PV-related components. While PV panels are considered are relatively durable with a long projected service life, high volume annual turnover of such systems can be expected. Here, we can do another estimation exercise.
Example
Questions:
- How many solar panels would be needed in the fossil fuel free economy?
- How many panels would need to be replaced and disposed off each year?
Precise analysis is hardly possible, since we cannot predict the market trends and know for sure which renewable technologies will be major in the distant future. So, we just create a hypothetical case with a few assumptions:
Assumption 1: There are no more fossil fuels left, so all energy has to come from renewable sources.
Assumption 2: Global energy demand is split evenly among the six major technologies: solar PV, solar thermal, wind, geothermal, hydro-power, and biomass. This is probably unrealistic, but let us take it as a starting point for simplicity. In this case, PV power generation has to cover 1/6 of the total energy demand.
Assumption 3: The total global energy demand is 13 TW of power (this is currently estimated value, which we will use in this example): 13 TW → 4.1 × 10²⁰ J (per year)
Then, the fraction of energy that has to come from PV is:
1/6 × 4.1 × 1020 = 6.833 × 10¹⁹ J (per year)
Let us consider 250 W silicon monocrystalline panels (64 x 39 x 1.57 in size; 44 lb (20 kg) in weight) as the main functional unit for this estimation.
If the panels are installed at a favorable location, we can take the measured output of 1200 kWh per kW of capacity per year. This is a typical output factor for the locations with favorable insolation [Vanek and Albright, 2008]. To explain this a little better: the nominal capacity of the solar system (250 W in this case) indicates the system output at full insolation; but the system does not operate at full insolation all the time (due to varying sun position and seasons). So, instead of the theoretically possible maximum output of 2190 kWh, the system produces only 1200 kWh per year. This value can be empirically estimated and is termed “regional factor”.
Then, we can find how much energy this panel will produce per year:
1200 (kWh/kW) x 0.25 kW = 300 kWh (= 1.08 × 10⁹ J)
Finally, we divide the total energy demand by the unit panel output to find # panels:
Number of panels required = 6.833 × 10¹⁹ J / 1.08 × 10⁹ J = 6.327 × 10¹⁰
63 billion panels (!) is many, but if we divide this number by current living population (~ 7.7 billion), we get 8.2 panels per person, which seems quite reasonable.
To answer the second question, let us make the following assumption:
Assumption 4: The panel lifetime is assumed to be 50 years.
In this case, 1/50 of all panels will need to be replaced each year:
63/50 = 1.26 billion panels
If all this decommissioned equipment is simply disposed off, the total volume of waste generated per year will range up to 8.1 × 10⁷ m3. If this waste in deposited in 20 m high dump, it would cover the area of 4.05 km2. (That means, the dump will cover the area of my home town in 9 years.)
The above-illustrated issue of waste disposal associated with the proliferation of the current PV technology calls for further development of solar cell design. The following improvements will be needed:
- development of thin, low volume solar elements;
- increasing efficiency of energy conversion to minimize the size of systems;
- designing cells for recyclable turn-over and conservation of valuable materials;
- using low-toxicity chemicals and materials in manufacturing;
- creating infrastructure for lifecycle management.
8.3. Solar Thermal Electric Power Generation
8.3. Solar Thermal Electric Power Generation
Solar thermal technologies are designed to convert the incident solar radiation into usable heat. The process of solar heat conversion implies using energy collectors - the specially designed mirrors, lenses, heat exchangers, which would concentrate the radiant energy from the sun and transfer it to a carrier fluid. The fluid passes through the sunlight collector and becomes very hot. Typical heat carrier fluids are water/steam, oil, or molten salt. Then the fluid is transferred to the heat engine, which converts the heat to electricity.
Please watch the following video, which provides an illustration of this technology.
Video: Energy 101: Concentrating Solar Power (2:16)
Ok. Take the natural heat from the sun. Reflect it against a mirror. Focus all of that heat on one area. Send it through a power system. And you've got a renewable way of making electricity. It's called concentrating solar power or CSP. Now, there are many types of CSP technologies: towers, dishes, linear mirrors, and troughs. Ok, have a look at this parabolic trough system. Parabolic troughs are large mirrors shaped like a giant U. These troughs are connected together in long lines and will track the sun throughout the day. When the sun's heat is reflected off the mirror, the curved shape sends most of that reflected heat onto a receiver. The receiver tube is filled with the fluid, and it could be oil, molten salt, something that holds the heat well. Basically, this super hot liquid heats water in this thing called a heat exchanger. And the water turns to steam. Now, the steam is sent off to a turbine and, from there, it's business as usual inside a power plant. A steam turbine spins a generator and the generator makes electricity. Once the fluid transfers its heat, it's recycled and used over and over. And the steam is also cooled, condensed, and recycled again and again. One big advantage of these trough systems is that the heated fluid can be stored and used later to keep making electricity when the sun isn't shining. Sunny skies and hot temperatures make the southwest, U.S. an ideal place for these kinds of power plants. Many concentrated solar power plants could be built within the next several years. And a single plant can generate 250 megawatts or more, which is enough to power about 90,000 homes. That's a lot of electricity to meet America's power needs.
There are several different kinds of solar collectors, which are described below. These collectors are only functional with the direct beam of sunlight and would also benefit from sun tracking - the technology that keeps the reflectors at an optimal angle to the sun.
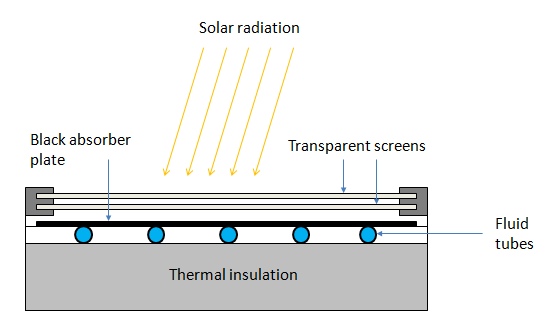
Flat plate collectors
Flat plate collector is the simplest technology of this kind, which is typically used for reaching temperatures usually no more than 100 degrees above ambient.
Concentrating collectors
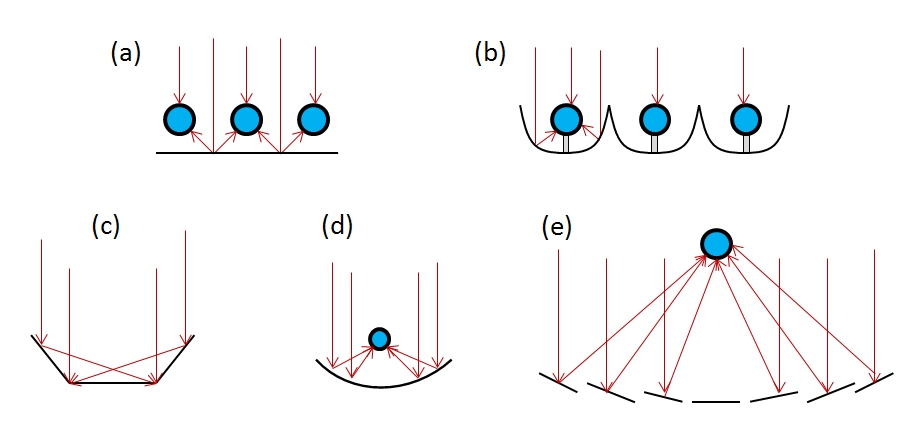
The above collectors are combined to a bigger energy conversion system. The larger scale solar thermal systems have higher efficiency than small systems.
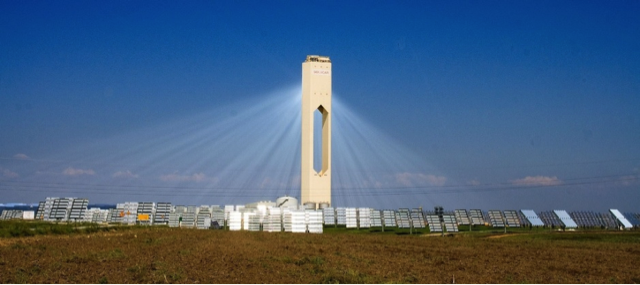
The utility scale solar thermal systems include the following designs:
- linear reflectors (heating temperatures ~280 oC);
- parabolic trough (heating temperatures ~400 oC);
- dish / engine systems (heating temperatures ~650 oC);
- solar tower (heating temperatures ~>1000 oC).
Please refer to the following reading to learn more details about the solar thermal technologies.
Reading Assignment:
Solar Thermal Power Plants. Technology Fundamentals [2], Renewable Energy World, 06/2003, pp. 109-113.
This article explains the fundamentals of CSP well, but it already became obsolete in terms of technology commercialization. For example, it mentions that there are no commercial solar tower plants, but actually there are now. Here, I include the list of operating Solar Thermal Power Stations available on Wikipedia page [16], which indicates the capacity of the plants, their location, and technology used.
8.4. Utility Scale Geothermal Energy Systems
8.4. Utility Scale Geothermal Energy Systems
There is a vast amount of heat contained by the earth interior. This internal heat is mainly comprised of the residual heat of planetary accretion and radioactive heat (from radioactive element decay). The hottest part of the earth is the core, a big part of which is in molten state. Heat radiates and gets transferred from the core to the outer layers of the planet by interior fluids and melts. The general geothermal profile of the earth (Figure 8.6) provides an idea of the scale of the thermal resource and the gradual change of the earth temperature at different depths. Because the earth structure is not uniform, heat is more readily transferred in some zones than in others. High heat transfer is usually associated with fracture zones and major faults, which are often located at the boundaries of tectonic plates.
The temperature change rate with depth depends on the density and thermal conductivity of rocks. Subdivision of the earth structure into layers is made according to the rock composition and rheological properties, so we see that the thermal profile within each layer can be quite different. The drastic change in temperature pattern around the boundary between the lower mantle and outer core is apparently related to the transition of the molten state.
The heat flux within the crust (the thin top layer) is highly variable due to the existence of large unified fragments of the crust (plates) divided by plate boundaries, the more mobile zones, where plates collide, spread out, or move relative to one another. Increased mobility of the plate boundary zones may cause creation of faults of various depth, which favor heat transfer to the surface. If you want more background about plate tectonic theory, you will be able to find a lot of resource on the web. For example, An Introduction to Plate Tectonics [18] provides a nice and concise illustrated introduction to this whole idea.
There are a number of technologies that help convert the thermal flux and hydrothermal waters to usable energy. Next, we will refer to the following reading to learn how these technologies work.
Reading Assignment:
“How Geothermal Energy Works [3]”, UCS, 4/1/2014
The following short video (5 min) provides an additional illustration of a utility scale geothermal plant.
Video: How a Geothermal Plant Works (4:45)
Welcome to one of CalEnergy's geothermal power plants. Unlike other power plants that rely on coal or other fossil fuels to create electricity for homes and businesses, geothermal power plants use superheated fluids from the Earth's geothermal resources to generate electricity. The natural heat of the Earth creates geothermal resources. This heat comes from molten rock called magma, located at the Earth's core deep below the geothermal resource. Over thousands of years, rainwater seeps through cracks in the Earth's surface and collects in underground reservoirs. The magma heats the water until it becomes a superheated fluid. To reach the superheated fluid, wells are drilled 5,000 to 10,000 feet below the surface of the Earth. These wells, called production wells, bring the superheated fluid to the Earth's surface where it can be used to generate electricity for homes and businesses.
This geothermal power plant uses crystallizer-reactor clarifier technology-- a process that turns the geothermal superheated fluid into steam, while removing solids from it. The steam is used to drive a turbine and generate electricity. All remaining geothermal fluids are injected back into the reservoir for reuse. Under its own pressure, superheated fluid from the geothermal resource flows naturally to the surface through production wells. As the liquid flows toward the surface, the pressure decreases, causing a small portion of the fluid still within the well to separate, or flash into steam. At the surface, the superheated fluid and steam mixture flows through surface pipelines and into a wellhead separator. Inside the separator, the pressure of the superheated fluid is reduced. This causes a large amount of the superheated fluid to rapidly vaporize and flash into high-pressure steam. The geothermal fluid that is not flashed into steam in the wellhead separator flows to a second vessel, called a standard-pressure crystallizer, where an additional amount of standard pressure steam is produced. The flash process continues in the low-pressure crystallizer. The remaining fluid is again flashed, this time at a lower pressure, to produce low-pressure steam. All of the low-pressure, standard-pressure, and high-pressure steam is delivered to a turbine. The fluid that is not flashed into steam flows into the reactor clarifier system and is then returned to the geothermal reservoir through injection wells. Turbines are the primary piece of equipment used to transform geothermal energy into mechanical energy. Pressurized steam created from the geothermal superheated fluid flows through pipelines to large steam turbines. The force and energy in the steam is used to spin the turbine blades. The turbines turn a shaft directly connected to an electrical generator. An electrical charge is created when magnets rotate within the generator. Large copper bars carry the electrical charge to a step-up transformer outside the plant. Within the transformer, the voltage is increased before the power is sent to the power lines that carry it to homes and businesses.
Geothermal energy is a sustainable resource because with proper management, a geothermal resource can remain a renewable source of energy. Water trapped deep within the Earth will naturally replace the superheated fluid that is drawn from the geothermal resource through surface wells. However, it is possible to deplete the geothermal resource by removing fluid faster than it can be naturally replaced. To help prevent this, the steam used in the geothermal power plant passes through a condenser that turns it back into fluid. At this stage, it's possible to recover minerals from the geothermal fluid before it's injected back into the Earth. This condensed fluid, along with a fluid that did not flash to steam, is injected back into the underground reservoir. Magma naturally reheats the fluid, so it can be used again.
While geothermal energy seems to be another unlimited and “free” energy resource, effective conversion of that energy and power distribution incur substantial costs. From economic evaluations, utility scale geothermal and natural gas power plants are comparable in overall cost, but only in the long term. Significant up-front expenditures for construction of the energy facility are much higher for the geothermal plant.
8.5. Wind Energy Applications and Technologies
8.5. Wind Energy Applications and Technologies
Wind energy is primarily used for power generation. Wind power conversion systems have been increasingly employed in the U.S., Europe, India, and more sparingly in some other locations over the last decade, due to the development of technology that allows relatively high efficiency of the wind resource conversion. The key process is the conversion of the kinetic energy of moving air into the mechanical kinetic energy of the rotating shaft of the turbine. Similar to solar energy resource, one of the main challenges with wind power is its intermittence and high variability, which requires systematic adjustments in operation as well as strategies to integrate the wind power into the grid.
Video: Energy 101: Wind Turbines (2:16)
We've all seen those creaky old windmills on farms and, although they may seem about as low tech as you can get, those old windmills are the predecessors for new modern wind turbines that generate electricity. The same wind that used to pump water for cattle is now turning giant wind turbines to power cities and homes. Have a look at this wind farm in the California desert. A hot desert next to tall mountains. An ideal place for a lot of wind. Here's another one on the windy prairies of Wyoming. Now, today's wind turbines are much more complicated machines than the old prairie windmills, but the principle is the same. Both capture the wind's energy. Ok.
Here's how it works. First, a wind turbine blade works sort of like an airplane wing. Blowing air passes around both sides of the blade. The shape of the blade causes the air pressure to be uneven, higher on one side of the blade and lower on the other. And that's what makes it spin. The uneven pressure causes the blades to spin around the center of the turbine. On the top, there's a weather vane that's connected to a computer to keep the turbine turned into the wind, so it captures the most energy. Now, the blades are attached to a shaft which only turns about 18 revolutions a minute. And that's not nearly fast enough to generate electricity by itself. So, the rotor shaft spins a series of gears that increase the rotation up to about 1,800 revolutions per minute. And at that speed, a generator can produce a lot of electricity.
So, why are wind turbines so tall? Well, the higher up you go, the windier it is. More wind naturally means more electricity. And in many cases, larger turbines can also capture wind energy more efficiently. The blades can sweep a circle in the sky as long as a football field. Now, what's really cool is that even a small wind farm, like this one in Wyoming, can generate enough electricity to power more than 9,000 homes. And larger farms can provide much more clean energy for our homes and businesses.
Please refer to the following reading source for learning about wind energy systems below.
Reading Assignment:
Book chapter: F.M. Vanek and L.D. Albright, Energy Systems Engineering: Evaluation and Implementation, McGraw Hill, 2008 – Chapter 12 Wind Energy Systems, pp. 331-366. (See E-Reserves in Canvas.)
This chapter contains sufficient background on the topic, including global perspective of the technology, some technical details and performance parameters, and economic insight. Here, our goal is to understand the main characteristics of the system (both technical and economic) that can be useful for technology evaluation.
Focus Questions
Read pages 331-348 more carefully; you can just scan through the rest of the chapter. (We will not dig into the turbine design since it is beyond the scope of this course). While reading, try to spot the answers to the following questions:
- How is wind resource measured?
- How can we estimate the average wind speed at a particular locale?
- How do we estimate the available power of wind?
- What are the most favorable and least favorable wind conditions for high efficiency wind power conversion?
- Can you explain the meaning of capacity factor of a wind turbine?
Energy return on investment (EROI)
EROI is a common metric applied to the energy conversion systems. It is defined as the ratio of the lifetime usable energy generated by the system to the energy spent for the system manufacturing, operation, maintenance, and disposal. Obviously, EROI = 1 would mean that over its lifetime a system produces as much energy as has been consumed for its creation and operation. Such a situation would indicate very low feasibility.
For wind turbines, the typical estimate of the EROI is in the range from 5 to 35, depending on the type of system. This indicator significantly increases with the size of the turbine rotor. The latest generation large-scale turbines yield EROI values about 35 and higher (Kubiszewski et al., 2010).
Status of technology
The wind power generation systems have been commercialized for several decades now. The efficiency and durability of the systems was improved over time. So, recent developments explain the growing interest in wind energy and observed growth of wind energy market. Read more on the status of this technology in the NREL report:
Reading Assignment:
NREL Report: R. Thresher, M. Robinson, P. Veers, Wind Energy Technology: Current Status and R&D Future [4], NREL, 2008.
Economic aspects
Economic analysis of renewable energy systems mainly focuses on the ability of the system to pay back the initial investment and operation costs within a reasonable period of time.
The lifetime cost of the wind energy system can be split into the (i) initial cost for system manufacturing and installation, (ii) operating and maintenance cost, and (iii) decommission cost.
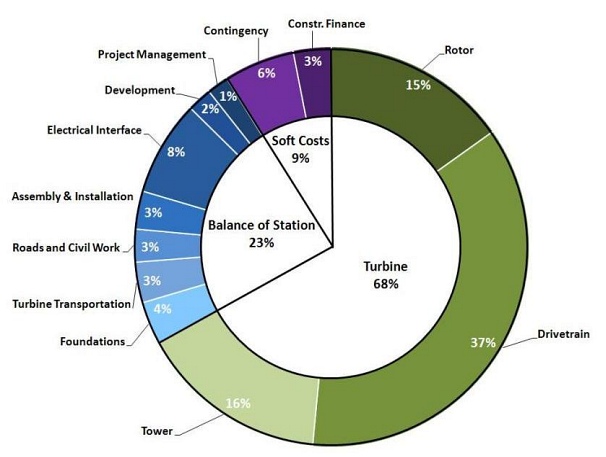
The initial upfront cost of wind energy system is usually the highest (~75%) and typically includes turbine (including rotor, tower, drivetrain), foundation, land rent, electrical equipment, connection to the grid, road construction and other infrastructure, transportation, installation labor and expertise, and associated soft costs (Figure 8.5).
Operating and maintenance costs are relatively low, especially that there is no fuel cost involved.
| per kW capacity | total for 1.5 MW turbine system | |
|---|---|---|
| Capital cost | $2,098 | $3,147,000 |
| Annual operating cost | $35 | $52,500 |
| Lifetime cost (25 years) | $2,973 | $4,459,500 |
Taking into account the typical costs listed in Table 8.2, one can perform a standard cost analysis to find out how long would it take for the wind system to pay back investments. Feasibility would depend on the lifetime of the system itself and how it compares to the payback period. Please refer to the example below, which tries to examine this question
Example:
Consider a simple payback estimate example here:
Question: What would be a simple payback time for a 1.5 MW wind turbine that produces annually 4,800 MWh of electricity (net generation)? Use the capital cost and annual operating cost from Table 8.2.
First, we can express the lifetime cost of the 1.5 MW system as:
Total cost = $3,147,000 + n x 52,500
where n is the number of years. Note, we are ignoring the salvage value or decommission cost in this example.
We assume that the facility is able to sell the electricity at a realistic average price of $0.05/kWh. (In reality, the market price for wind-generated power can vary). So, the total revenue generated through electricity sales will be:
Total revenue = 4,800 MWh/year x n years x 0.05 $/kWh = 240,000n
Then, simple payback time can be found by solving for n the balance equation between the total cost and total revenue:
3,147,000 + 52,500n = 240,000n
n = 16.78 years - will be necessary to cover the investment. This time is roughly 1/2 the lifetime of the turbine system.
The payback can be reached sooner if we consider a premium some customers would pay for purchasing "green" electricity. At the same time, if there is an interest rate on the initial investment (MARR), it will extend the payback period.
As a rule, the small-scale residential wind energy system have longer payback period, because they typically operate at less favorable wind conditions; so the capacity factors are usually lower (~10%) than that for the commercial utility scale wind systems (~30%)
More information on wind energy economics and costs can be found in the following reading (which is optional for this lesson):
Supplemental Reading on Wind Energy Economics and Costs:
- S. Tegen, E. Lantz, M. Hand, B. Maples, A. Smith, and P. Schwabe, 2011 Cost of Wind Energy Review [22], NREL (2011).
8.6. Bio-mass Fueled Combined Heat and Power Systems
8.6. Bio-mass Fueled Combined Heat and Power Systems

Biomass as a source of fuel has been part of the global energy economy throughout human history. Using biomass as fuel (via combustion) may help solve the fuel supply issue, since biomass is renewable, but does not help solve the global carbon emission and pollution problem: burning biomass produces CO, CO2, NOx, and other gases at the levels exceeding those from traditional fossil fuels (e.g., oil, gas).
Indirect utilization of biomass implies the production of various biofuels (for example, ethanol), which can be converted to energy in a cleaner way. Types of biomass currently on market and ways to produce them are well described in the Biomass Wikipedia [27] article
Biomass combined heat and power (CHP)
Biomass-fueled CHP or cogeneration is one of the applied technologies developed as a cost-effective method of energy recovery. Because the by-product heat generated in electricity generation is not wasted, but rather utilized as thermal energy, the total efficiency of such systems reaches 60-80%.
There are three main stages in the biomass-fueled CHP process:
- biomass collection and preparation
- biomass conversion: (i) to steam or (ii) to biogas
- power and heat generation
These three stages are integrated in one installation.
The following bio resources are considered for energy recovery:
- energy crops and crop residues
- forest residues and wood waste
- manure biogas and wastewater treatment biogas
- food processing residue
- municipal solid waste (MSW)
- landfill gas
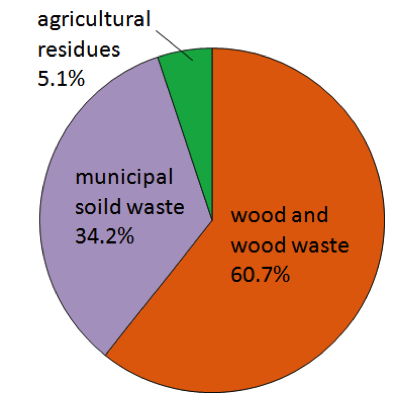
Wood products currently make up the dominating stock in U.S. (Figure 8.8).
These different biomass resources require somewhat different approaches to the collection, storage, and conversion. In brief, there are two main categories of biomass conversion systems, as outlined in the table below:
| Direct-Fired Systems | Gasification Systems | |
|---|---|---|
| Process and Output | burning biomass in a boiler to produce high pressure steam | decomposing biomass to produce gaseous fuel - syngas |
| Feed | bark, chips, sawdust, end cuts - wide variety of fuels | shipped wood, rice hulls, shells, sewage sludge, wood residues |
| Output | high pressure steam | syngas fuel |
| Capacity | up to 300 MW | up to 50 MW |
| Notes | Direct-fired systems perform combustion of the solid biomass and produce hot flue gases that heat the boiler. This technology is dated back to 19th century. There are many different kinds of boilers, based on configuration, size, quality of steam. The two most common types of boilers are stockers and fluidized bed boilers. Boiler size is often measured in terms of fuel input in MMBtu per hours. Biomass fuels can be combusted separately in boilers or co-fired with coal and other conventional fuels. [US EPA, 2007] | "Biomass gasification involves heating solid biomass in an oxygen-starved environment to produce low or medium calorific gas. Depending on the carbon and hydrogen content of the biomass and the gasifier’s properties, the heating value of the syngas, can range from 100 to 500 Btu/cubic foot (10 to 50 percent that of natural gas)." The main combustible components of syngas are CO and hydrogen, and the main incombustible component is CO2. Biomass gasification offers certain advantages over directly burning the biomass because the gas can be cleaned and filtered to remove problem chemical compounds before it is burned. Gasification can also be accomplished using chemicals or biologic action (e.g., anaerobic digestion); however, thermal gasification is currently the only commercial or near commercial option." [US EPA, 2007 ] |
Chapter 5 of the EPA report on CHP biomass technology provides a good amount of technical details as for how these conversion methods work.
Reading assignment:
EPA Report: Biomass Combined Heat and Power Catalog of Technologies [5], U. S. Environmental Protection Agency, Combined Heat and Power Partnership, September 2007. Chapter 5: Biomass Conversion Technologies, pp. 30-61.
While reading, try to find answers to the following questions:
- What are basic technical principles of the direct-fired and gasification biomass conversion systems?
- How do these systems compare in size and efficiency?
- What is fluidized bed technology? How is it different from the fixed bed system and what advantages does it offer?
- What biomass conversion systems are most cost-effective?
Commercialization status
Biomass is used in the original solid form or can be gasified or converted to liquid fuels. There are a number of commercialized and emerging technologies to foster that conversion (Tables 8.4 and 8.5).
| Energy Conversion Technology | Conversion Technology Commercialization Status | Integrated CHP Technology (Prime Mover) | Prime Mover Commercialization Status |
|---|---|---|---|
| Anaerobic Digestion | |||
| Anaerobic digester (from animal feeding operations or wastewater treatment facilities) | Commercial technology | Internal combustion engine | Commercial technology |
| Microturbine | Commercial technology | ||
| Gas turbine | Commercial technology | ||
| Fuel cell | Commercial introduction | ||
| Stirling engine | Emerging | ||
| Direct Combustion - Boilers | |||
| Fixed bed boilers (stoker) | Commercial technology - Stoker boilers have long been a standard technology for biomass as well as coal, and are offered by a number of manufacturers. | Steam turbine | Commercial technology |
| Fluidized bed boilers | Commercial technology - Until recently fluidized bed boiler use has been more widespread in Europe than the United States. Fluidized bed boilers are a newer technology, but are commercially available through a number of manufacturers, many of whom are European-based. | ||
| Cofiring | Commercial technology - Cofiring biomass with coal has been successful in a wide range of boiler types including cyclone, stoker, pulverized coal, and bubbling and circulating fluidized bed boilers. | ||
| Modular (small, packaged, pre-engineered systems [<5 MW]) direct combustion technology | Commercial technology - small boiler systems commercially available for space heating. A small number of demonstration projects in CHP configuration. | Small steam turbine | Commercial technology |
| Organic Rankine cycle | Emerging technology - Some "commercial" products available | ||
| "Entropic" cycle | Research and development (R&D) status | ||
| Hot air turbine | R&D status | ||
Credit: USA EPA, 2007
| Energy Conversion Technology | conversion Technology Commercialization Status | Integrated CHP Technology (Prime Mover) | Prime Mover Commercialization Status | ||
|---|---|---|---|---|---|
| Gasification | |||||
| Fixed bed gasifiers |
Emerging technology - The actual number of biomass gasification systems in operation worldwide is unknown, but is estimated to be below 25. A review of gasifier manufacturers in Europe, USA and Canada identified 50 manufacturers offering commercial gasification plants from which 75 percent of the designs were fixed bed; 20 percent of the designs were fluidized bed systems. |
Gas turbine - simple cycle |
Prime movers have been commercially proven with natural gas and some medium heating value biogas. Operation on low heating value biogas and the effects of impurities on prime mover reliability and longevity need to be demonstrated. |
||
| Fluidized bed gasifiers | Gas turbines - combined cycle | ||||
| Large internal combustion (IC engines | |||||
| Modular (small, packaged, pre-engineered systems [<5MW]) hybrid gasification technology | Emerging technology - A small number of demonstration projects supported with research, design, and development funding. | IC engine | Commercial technology - But operation on very low heating value biogas needs to be demonstrated. | ||
| Microturbine | |||||
| Fuel cell | Commercial introduction | ||||
| Stirling engine | Emerging technology | ||||
| Modular (small, packaged, pre-engineered systems [<5MW]) hybrid gasification/combustion | Emerging technology - Limited commercial demonstration. | Small steam turbine | Commercial technology - But integrated system emerging. | ||
Credit: USA EPA, 2007
Social considerations
While the biomass energy offers benefits in terms of sustainable fuel supply, it can potentially aggravate the air pollution problem. Except for a very narrow range of applications of biofuels in no-combustion devices, such as fuel cells (which can generate electricity electrochemically with bio-hydrogen and syngas), most of the biomass energy technologies involve burning the fuel and result in greenhouse gas emissions. This drives public opinion away from biomass options towards such alternatives as solar and wind energy. The second issue debated is the potential competition for land use between the energy and food crops.

More information on the environmental issues associated with renewable energy technologies is included in the next page of the lesson.
8.7. Environmental Impact of Renewable Energy
8.7. Environmental Impact of Renewable Energy
Sustainability assessment of renewable energy technologies should certainly include analysis of environmental impact. By substituting notoriously harmful fossil fuel combustion, the renewable energy options help to mitigate such problems as air and water pollution, excessive water and land use, wildlife and habitat loss, damage to public health, and global warming.
At the same time, we must understand the non-zero impact of those alternatives when assessing their use at a particular locale. The intensity of environmental impact would vary depending on geographic location, climate, and other factors. For example, biomass energy generation may produce stronger environmental and economic impact in the areas where the land resources are limited, and energy crops would compete with food production. Also, technologies that are associated with significant water withdrawal for cooling and other operational needs can potentially strain the region where water shortages are an issue. So, careful decisions need to be made about deployment of particular technologies so that the most abundant local resources can be used most effectively, and overall impacts are minimized.
Reading Assignment:
Click on links below to read about the specific benefits of renewable energy technologies:
Source: Environmental Impacts of Renewable Energy Technologies, Union of Concerned Scientists, 4/26/2014
Solar [30] | Wind [31] | Geothermal [32] | Biomass [33] | Hydropower [34] | Tidal power [35]
Evidently, some of the renewable energy technologies, such as wind or solar, do not emit any greenhouse gases during operation. However, manufacturing, transportation, installation, maintenance, and decommission phases of the system lifecycle would involve some energy use, part of which may come from fossil fuel combustion. A number of lifecycle studies were performed to estimate the overall impact of the renewables.
Reading Assignment
NREL Release: Life Cycle Greenhouse Gas Emissions from Electricity Generation: Update [36], 2021
Such information can be used as a criterion for the sustainability analysis of those technologies. The activity assigned in this lesson asks for an online investigation of energy options with respect to a number of environmental and other metrics.
Summary & Activities
Summary & Activities
This lesson browsed through a number of renewable energy technologies and applications and provided you with some reading sources to understand how those technologies work and what is their current status of development. While we touched on the technical specs of different energy systems, mastering all the science that is behind those technologies would probably require you to take a separate course on each of those. Our goal here is to understand the role of these technologies in sustainable energy development and their potential pros and cons as decision-making factors. This lesson also contained some examples of metric calculations in order to illustrate the scale of technology impact.
| Type | Assignment Directions | Submit To |
|---|---|---|
| Reading | Complete all necessary reading assigned in this lesson. | |
| Discussion | This is a very obnoxious PR video on one of the emerging solar technologies. Your task will be to watch it with a critical eye and form an unbiased opinion on this technology. In your forum post, discuss the promise of this technology and also indicate what you do not "buy" in this video. Feel free to search additional information to support your argument. VIDEO [37] If you want to be truly unbiased, post your opinion first, then read others. Do not forget to comment on your classmates' posts. Deadline: for initial posting - this Sunday / for replies - Wednesday. |
Canvas: Lesson 8 Discussion |
| Activity |
Comparative Assessment
Please see more details in the Lesson 8 Activity Sheet posted on Canvas. |
Canvas: Lesson 8 Activity |
References for Lesson 8:
Alfe, D.; M. J. Gillan; G. D. Price, Thermodynamics from first principles: temperature and composition of the Earth's core" Mineralogical Magazine 67 (1), 113–123 (2003).
Brownson, J.R.S., Solar Energy Conversion Systems, Heliotactit Press, 2014.
Eiffert, P., Kiss, G.J., Building-Integrated Photovoltaic Designs for Commercial and Institutional Structures [12], NREL, 2000.
IEA Statistics, CO2 Emissions from Fuel Combustion, International Energy Agency, 2015.
Robert, S. and Guariento, N., Building Integrated Photovoltaics. A Handbook [38], Birkhauser Verlag AG, 2009.
Tegen, S., Lantz, E., Hand, M., Maples, B., Smith, A., and Schwave, P., 2011 Cost of Wind Energy Review [22], NREL (2011)
US EPA, Biomass Combined Heat and Power Catalog of Technologies, U. S. Environmental Protection Agency, Combined Heat and Power Partnership, 2007.
Vanek, F.M. and L.D. Albright, Energy Systems Engineering. Evaluation and Implementation, McGraw Hill, 2008.
Kubiszewski, I., Cleveland, C.J., and Endres, P.K., Meta-Analysis of Net Energy Return for Wind Power Systems".Renewable Energy. 35 (1): 218–225 (2010).