Lesson 2: Technology Development and Lifecycle Assessment
2.0 Overview
Overview
In this lesson, we will discuss the role of technology in society and how it develops on its way to commercialization. You will review the technology readiness level (TRL) scale adopted by a number of government agencies and see what kind of information is needed to estimate it. This lesson also sets the background for using the life cycle assessment methodology (LCA), which allows us to view a bigger picture of a technological process, with its multiple pros and cons and impacts on other parts of a sustainability system. Life cycle assessment is a complex approach, which requires extensive data digging and process expertise. While you will not be asked to perform the complete analysis on your own, some LCA-related exercises in this lesson will help you develop a big-picture mindset about technologies and products. Both TRL and LCA assessment methodologies will be useful in your individual course project, so take notes of the resources provided on those topics.
Learning Objectives
By the end of this lesson, you should be able to:
- explain the role of technology in society and in feedback loops of anthropogenic systems;
- articulate the technology readiness levels and identify the data needed for TRL analysis;
- apply the fundamentals of the life cycle assessment (LCA) and draw LCA scope and flow diagrams.
Readings
Journal article: J.B. Guinee et al., Life Cycle Assessment: Past, Present, and Future, Environ. Sci. Technol., 2011, 45, 90-96. (see Canvas)
US EPA Document: Life Cycle Assessment: Principles and Practice [1], EPA/600/R-06/060, 2006.
Questions?
If you have any questions while working through this Lesson, please post them to our Message Board forum in Canvas. You can use that space any time to chat about course topics or to ask questions. While you are there, please feel free to post your own responses if you are able to help out a classmate.
2.1 Technology as a part of anthropogenic environment
2.1 Technology as a part of anthropogenic environment
How do we define technology? In this course, specifically, we need to look at a particular technology, process, or product as an active part (component) of an anthropogenic system. In such context, a technology is not simply a piece of human knowledge implemented through design and engineering principles, it is considered a "living" part of a bigger organism. Here, we use the word "living" because our interest will be to assess the entire lifecycle of a technology: development, adaptation, operation, interactions with natural and technical environment, aging, and death (in some cases). Further on, we will try to understand how technology development impacts the viability of the whole system.
The common definition of the term technology is quite broad and multi-colored. The most simplistic one is application of scientific knowledge for practical purpose. And as an extension of it, the tool or device enabling that application is typically also referred to as technology. You can read more on the history and usage of this term in a Wikipedia article on Technology [2]. You may recognize that the meaning strongly depends on the context and the professional area you are in. However, in this course, we need to distill this broad perception of technology to a more specific entity that can be used for practical analysis.
Energy and matter conversion
The most important ability of almost any technology is conversion. A technology uses inputs of energy or matter to create outputs of energy or matter of a different quality. In a general case, any technology can be represented by the following scheme (Figure 2.1):
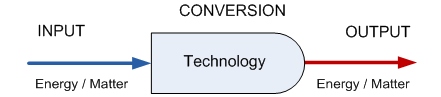
So, technology typically serves as a conversion portal in a system. We use energy to produce materials; or use raw materials to produce some more complex products; or we use matter to convert forms energy; etc. Note that conversion can also be performed by natural systems or mechanisms; but we only define technology as a human-made conversion system.
Here are some simple examples:
- Chemical energy of fuel >>> Car >>> Kinetic energy of car motion
- Radiative energy (sunlight) >>> Solar panel >>> Electric energy
- Electric energy >>> Phone >>> Sound, light
- Contaminated water >>> Water treatment plant >>> Clean water
- Electric energy >>> Furnace >>> Thermal energy
- Flour, water >>> Baking machine >>> Bread
- Organic waste >>> Composting >>> Fertilizer
- Electricity, mechanical energy >>> Electric guitar >>> sound
You can continue this list.
Self-Check
See if you can identify the energy and matter inputs and outputs for the following technologies:
- ? >>> Coffee maker >>> ?
- ? >>> Battery >>>> ?
- ? >>> Loud speaker >>> ?
- ? >>> Microwave >>> ?
ANSWER
- Water, ground coffee, electricity >>> Coffee maker >>> Coffee Drink
- Chemical energy >>> Battery >>>> Electricity (upon discharge)
- Electricity >>> Loud speaker >>> Sound
- Electricity >>> Microwave >>> Microwave radiation, kinetic energy (rotation)
Conversion efficiency
Obviously some technologies are better converters than others, and the following metric allows us to compare different technological options and choose a "better deal" in terms of useful output and money spent.
The key characteristic of any conversion process is efficiency. Efficiency is estimated based on the amount of useful output per unit input. In that sense, it is a subjective value which depends on a particular goal or purpose of a technological process, and a particular input resource we are concerned about. Hence, efficiency has widely varying meanings in different disciplines.
For example, efficiency is a very common metric in the field of energy conversion. According to the energy conservation law, the total energy entering a conversion device should be equal to the total energy output by the device:
Ein = Eout
Some of the output energy can be considered useful (based on the purpose of conversion), and some of it can be considered not useful and attributed to "losses":
Eout = Eout(useful) + Eout(loss)
What is useful and what is not is up to us to define (nature does not care!).
So, efficiency determines the fraction of the useful energy as follows:
Efficiency = Eout(useful) / Ein × 100%
Efficiency is important in the sustainability context because it indicates how much of the resource is put to work, and how much of the resource is wasted in the process. The reasons for losses are process dependent and should be analyzed specifically for each application. A big part of the technological research is aimed at increasing efficiency of the conversion process via minimizing losses.
Example 1

A typical incandescent light bulb outputs both light and heat. If you ever touched the working light bulb with a bare hand, you know that there is a good amount of heat generated in this kind of energy conversion.
If I use the bulb to lit my dining area, the useful energy I collect is obviously light, or radiant energy, and efficiency of the conversion process would be defined as:
Efficiency = (Light Output / Electricity Input) x 100%
But if I use the bulb to warm my home incubator (with eggs waiting to hatch), the useful energy in this case would be heat. And the generated light would be in fact unnecessary, that is not useful output. In this case the efficiency of the conversion process can be defined as:
Efficiency = (Heat Output / Electricity Input) x 100%
Here we can see that efficiency is often defined in the eye of the beholder.
By the way, the efficiency of the incandescent bulb in the first case is much lower than in the second. Conversion to light is on the average 2.2% efficient, while the rest of input energy (97.8%) goes into heat.
Example 2
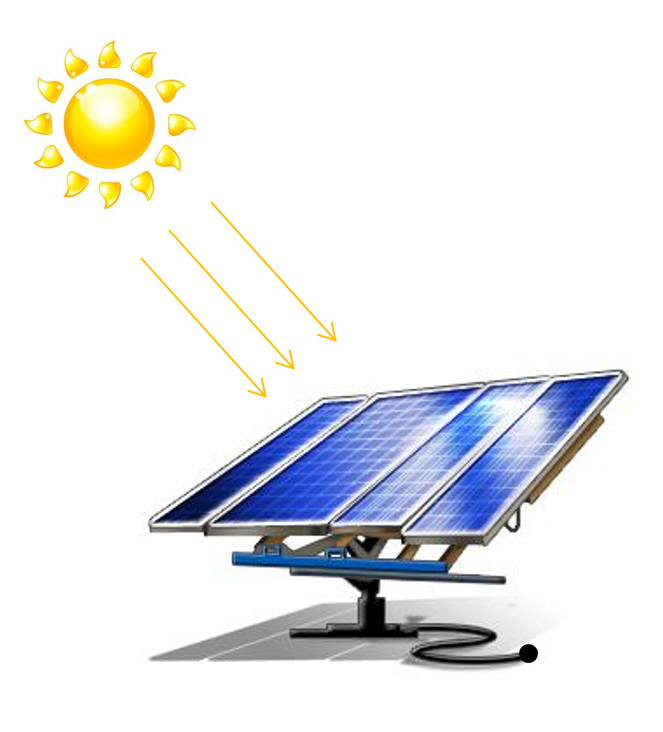
As another illustration of how this concept works, let us estimate the efficiency of a photovoltaic panel. Photovoltaic technology converts visible solar radiation (energy-in) into electric power (energy-out). So, for this estimation, we need to know or measure these two quantities.
Let us assume that the efficiency is measured in the middle of a sunny day, and the panel is installed perpendicular to the incident rays. Under those conditions, the typical incident radiation flux is ~1000 W/m2. We can take this number as the measure of energy-in per unit of time.
Now, let us assume that the panel outputs the power density 120 W/m2. Usually, this value can be obtained by measuring the voltage and current density of the panel (power = voltage x current).
Then, the efficiency value can be calculated as follows:
Efficiency = Eout(useful)/Ein × 100% = 120 W/m2 / 1000 W/m2 × 100% = 12%
This value means that 88% of total solar energy reaching the panel is lost, and only 12% is converted to electricity due to technology limitations or environmental factors. Just FYI, the nominal efficiency of most solar panels on market ranges between 15 and 22% (under ideal conditions). As you can see, efficiency estimations require data on technical performance of the system, so we will be paying attention to how performance of different technologies can be measured and interpreted.
Table 2.1 lists some known efficiencies of various energy technologies for comparison. These are just a few examples to demonstrate the variety of converters. We should note that generally efficiency of a process or technology is not necessarily measured in terms of energy. If the useful output of the converting technology is, for example, some form of matter (e.g., water electrolyzer in this table), the calculation can be made in terms of mass. Sometimes, efficiency analysis is also used to estimate the maximum theoretical efficiency, which cannot be practically exceeded due to inherent physicochemical limitation of the system. Finding maximum theoretical efficiency requires detailed knowledge of how the process works and what unavoidable losses occur in conversion.
| Process or Technology | Input | Useful Output | Conversion efficiency |
|---|---|---|---|
| Gas turbine | Gas flow | Electricity | 40% |
| Water turbine | Water flow | Electricity | 90% |
| Solar cell | Light | Electricity | 15-40% |
| Fuel cell | H2(gas), O2(gas) | Electricity | up to 85% |
| Water electrolyzer | Electricity | H2(gas), O2(gas) | 50-70% |
| Combustion engine | Fuel (gasoline) | Motion (kinetic energy) | 10-50% |
| Geothermal electric plant | Heat | Electricity | 10-23% |
| Solar thermoelectric generator | Sun radiation | Electricity | 15% |
| Electric motor | Electricity | Motion (kenetic energy) | 30-90% |
| Electric heater | Electricity | Heat | up to 100% |
| Refrigerator | Electricity | Negative heat | 20-40% |
| Fluorescent lamp | Electricity | Light | 8-15% |
| Photosynthesis | Light | Biomass, O2(gas) | 3-6% |
| Muscle | Metabolic energy | Kinetic energy | 18-25% |
Probing Question
Can energy conversion efficiency be more than 100%? Click on answer below.
YES
NO
Yes, but only in an ideal zero-loss system
Probing Question
Can you calculate the efficiency of an electric motor that consumes 150 W of electrical power and produces 120 W of mechanical power? Click on answer below.
8%
65%
80%
125%
Technology Adaptation
To become part of society life, technology needs to be adapted. Not all technologies invented go through successful adaptation, and there are several critical barriers that need to be overcome in order to create a working interface between technology and society.
Consider the following stages of technology adaptation:
- Technical Adaptation. Research and development, design, and demonstration. (yellow)
- Adaptation to the natural environment: matter and energy exchange, use of resources, and absorption of the impact (green).
- Adaptation to the technical environment: development of infrastructure and supporting technologies (brown).
- Market Adaptation. Development of economic algorithm. Proof of profit and long-term feasibility (peach).
- Social Adaptation. Acceptance by target society groups, based on ethical, environmental, cultural, and economic considerations (blue).
The first three stages of adaptation can be reflected in more detail through the Technology Readiness Level scale (TRL) on page 2.2 of this lesson. The fourth stage of adaptation is closely related to economic assessment, which should answer the question if the technology can support itself and make a profit in the short term or in the long term. Finally, the fifth stage of adaptation includes multiple social factors - how ready consumers are to accept this new technology, and what socal benefits it promises (for example, higher standard of living, job creation, convenience, faster service, improved health, etc.). The sustainability analysis should be comprehensive enough to cover all of these layers of adaptation and recognize connections and feedbacks between them.
2.2 Technology readiness levels (TRL)
Technology readiness assessment is a systematic, metrics-based process that evaluates the maturity of, and the risk associated with, critical technologies under development. It is a commonly accepted approach used in a number of industry and government organizations to assess the maturity of a technology (e.g., device, material, component, process, etc.) on an entire scale - from its invention to commercialization and wide-scale application. TRL rating actually determines how far a particular technology is from being deployed by industry or public. That, in turn, determines the amount of resources - time, funds, intellectual potential, facilities, etc., - necessary to bring this technology to life. We can illustrate the term 'readiness' with a simple example like the one below.
Example
For example, I am a researcher at a National Lab working on a small-size methanol fuel cell - a device that can convert the chemical energy of the fuel (methanol in this case) to electricity. I have my fuel cell stack operating in the lab and producing some great data in terms of power density. “It really works!” – I think. But can I put that fuel cell stack on my bike and have a ride home? Well... not right away, at least. The fuel cell system, the way it is set up and operates in the lab, is not ready for immediate use on a bike. I can possibly spend a few more months to work on the adaptation – fixing the fuel cell system on a bike, attaching an electric motor that would transfer the electrical power from the cell stack to the wheel, finding the regulators that would allow me to control the output during a ride, figuring out the position of the methanol fuel source and lines connecting it to the cell… it is quite an engineering project.
But let us imagine that finally I make it work! But can I offer this technology to bikers around town? I used my special knowledge to make all the technical adaptations and to solve multiple challenges, fixing shortcomings. If something is wrong, I know where to find a problem. But a general biker would not like to do all the work I have done and learn all the details I have learned. They would like it simple and fool-proof. I think, the technology, again, is not ready for public yet at that point. And, again, more resources and time are needed to make it user-friendly and more reliable for marketing.
Addendum: I worked on the methanol fuel cell systems in 2001. Years after some companies (Yamaha is one of them) actually managed to create some slick prototypes of fuel cell scooters, like the one shown here [3]. However, it is unclear if any of those made it to the market. If you find any information or references to it, please let me know!
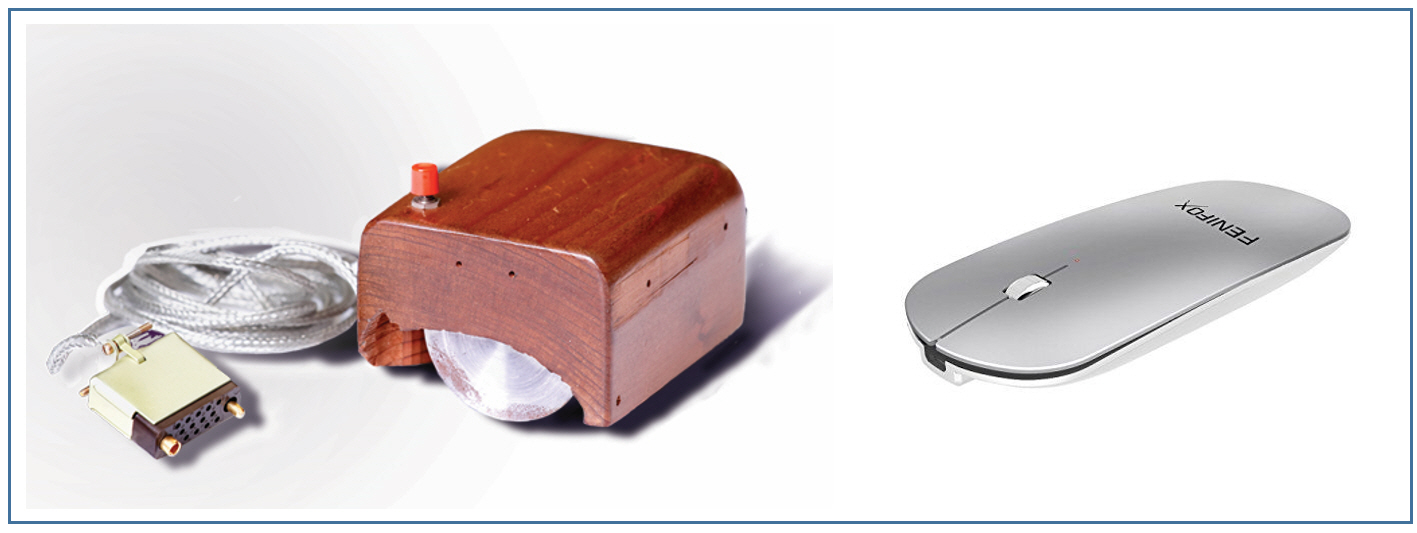
There are many other examples of technology going through many years of adaptation prior to reaching its broad applicability. What you see in the left-side image below may seem like a hardly recognizable mechanical device. What is on the right side is its contemporary version. The first computer mouse prototype was invented in 1964 by Douglas Engelbart of Stanford Research Institute. The mouse device remained an subject for further development, modifications, demos, and pilot projects for two decades before it was finally adapted for broader use with the personal computer Mackintosh 128K in 1984 (Wikipedia [4])
How do we evaluate the maturity or readiness of a particular technology?
Technology Readiness Level (TRL) scale was first employed by NASA in 1974 to evaluate the maturity of technologies for spacecraft design as part of risk assessment. It was demonstrated that transition of emerging technologies at lesser degrees of maturity results in higher overall risk.
Later, the TRL scale developed by NASA was also adopted in the U.S. by the Department of Defense (DOD), Department of Energy (DOE), Air Force, Oil and Gas Industry and also in Europe by the European Space Agency (ESA). The main rankings in the TRL method for technology readiness assessment are classified in the table below.
| Stage of Development | Technology Readiness Level | Description | Outcomes/Supporting Information |
|---|---|---|---|
| Basic technology research | TRL0 | Unproven idea | No analysis/testing performed. |
| TRL1 |
Basic Principles observed and reported Scientific research begins to be translated into applied research and development. |
Published research that identified the principles that underlie the concept. | |
| Research to prove feasibility | TRL2 |
Concept formulated Practical application is invented based on TRL 1. Potential of the applications is speculative and is inferred from general assumptions or some analytical data. |
Published research that outlines the application and initial analysis of underlying principles. |
| TRL3 |
Proof-of-concept Analytical and experimental studies are performed on a lab scale to validate analytical predictions. Work is done on various components of the potential technology (which are not yet integrated). |
Experimental data, measured parameters of interest in comparison with analytical predictions. | |
| TRL4 |
Lab-scale demonstration (“low fidelity”) Basic technological components are integrated to establish that they will work together. This is relatively “low fidelity” compared with the eventual system. |
Results of laboratory testing. Comparison with system performance goals. | |
| Technology demonstration | |||
| TRL5 |
Lab-scale demonstration (“high fidelity”) The basic technological components are integrated with reasonably realistic supporting elements so they can be tested in a simulated environment. |
Results of laboratory testing in simulated environment. Identified barriers for target performance goals and plans to overcome them. | |
| System development | TRL6 |
Prototype system designed The system is integrated with support elements, and model design is created to be tested in simulated or operational environment. |
Results of the prototype testing in simulated lab environment. Data are close to target expectations. |
| TRL7 |
Prototype system tested in operational environment Prototype near or at planned operational system. Represents a major step up from TRL 6 by requiring demonstration of an actual system prototype in an operational environment (e.g., in the field, on aircraft, in a vehicle, or in space). |
Results of the prototype testing in operational environment demonstrate success. | |
| System launch and operation | TRL8 |
Actual system completed The system is qualified through test and demonstration. Technology has been proven to work in its final form and under expected conditions. |
Results of testing in its final configuration. Assessment of it meeting its operational requirements. Plans, options, or actions to tune and finalize the design. |
| TRL9 |
Actual system proved successful Actual application of the technology in its final form and under mission conditions or on market. |
Reports on real application performance. |
TRL approach proved to be useful as a tool for:
- general understanding of technology status;
- risk assessment and management;
- decision making with respect to technology funding;
- decision making with respect to technology transfer.
In the context of this course, it will be important to understand the technology readiness levels in order to properly assess the timeline and cost of its development and implementation. When applied to a particular technology, the above listed TRL ranks should be customized for better relevance. Such customization would identify specific milestones as criteria to advance to the next level.
Watch This!
Please watch this 15 minutes and 47 seconds video in which Dr. Sean McCarthy (Hyperion Ltd) elaborates on the TRL concept, provides some examples, and examines the ties of TRL assessment to the decision making and choosing partners for a project. This video is made in the context of the european innovation and technology implementation landscape, but many of those insights are completely transferable to the US soil as well.
In this module, we're going to look at the concept of technology readiness level. And at the bottom of the first slide, you can see a web link that we've made. so any of the links I mentioned in the presentation you'll find them on this particular webpage. So,first of all, I want to look at just a quick overview of technology readiness level to see what it is. Then I want to talk about technology readiness level in Horizon 2020 and how technology readiness level can be used when you're selecting partners for the project. And finally, in the impact section of your proposal, you'll see me repeating the use of TRL so I just introduced the concept of TRL an impact here.
Now, the organization called EARTO has written an excellent report on technology readiness level. EARTO is an organization representing over 350 of the top research and technology organizations in Europe and you can see their website on this webpage. Now the concept of technology readiness level originated in 1977 and the aerospace industry introduced it as a way of expressing the level at which technology was evolving. So, there are nine levels to it which I'm going to explain in the following slides. In the eighties, it was then adopted by the Aeronautics industry and then other industries like electronics and pharmaceutical industry started to adapt it for their own needs and today most industries use it. So, the concept of TRL is not a European Commission concept. It's concept of industry but it has now been brought into Horizon 2020 and we look at in module two.
Now, the concept of TRL one, which is the basic principles are observed, so this is obviously the whole territory of basic scientists where's TRL nine means the product is ready to go on the market. So, in this presentation I’m going to use a computer mouse as an example of how you know how TRL can explain the evolution of the computer mouse. So initially the concept, somebody had this concept, that you can you move an icon across the computer screen and the technology concept was formulated. Somebody tried to decide how it will be done so this is TRL two. TRL three is laboratory experimentation, and you expect an experiment with many many different concepts, and you look at different concepts and you prove them but TRL four means it's working at laboratory level. So, let's have a look at TRL four mouse. So here is the official photograph of the first mouse. You can see it's made of wood. It's probably very heavy and probably if you move that, an item moved across the screen so it was pretty fundamental you couldn't sell this thing. And the 1984, I found this quotation that one of the top computer people in America said, that they didn't think that this will have much of the future. Now TRL five is where the technology is validated in a relevant environment, so it's tested but it's not power to the environment. TRL 6, it means it's demonstrated in a relevant environment, again it's not part of the system but it's being demonstrated. Now here in TRL seven it's demonstrated, and the key word here is in an operational environment, so it goes into a real system. Now in TRL 8, it means the system is working and the new component is integrated into the system. So, it's completed and here you could be looking at meeting standards meeting regulations and so on. And, in the TRL nine, the product is on the market. So, Logitech, which is one of the biggest producers of the mouse and it's said in their website that they've shipped over 500 million mice and that only represents about half of all the mice shipped over the last 20 years. So, it's an example of how technologies evolve.
Now, if you look at the pharmaceutical industry, that whole chain could be twenty years. If you look at the software industry, that chain could be 18 months. In energy, it might be 78 years from initial concept to having something on the market and, it varies between technologies, so TRL 1 to TRL 9 is a way of expressing the level at which your technology is at any moment. Now, this slide shows the more common terminology where basic research, laboratory research, technology research, technology demonstration, so those terms are sometimes used, and it just puts them in the position of the TRL table. Now, if we also look at the biotechnology sector and on the art or document, they discuss this comparison. So, you can see that phase one trials is about TRL 5 6. Phase two trials is TRL 7 and so on. Now, in Horizon 2020, they've adopted TRL as a way of expressing and where a folding scheme is focusing and what they've actually published is a general annex and annex G of the general annex on the participant portal contains the definition of the TRL and it is actually in the definition I have used in the previous section of the presentation and section one. Now, here's an example of a topic in column number one of Horizon 2020. So, we can see here it's NMP 1 2014 and we can see here that implementation of the proposed is intended to start at TRL 4 and target here at TRL 6. So, it means that the funding is focusing on projects that operate in this area. So, it's not funding basic science. It's not from the close to the market and it's telling the scientists so we're looking at technologies that have been developed in the laboratory. We want to focus on demonstration prototyping and so on. Of course, if you look at another program the transport program under aviation, and we can see the Caesar joint undertaking is focusing on TRL from one to six. That means in their ethics part of the program they've got from basic research basic concepts right up to demonstration and prototyping and so on. So, that's how would you see TRL appearing and TRL is mainly mentioned in pillar 2 which is industry leadership. Now on pillar three, which is societal challenges, they don't mention TRL too often but you have to use the same concepts when you're explaining and what lived in your project is focusing.
Now let's look at this diagram again. This zone, let's call it, these TRL's are referred to as the value of debt now academic researchers don't like TRL 5 6 & 7 basically because there's no publications in either. Industry doesn't like 5 6 & 7 because it's very expensive and it's very very risky. Now framework 7 the previous European program came to about TRL 4. But horizon 2020 is going to TRL 7. So, that's why Horizon 2020 is called a research and innovation program. Now there's a problem with their funding schemes. When national and European bodies are designing funding programs, they have to take into account that are called European competition law and international state aid rules. Basically, what they say is that the Irish government cannot fund a company to make it more competitive than a German company or an American company. So, these are very very strict rules. So, when funding bodies are designing their programs, they are restricted by competition law and stated rules to focus on approximately up to TRL 7. So that's why if Horizon 2020 is called a pre-competitive research program. So, let's look at the different programs in horizon 2020 and see where they're actually located. Now national funding goes from TRL 1 from the basic science up to demonstration and prototyping and programs like Eurostar's which is for research intensive companies bringing things close as close up in the market. That's about TRL four, five, and six. ERC phones frontier our basic research and that's roughly TRL 1 going into TRL 2. Fed future and emerging technologies is roughly TRL 2. Now, pillar two and pillar three stretch from TRL 2 up to about the end of TRL 6. Now, public-private partnerships, this is where European, national, and private funding is put on the table. Now, when your private funding put on the table, that means you can go further than the competition losses because industry is putting money on the table. but you can see the public-private partnerships are focusing on TRL 5 plus. Marie Curie fellowships they fund postdoctoral research but they also fund things like industrial PhD’s, the rise program for staff exchange between academia and industry. So, some of them are equally programs are focusing on the development of skills for people dealing with industry.
EIT, European Institute of Innovation and Technology is trying to position itself across the valley of death and accessing finance is about funding high-growth companies at TRL 6 plus. It's also used for other applications but, in the case of enterprises, it's for funding this part of the program. So, you can see here, how all the different programs and how they're related. Now, as you go towards TRL one, the main evaluation criteria becomes excellent scientific excellence. As you move in the direction of TRL four five six, the main evaluation criteria becomes impact. So, if you're at TRL, say, 2 to 4, then you have to consider both excellence and impact. Now, the different grants in Horizon 2020 address different parts of the TRL chain. The ERC grants of course are forming the ERC program. Now, in such an innovation actions, these grants cover from about TRL 2 to about the end of TRL 4 or early TRL 5. innovation actions are focusing, and demonstration prototyping living labs and they normally cover about TRL five, six, and seven. The SME instrument is mainly TRL 5 plus. So, it's looking at bringing technologies closer and closer to the market and the new type of grant fast-track to innovation is also focusing on TRL 5 plus. The public procurement, this is where public bodies demand innovation or research, that's actually getting closer at to the market. Now, coordination and support actions, these fund studies therefore networks and if cover the full range of TRL 1 to TRL 9 but it's mainly studies dealing with these particular areas.
Now, let's see how a TRL can be used when you're selecting partners for your project. The universities and research centers public research centers normally operate in the range of TRL 1 to TRL 4. Some of the research centers like Max Planck in Germany they would be operating at TRL 1 and 2. A lot of universities, you know, might be more basic research, which are TRL 1 and 2, where some research centers would be at TRL 3 or 4, but generally the public research centers are in this range. Research and technology organizations operate from about TRL 4, you know, up to TRL 7. and again, this is where EARTO, the European Association of research and Technology Organization tries to operate. So, it's getting closer to the market so it's working with universities and research centers but doing things that are more relevant to the needs of Industry. Research intensive companies now these could be big companies fairly large companies that have research departments, or they could be spin-off companies from research centers where, you know, highly qualified researchers set up their own company. They can bring results, you know, from TRL 5 onwards. Whereas, high tech companies, these are is that like to have technologies verified demonstrated piloted, and again they are normally operate maybe around TRL 7 or 8. So, when you're selecting your partners, you can see that for TRL 1 & 2 we are seeing fit, it's more suited to universities. Whereas TRL 4 5 6 is more suitable to the research and technology organizations. Now impact. Impact is asking the question what is coming out of your project and who will use those results. Now, if you're looking at an ERC project, now this is fundamental research. So, if that's operating a TRL 1 then the people that are interested in those results is the scientific community. So, if you look at the evaluation of ERC, they talk about what is the research impact of the results.
Now, if you're operating in a research and innovation grant, which is operating TRL 2 to TRL 5, then obviously the people that are interested in these results are people operating at about TRL 6 and, in that case, it would be the research and technology organizations and research-intensive companies. However, if you're looking at things like innovation actions, which is at TRL 5 and 6, then the organization’s interested in these results would be high technology companies, standards organizations, and regulatory bodies. Now if you're looking at an SME instrument, then you're getting really close to the market and the lead users here would be the early adopters of new products, new services, and business models. So, when we look at the impact part of the proposal, you will see how we will use the TRL table and, I think what we've shown in this presentation is the concept of TRL is a very useful way of describing the programs, describing the grants, describing the role of the different partners, and describing the impact.
So, I hope you enjoyed the presentation and again you can look at this website. It's an open website and you can find all the links that I described in the presentation. So, thank you very much and I look forward to seeing you in the next in the next modules. Bye for now!
Assigning a TRL rank is not a quick task. These are some serious questions that need to be answered and backed by technical data regarding the current status of technology:
- Is technology widely commercialized?
- Is technology demonstrated in the final form (in a target system)?
- Is technology demonstration in the relevant environment (field conditions)?
- What is the target performance / efficiency level (technically and economically)?
- What is currently achieved performance / efficiency?
- What are the materials involved and what is their availability?
- Is infrastructure available for deployment for this technology?
- What are the main barriers impeding the higher performance? … etc.
You can see that determining the status of technology development often requires search and knowledge of most recent advances, publications, and news releases on the technical performance, demonstration, pilot systems, and prototypes. It also requires independent expertise in subject matter along with understanding the economic criteria, which establish a threshold where the technology becomes economically feasible and is able to compete with existing alternatives.
What kind of data sources can you use for TRL analysis?
- Scientific publications in refereed journals
- Government agency reports
- Company news releases (may withhold technical details that are proprietary)
- Public news, web blogs, ads (secondary sources which may refer you to original information)
- Personal communications with experts, researchers, and entrepreneurs
Try this tool!
Check out the TRL calculation tool developed by the Advanced Energy Technology Group at University of California San Diego, which can be used to automatically retrieve the TRL value for a particular project based on input scoring on each level criteria. The calculator is in the form of MS Excel file, and you need to enable macros to make it work - it is included in Module 2 in Canvas. You are welcome to explore it and use it in your course project when determining TRL for the technology of your choice.
I hope you found content on this page useful. Different assignments in this course will tap into the TRL concept repeatedly, and you will be asked to either estimate the TRL ranking or provide some analysis of technology readiness and maturity in your course project.
Answer this self-check question:
An R&D group in a company developed the design and built a prototype of a new car engine. It has been through a set of comprehensive lab tests, which provide excellent results in terms of system performance. What technology readiness level can be assigned to this development? Click on your answer below.
TRL 2
TRL 4
TRL 6
TRL 8
TRL 10
Additional Resources on Technology Readiness Levels:
- NASA, Technology Readiness Levels Demystified, 2010, URL: https://www.nasa.gov/topics/aeronautics/features/trl_demystified.html [10]
- Disruptive Innovation, Technology Readiness Level (TRL) - Innovation Management, 2016, Youtube Video URL: https://www.youtube.com/watch?v=in4TnQZGYj4 [11]
2.3 Emerging, converging, disruptive technologies
2.3 Emerging, converging, disruptive technologies
Emerging technologies are technical innovations that breach new territory in a particular field. Over centuries, innovative technologies were developed and opened up new avenues for lifestyle and market transformation. Implementation of an emerging technology involves economic risk, but, if successful, offers a competitive advantage to a company. Some of the emerging technologies are developed via theoretical research, while others are based on commercial research and development.
Often emerging technologies are at the TRL levels 1-5 and require significant research, investment, and marketing to bring them to the commercial stage.
Here are some examples of emerging technologies at various stages of their development. [12]
The following websites post news on emerging technologies and ideas. Check these out - there are a lot of exciting examples of how technological innovations enter society. You may find these resources useful for picking examples for your studies in this course (I keep adding to this list every year:):
- Top emerging technologies for 2013 [13]
- Top emerging technologies for 2014 [14]
- Top emerging technologies for 2015 [15]
- Top emerging technologies for 2016 [16]
- Top emerging technologies for 2017 [17]
- Top emerging technologies for 2018 [18]
- Top emerging technologies for 2019 [19]
- Top emerging technologies for 2020 [20]
- Top emerging technologies for 2021 [21]
- Top emerging technologies for 2022 [22]
- Top emerging technologies for 2023 [23]
Converging technologies develop from the convergence of different systems evolving towards similar goals. Convergence can refer to previously separate technologies, which create new efficiencies when combined together.
Some examples of technological convergence can be the blend of the mobile telephone and the Internet, design of hybrid vehicles, combination of movie and game industry, combination of nano- and macro-scale science in biology, agriculture, and material design, online education…
Unlike emerging technologies, converging technologies are not necessarily based on technical breakthroughs, but rather involve already developed and commercialized technologies to achieve a new level of performance, human ability, societal outcomes, the nation’s productivity, and the quality of life.
Disruptive technologies are innovations that help create new markets and eventually go on to disrupt an existing market and value networks, displacing an earlier technology. This term, coined by Harvard Business School professor Clayton M. Christensen, is often used in business and technology literature to describe innovations that improve a product or service in ways that the market does not expect.

For example, the automobile was a revolutionary technological innovation, but it was not a disruptive innovation, because early automobiles were expensive luxury items that did not disrupt the market for horse-drawn vehicles. The market for transportation essentially remained intact until the debut of the lower-priced Ford Model T in 1908. The mass-production of automobiles was a disruptive innovation because it changed the transportation market.
Check out this "Disruptive innovation" Wikipedia page [24] which contains a list of some well-known examples of disruptive technologies. Many of these disruptions occurred within the past couple of decades, and we can relate to them. Disruptive innovations can change the way people live and work, re-arrange the values in markets, and lead to the creation of entirely new products and services. "The discovery and identification of disruptive technologies require the researcher to think like an innovator and entrepreneur in order to take full advantage of an “epiphany” moment, i.e., a moment in which you suddenly understand something in a new and potentially life-changing way. Such a moment, if properly acted upon, can accelerate your career toward recognition and long-term research funding." (KSRS, 2014)
Watch this:
The screen that you want to apply about technology is not what technologies are interesting, because there are so many that are interesting. You want to look at which ones have a chance of having a volume impact on many, many people, or large segments of the society. We’re going, in a single lifetime, from a small elite having access to information to essentially everyone in the world having access to all the world’s information. That has huge implications for privacy, communications, security, the way people behave, the way information is spread, censorship, how governments behave, and so forth. That’s the primary narrative, I think, today. It changes education. It changes the way intellectual property works, it changes the way businesses work, it changes the way the media works, on and on and on. We’re in the middle of that right now. The one that comes next is undoubtedly biology, that the same tools and techniques for combinatoric calculations, the kind of computer use, analytically, that we do today, when applied to biological systems, has an even greater impact. As we begin to say, “We’re going to take the analog world of biology—how genes work, how diseases work—put them in a digital framework, calculate for a while, do some machine learning on how things happen,” we’ll be able to not only help you become a better human being, but predict what’s going to happen to you physically in terms of your health, and so forth. Everything that we can do to build a model of how biology works, and in particular, how the human brain works, how DNA works, how protein folding works, these sorts of things, is a serious step change for humanity. So, all of the grand challenges, you know, the sequencing of the human genome. There are now firms and foundations building databases of DNA to use, to move to a model of individual diagnosis of disease; literally, you just press a button, the sequences occur, and we tell you what’s wrong. So, the use of analytical tools in a historically analog world is a very big change.
Materials and manufacturing: What’s happened in technology is that a new set of ultra-powerful, ultralight, ultra-conductive materials can now be manufactured at scale. And there’s a revolution, largely driven by a set of universities, around new kinds of these manufacturing services that will change everything. So that revolution, plus the arrival of three-dimensional printing, where you can essentially build your own thing, means that—during the rest of our lifetimes, anyway—it’ll be possible to build very interesting things from very interesting, new materials, which have all sorts of new properties. We already know that there’s a whole hobbyist area around buying these 3-D printers for plastic. Well, if you can get these new materials, you could put them in the printers, and then over time those printers will become capable of machining, mining, and producing these materials.
My computer, my friend: It’s certainly true that much of what we call innovation today is essentially routine, or evolutionary innovation. Cloud computing has been around for a long time, right? And it’s getting better, and better, and better. After all, cloud computing is just mainframe computing in a different way, which is how I learned how to compute when I was a young boy. So the fact of the matter is these ideas have been around for a long time. Is that going to change the world? It certainly makes it better, but it’s another step in the evolution of computer architecture. There’s a new generation of user-interface theory that says there should not be a user interface; the information should just be around you. We have a product called Google Now, which is available on Android1, which actually attempts (by watching what you’re doing, and with your permission, and so forth) to make some suggestions. So, it’s now figured out roughly where I live, and roughly where I work. And it tells me how long it takes me to get back and forth to work. Sort of useful. I didn’t ask it to do that. It figured out that I was going back and forth every day, and it said, “Oh, there’s a traffic jam,” and so forth. Now what are the limits of that technology? That’s an artificial-intelligence question. But it’s highly useful for it to have made a suggestion that would be good. So, I think we’re going to go from the sort of command-and-control interfaces where you tell the computer, like a dog, “Bark,” instead the computer becomes much more of a friend. And, a friend in the sense that the computer says, “Well, we kind of know what you care about.” And again, you’ve given it permission to do this. And it says, “Well, maybe you should do this,” or, “Maybe you should do that.” And the ultimate model is that the computer does what it does well, which is these complicated, analytical needle-in-a-haystack problems, and has perfect memory. And humans do what we do well, which is judgment, and having fun, and thinking about things. The relationship is symbiotic. The computer is making suggestions that are pretty good, they’re pretty helpful, but you’re ultimately in charge. 1(Since the date of this interview, Google Now has become available on iOS devices through the Google Search app. )
Man vs. machine: The race that’s not being followed in the media is the race between humans and automation. And this race is run every day, and it’s a very tough race. So, when I go to the local convenience store, they’ve replaced a low-wage worker with a machine to do my checkout. And that machine costs a great deal of money. And I’m sure it was a good business decision for them. So, what happened to that low-wage worker? Well, their low wages probably did not go up. They might have even gone down. Maybe they’re on part of government assistance. So, what’s the solution for that low-wage worker? Better education. So, in the race against automation, which is the race we’re winning, and which politicians never articulate, the answer is better education. Now, there are some other answers as well. For example, immigration of high-skilled workers; rather, we don’t have to educate everybody in America. We can also get a few educated people from other countries, and they’ll help us out, because they’ll hire all these other people here in America. And again, people are slowly beginning to understand that, in any particular country, you want an unfair share of highly educated people—in all industries, by the way—because in the race, they’re the winners.
Probing question
Which of the following technologies would you consider examples of disruptive technology over the recent decades? (Check all that apply.)
Click for answer.
Technologies (a), (e), and (h) have been disruptive to the markets mentioned in parentheses.
Technologies (d), (g), and (i) have been in fact sustaining since they did not upset, but rather developed respective markets to new values.
Technologies (b), (c), and (f) may have a future potential to be disruptive, but did not reach that level of readiness yet, i.e., existing markets are stronger.
Sustaining technology. As opposed to disruptive technology, sustaining technology relies on incremental improvements and innovations to an already established technology. Sustaining innovations or technologies do not create new markets but rather evolve existing ones with a better value, allowing the firms to compete against each other's sustaining improvements. Sustaining innovations may be discontinuous (i.e., transformational) or continuous (i.e., evolutionary).
Here, we also need to acknowledge the hierarchy of technologies. As we defined it above, technology is a human-designed system with a conversion function. At the same time, smaller parts of that system can be also considered technologies, and those can be represented as assemblies of even smaller components (sub-technologies). For example, a car may be considered a technology within a transportation system. However, smaller components within the car, such as the internal combustion engine, tire design, air conditioning, navigation, etc., are also technologies in principle. Should those be separately evaluated?
Our criterion for what level technology in this hierarchy we take for assessment is the role of the technology as a functioning element of the whole system. Our assessment targets are the systems (technologies) that can have a potentially disruptive impact on a bigger system, especially in the social and economic context. This is because progress towards sustainable development requires disruptions and seeks a shift in the existing paradigm. If technology is too subordinate to be responsible for disruption in a social and economic context, it’d be rather considered as a technical element supporting the main key technology.
Supplemental Reading
Book: Lucas, H.C. Jr., The Search for Survival: Lessons from Disruptive Technologies, Santa Barbara, CA., Praeger, 2012.
This book provides a comprehensive insight into technology development in present-day society. It is not required reading, but may be an interesting source if you have a particular interest in this topic.
Book: Johansson, F., The Click Moment: Seizing Opportunity in an Unpredictable World, Penguin US 2012, ISBN 978-1-101-60140-2.
2.4. Life Cycle Assessment
2.4. Life Cycle Assessment Methodology
Life Cycle Assessment (LCA) is a "cradle-to-grave" approach for evaluating products, materials, processes, services, and industrial systems with respect to their environmental impacts. Cradle-to-grave process begins with the extracting of raw materials from the earth to manufacture a product and ends at the point when all materials are returned to the earth in some form. LCA looks at all the stages of the product’s life one by one, estimates various environmental impacts at each stage and, as a result, allows selecting the path or processes that are least impactful based on chosen metrics.
LCA studies help decision-makers select the product, process, or technology that would be "least evil" in terms of its environment footprint, however the final judgment and interpretation of the results always depends on the key metrics and criteria that are most important to specific stakeholders. In that sense, LCA objectives should be set early in the analysis to answer the questions relevant to a particular project or application. Classic LCA deals primarily with environmental impacts, but further can be used with other pieces of information, such as cost and performance data, to find optimal solutions.
Life Cycle Assessment Objectives:
-
Support informed decision making for government, industry, and businesses
-
Provide basis for fair comparison between products and alternatives
-
Support recommendations for improving design and lowering impacts
The diagram below illustrates the main lifecycle stages to be considered in LCA:
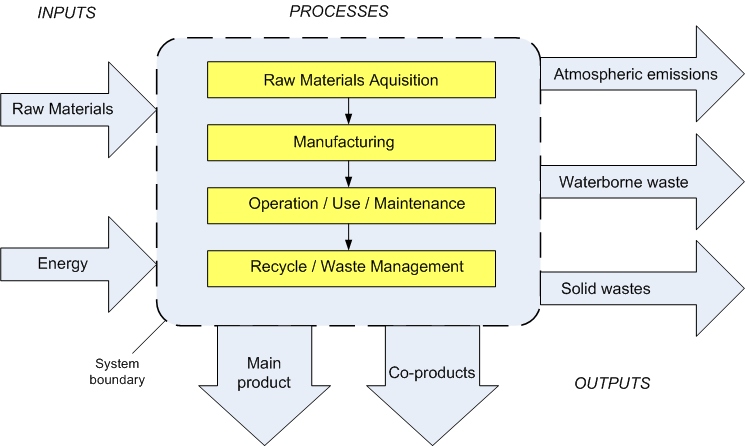
This diagram is based around a box-shaped system that includes four processes and is surrounded by a System Boundary. The four highlighted stages are:
- Raw Materials Acquisition
- Manufacturing
- Operation/Use/Maintenance
- Recycle/Waste Management
System Inputs are shown as arrows on the left of the system, outside the System Boundary. Inputs are represented by Raw Materials and Energy that flow into the system.
System Outputs shown as arrows on the right and at the bottom of the system, outside the System Boundary. Outputs are represented by Main Product and Co-Products (shown at the bottom), and Atmospheric Emissions, Waterborne Waste, and Solid Wastes (shown on the right).
As you can see in the diagram above, any product or technology would require input of some raw materials and energy at all stages: from acquisition to manufacturing, operation, and finally disposal. All of the mentioned lifecycle stages may produce atmospheric emissions, waterborne and solid wastes, simply because the efficiency of material use and energy conversion is always below 100% - there are losses and by-products, which sometimes can be highly undesirable. LCA helps to keep track of all useful and harmful outcomes, and the diagram in Figure 2.3 provides a guideline to LCA mapping.
Procedure for Life Cycle Assessment
A standard LCA study would consist of several key steps outlined below:
- Goal definition and scope: Identify a product / Set system boundaries / Develop LCA map and material flow chart.
- Inventory analysis: Collect data / Identify and quantify energy, water, and materials as inputs and emissions as outputs.
- Impact assessment: Set impact categories / Develop metrics / Perform calculations and comparative analysis.
- Data interpretation: Relate metrics to objectives / Quantify human and ecological effects / Deliver information to target audience / Issue recommendations
The standardized procedure for the LCA recommended for product and technology assessment in the U.S. is documented in the EPA guidelines referred below. Study this document carefully – some parts of this framework will be used as a basis for technology evaluation repeatedly in this course's assignments.
Reading Assignment:
US EPA Document: Life Cycle Assessment: Principles and Practice, EPA/600/R-06/060 [1], 2006.
This document provides a detailed guideline on how lifecycle assessment should be performed. This is a long document and contains a significant amount of information. While I would like you to look through the entire file, here are a few things that you may want to focus on:
- Certainly read through Chapter 1, where the basics of the LCA strategy are explained (pp. 1-7).
- In Chapters 2 and 3, try to mainly understand how the scope and flow diagrams are constructed for a particular project or product. The purpose of those diagrams is to present a big picture and list all the important elements of the life cycle before data analysis is started. Study the examples in Figures 2-1 and 3-2, as you will be asked to do something similar for this lesson assignment. You may scan quickly through the rest of these chapters.
- Chapter 4 on Impact Assessment is the core of the LCA. Read through entire chapter 4 (pp. 46-53). Take a note of the major environmental impacts that are usually considered in LCA. That will be an important piece of information when we explore different metrics in Lesson 3.
- You can quickly scan through Chapter 5, taking note of the main steps in LCA interpretation.
In this Lesson, we are going to do an exercise on LCA scoping for a simple product. That would only cover Stage 1 of the entire process. Still, it is a very important step that sets the ground for the entire analysis and provides directions for collecting data and developing metrics during the Inventory Analysis and Impact Assessment stages of the LCA. Please refer to the Canvas Module 2 for specific directions on this assignment.
Examples of LCA Projects
Website: Design Life-Cycle, University of California, Davis, Department of Design, URL: http://www.designlife-cycle.com/ [26] Accessed: May 2020.
This website presents a very versatile collection of LCA studies of consumer products, fashion, architecture, electronics, and other technologies. Studies are presented in the "nutshell" form and enhanced by infographics. Very fun resource to explore!
LCA Limitations
- LCA thoroughness and accuracy will depend on the availability of data; gathering of data can be problematic; hence a clear understanding of the uncertainty and assumptions is important.
- Classic LCA will not determine which product, process, or technology is the most cost-effective or top-performing; therefore, LCA needs to be combined with cost analysis, technical evaluation, and social metrics for comprehensive sustainability analysis.
- Unlike traditional risk assessment, LCA does not necessarily attempt to quantify any specific actual impacts. While seeking to establish a linkage between a system and potential impacts, LCA models are suitable for relative comparisons, but may be not sufficient for absolute predictions of risks.
Even for relatively small systems, LCA is a comprehensive task that requires interdisciplinary knowledge in the technical and economic areas. Hence, LCA projects are typically assigned to teams of experts and can rarely be performed by a single person with sufficient accuracy.
LCA approach has developed over decades, coming from a product-oriented model used to evaluate environmental impact to a bigger framework that elaborates on a wider environmental, economic, and social scale. At the current stage, LCA is being transformed into Life Cycle Sustainability Analysis (LCSA), which links the sustainability questions with the knowledge and research needed to address them. Check out the following article to learn more about the LCA history and background:
More Reading on LCA:
Journal article: J.B. Guinee et al., Life Cycle Assessment: Past, Present, and Future, Environ. Sci. Technol., 2011, 45, 90-96.
This article reviews the history and the most recent advances and trends in the life cycle assessment. It provides some good illustrations of method diversity, which can be both beneficial and challenging in terms of data interpretation and application. The article also exemplifies LCA being linked to policy development and decision making.
This reading is optional, but highly recommended in the context of this lesson. This article can be accessed online through the Penn State Library system database or via link in Canvas.
Summary & Activities
Lesson 2 Summary & Activities
In Lesson 2 we explored the definitions of technology and attempted to characterize its role in sustainability systems. We learned that before technology can become part of society, it has to be developed and pass through a few levels of adaptation. This process of adaptation is largely governed by social and economic factors, not simply by the technical benefits proved through research and science. Decision making as for to deploy or not to deploy a particular technology, on what scale, at which location and when, would rely on (1) technology readiness (which is determined through TRL analysis) and (2) on technology adaptation to the social, economic, and environmental spheres (which is assessed through the LCA analysis). Both types of assessments are complex, require a significant amount of factual data, and must be system-specific and location-specific. This lesson provides important background on both of the above-mentioned methodologies. The next step will be to choose metrics and to develop quantitative indicators for assessment.
| Type | Assignment Directions | Submit To |
|---|---|---|
| Reading | Complete all necessary reading assigned in this lesson. | |
| Discussion |
Define Technology. How would you define technology from your personal perspective? (What comes to your mind when you use this word?) How do you understand the expression "sustainable technology"? Provide some examples to your definition (~1 paragraph). Provide comment on at least one other post on the forum. Deadline for initial posting: this Sunday; post your comments to other threads by the end of this lesson Wednesday |
Canvas: Lesson 2 Discussion |
| Activity |
Activity 2 - Develop LCA scope for a particular product. You can use an object from the list or come up with your own choice. The goal of this exercise to apply lifecycle thinking to a simple product and map out all inputs and outputs and identify the potential environmental impacts of each lifecycle stage. You are advised to look up information on manufacturing and materials used in the product lifecycle, but you are not required to present any quantitative information. Please refer to Lesson 2 Activity Worksheet on Canvas for more details. Deadline: Wednesday (before midnight) |
Canvas: Lesson 2 Activity - LCA diagrams |
| Individual Course Project |
Become familiar with the Course Project assignments in EME 807 by looking through Lesson 12. Think of a topic that you would like to use for your Individual Course Project. The topic should focus on a particular technology of your choice, and it can be close to your professional area, or it can be a new topic you want to learn more about. You will use this technology or process for comprehensive evaluation using different concepts included in this course. Submit a brief description of the topic with an explanation why you chose it (please limit to 500 words) to the "Course Project - Topic Submission" in Canvas. Deadline: Wednesday (before midnight) |
Canvas: Course Project module |