10.1. Alternative Fuel Vehicle Technologies
10.1. Alternative Fuel Vehicle Technologies
Let us start with some facts (Source: Sierra Club, 2014):
- Every day, the U.S. uses ~400 million gallons of oil to move people, goods, and vehicles.
- There are ~230 million gasoline-fueled vehicles in the U.S. that travel average 12,000 miles per year.
- About 70% of all oil used in the U.S. is used for transportation.
- About 70% of all oil used in the U.S. is imported from the countries at "high risk" of instability.
- Every day, the U.S. sends about $1 billion abroad for oil expenses.
While the demand for transportation fuels is increasing, the continuing dependency of the U.S. economy on the foreign oil has put the country in an extremely vulnerable position with respect to meeting its transportation energy needs. This vulnerability is the critical motivator in searching for alternative fuels for vehicles and looking for alternative types of transportation as well. Sustainability of transportation basically means the flexibility and ability to provide for your own needs using the resources that are local, widely available, or renewable. What are the options there?
A number of alternatives (including both liquid and gaseous transportation fuels) have been a subject of research and implementation for the last few decades. Let us review the background behind those options. Click on the following links to read about the various classes of alternative fuels considered for transportation purposes:
- Biofuels [4] (biodiesel, ethanol)
- Natural gas (NGV) [5]
- Hydrogen [6]
- Electricity [7]
All of the alternative fuels have their current advantages and disadvantages, which are briefly summarized in US DOE Data Table [8] (U.S. DOE, 2007).
Please note, the second row of this table shows an important metric used to characterize fuels (not only transportation fuels) - energy content or energy density. It is measured in energy units per unit volume or unit mass of the fuel. For example, from the data in the table, we can see that diesel and biodiesel fuels provide the highest amount of energy compared to other liquid fuels.
Alternative fuel supply chain and distribution
Viability of certain types of transportation fuels is closely related to the processing, supply, and distribution infrastructure. This is especially critical in the U.S. society and economy, which are heavily reliant on the usage of road vehicles for personal and industrial needs.
The following reading will introduce you to the strategies and facts associated to the transportation liquid fuel supply chains. This covers both existing renewable and non-renewable fuel infrastructures:
Reading assignment:
Report: Boutwell, M., Hackett, D.J., Soares, M.L., Petroleum and Renewable Fuel Supply Chain [9], Stillwater Associates, 2014.
While reading, try to find answers to the following self-study questions:
- What are the main types of liquid alternative fuels intended for transportation?
- What are the main feedstocks to produce those alternative fuels at the national scale?
- What are the main fuel delivery systems used to distribute petroleum and alternative fuels from the source of treatment to the consumers? Are those systems similar or must be different?
- Can you understand the nomenclature of ethanol blends? For example, what are E85 or B20 fuels by composition?
Transportation Emissions
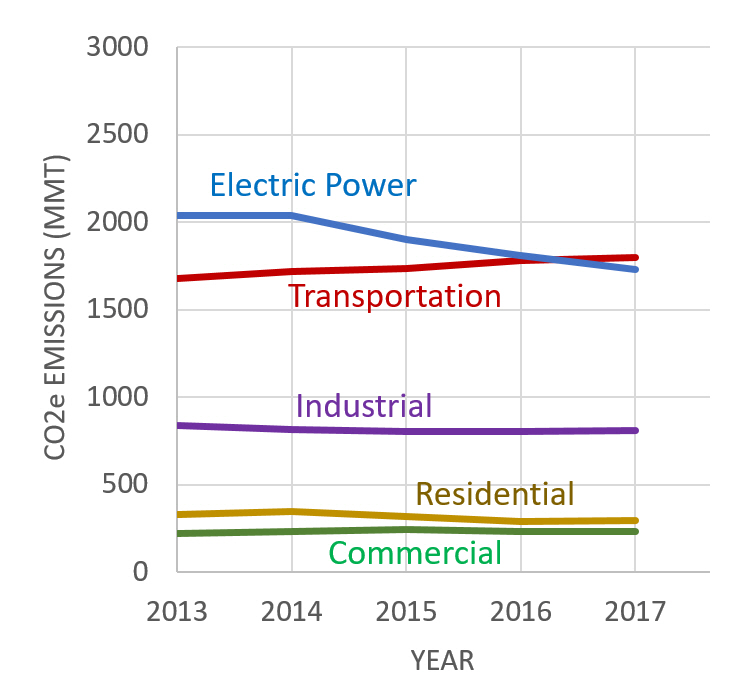
Strong motivators for developing alternative vehicle technologies and fuels are growing emissions and alarming urban air pollution levels. According to US EPA, in 2017, CO2 emissions from transportation sector surpassed the long-time leader – electric power sector – in the total national emissions budget. This change in “leadership” in part happened due to increasing addition of natural gas and renewable sources to the power generation mix while retiring older coal power plants in a number of states. Here is how the last half-decade of CO2 data looks like:
It is also estimated by EPA that nearly 60% of those transportations emissions in the United States come from passenger vehicles – cars, SUVs, and pickup trucks. There are economic reasons for that growth. In the late 2000s, the automobile emissions were moderated by the policies adopted by the Obama administration, which limited the amounts of gasoline the vehicles were supposed to use per mile. The Trump administration initially aimed at elimination of those fuel efficiency standards, which would most likely push future transportation emissions up. However, the proposal was recently revised, and after receiving comments from industry and public, the government did not eliminate the Obama standards, but adjusted them, to enforce only 1.5% annual MPG increase for passenger vehicles (as opposed to 5% under Obama regulation). The main argument for this change was that less stringent standards would make new cars more affordable, and thus increase driving safety for the families who would be otherwise be forced to drive older cars (USA Today [10]).
Low gas prices have also been contributing to the trend, tempting Americans to drive more miles and purchase larger personal vehicles (SUVs and such), which typically have lower gas mileage.
 [11]
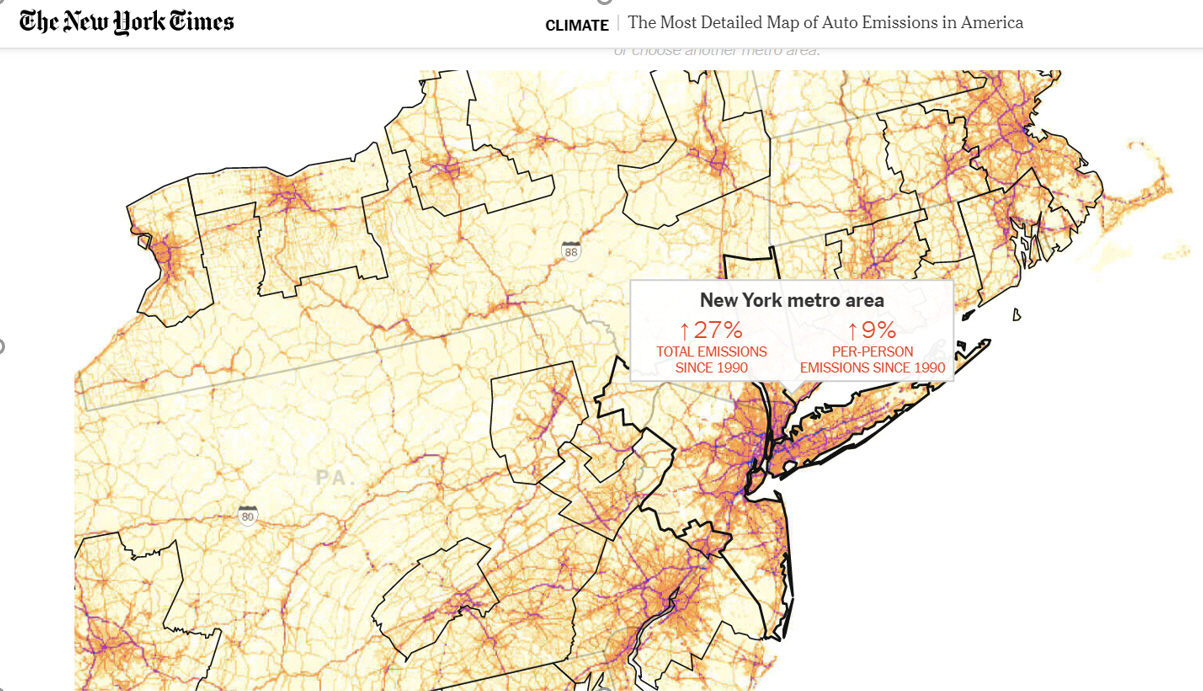
[11]Click on the image to access the interactive map showing the transportation emissions in America. Mouse over a city area to display the emission metrics. Note the difference between the total emissions and emissions per person. While New York City leads the way among US cities in total emissions, if those emissions are normalized by population, contribution per person appears rather moderate (Popovich and Lu, 2019).
From these data, we see two drivers behind increasing emissions: population growth in metropolitan areas and increasing time behind the wheel. Some areas do better than others in terms of limiting driving through encouraging alternative mobility options. One example is DC Metro area, which shows the drop in emissions per person. In spite of increasing total population and total emissions, people appear to drive less than in other urban regions with high reliance on suburban commute.
Curbing vehicle emissions will require several factors working in synch: more efficient cars, developing alternative engine technologies (e.g., electric, hydrogen, natural gas), and changing in human lifestyle. Cities and states look for expanding transit options, such as rail, bus, and subway services, as well as encouraging carpooling and vehicle sharing programs. It is also anticipated that in 2021, New York will become the first city in the US to adopt a congestion pricing plan [12] to discourage drivers from entering the busiest areas of the city.