
Reading Assignment
- SECS, Chapter 5--Meteorology: the Many Facets of the Sky (section on Air Masses)
Why is meteorology so important to solar energy conversion systems? Think about meteorology and the scientists that explore the field. In effect, they can help us in the analogous manner that a geologist helps to define and quantify mineral resources in the ground. It is up to us to learn the language of meteorology to communicate effectively with our peers and increase our success in project development and planning.
As noted in the text book, we need to use the Air Mass phrase suitable for the systems science perspective, reflecting changing parcels of air shifting across the surface of Earth. Those parcels are generating clouds and dust storms, tornadoes, hurricanes, and sunny blue skies. This is the meteorological concept of the Air Mass that we will use to help in our assessment of the dynamic solar resource for a client in their multiple climate regimes.
Meteorological Air Masses
The Air Masses used in engineering standardization for SECS technologies are not nearly as useful as the real, dynamic air masses that we will use for solar resource assessment.
The sky can be divided up into large volumes with common properties. Air masses are large pancakes of gases and particles (we call them parcels) with common properties of temperature, chemistry, and pressure. Aside from the strong role of clouds, those common physical properties each affect the way in which solar energy intensity will be decreased along the particular path length through the sky. Air mass will affect the way that light is absorbed and scattered, and hence will affect the characteristic behavior of light incident upon an aperture. The changes between air masses are weather fronts, and the study of the regional dynamic dance of air masses and accompanying fronts on a sub-annual basis is called meteorology. When we expand our studies of air mass behaviors to multiregional scales (larger spatial scales) and time scales in the range of decades to millennia, this is called climatology.
I want you to think of an air mass from meteorology as a turbulent pancake that interacts with both shortwave and longwave light, resulting in highly variable irradiance conditions at the ground level, and also for satellite remote sensing in orbit. Irradiance conditions are constantly shifting over a given locale, and we will be in need of effective forecasts of irradiation (over different time intervals) for many SECS technologies.
Seasons: the Sky-Locale Relationship
It is always important to solar energy conversion that we figure time and scale into our understanding. We observe that each location under study is influenced by multiple air masses during different times of the year. In the midlatitudes of North America, we call this periodicity seasons (deep thought, yes). Hence, our solar energy conversion systems are effectively in different locales for each period of air mass dominance.
One locale for your client will be divided up into seasons. For us, each season (a block of time) is like an independent region, different from the next season--and we call these regions climate regimes. In the mid-latitudes we observe four climate regimes, while regions affected by monsoonal swings may have two or three climate regimes.
Consider: there is not one State College, but four! One State College for each season, or specifically, one statistically different solar resource fingerprint for each synoptic climate regime.
Regime changes are often noticed by us in terms of the air temperature and humidity, but the sky regimes will change as well, with respect to wind speed, the size of weather cells, and emergent cloud behaviors.
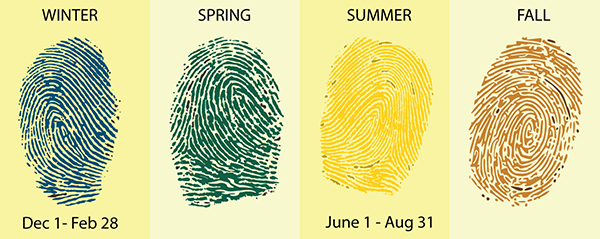
Four different fingerprints symbolizing the different climate regimes for a given locale in winter, spring, summer, and fall. The first fingerprint here is labeled Dec 1 - Feb 28, the second and fourth fingerprints are not labeled. The third fingerprint is labeled June 1st - Aug 31.
From the perspective of design in solar energy conversion systems, the skies allowing sunlight through to Philadelphia from December 1 through February 28 exist in a different climate regime from the Philadelphia skies of June 1 through August 31.
Source Regions and the Bergeron Classification System
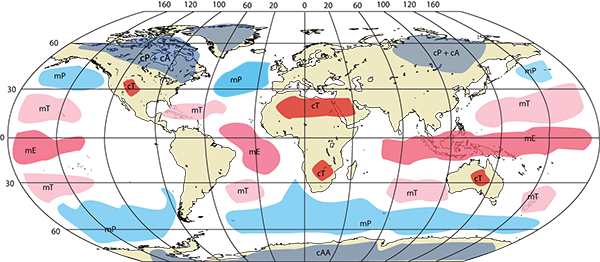
Recall that the change of irradiation over seasons is due to the tilt of Earth (which leads to our measure of declination). When the Earth is unevenly energized by the Sun, air masses are mobile. Any locale will observe changes in residential air mass behavior over time. Air masses are created in source regions, where the mass acquires its dominant characteristics of temperature and humidity. Then air masses move from the region of origin into new regions. Source regions have been mapped out in Figure 3.11, below, and they will tend to have lighter winds, allowing the air mass to accumulate the temperature and humidity conditions of the accompanying portion of the Earth's surface (the big solar energy conversion device). Hence, areas affected by jet streams will not be regions to create new air masses.
The Bergeron classification system is accepted and used by atmospheric science and indicates the origin locale. This is important information, affecting the quality of the solar resource. Properties of thermal behavior and humidity are conveyed in the Bergeron classification, and the classification has a relatively simple two or three letter coding.
First, air masses are labeled according to their origin above a land mass, continental (c) or above an ocean, maritime (m). Maritime air masses will contain more humidity derived from the underlying body of water. Next, air masses can be grouped into main thermal categories of the site origin: (A, P, T, E). This grouping is largely separated by jet streams and changes in latitude, which of course are each derived by the tilt of Earth relative to the projection of irradiance from the Sun. By coupling the two letters together, we can then map out the source regions for meteorological behaviors across the planet and through the seasonal shifts.
The relation of air mass to monsoon cycles is less used in continental meteorology of North America, but is highly important to solar development in Asia.
Again, air masses are labeled according to the origin of the parcel above a land mass,
- continental (c): low humidity source
- maritime (m), above the ocean: high humidity source regions
Air mass source regions are also grouped according to their thermal characteristics, the thermal generator that is charging up the parcel:
- Arctic/Antarctic (A/AA): A high pressure regime that stabilizes to the far north.
- Polar (P): Very common air mass origin regime for mid- latitude regions of the USA and Europe.
- Tropical (T): Very common air mass origin regime for mid-latitude regions of the USA and Europe.
- Equatorial (E): A high pressure regime that stabilizes near the equator.
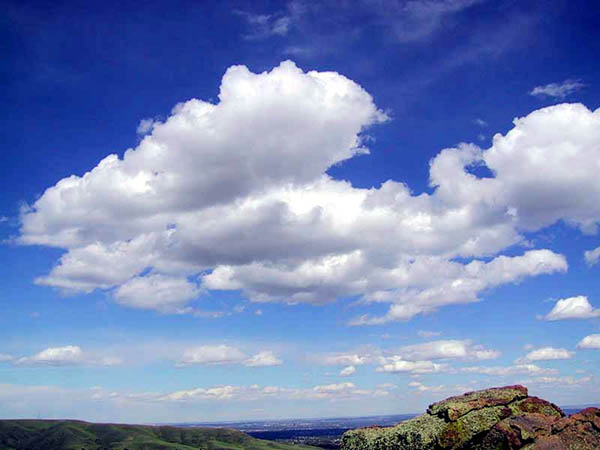
The Role of Clouds and Scattering
Clouds have the ability to scatter and even focus light, which means that sometimes a cloud will remove energy from the solar resource on the ground, and other times clouds will collect and focus light that's even more intense than light on the clearest day in your locale. Yet, we know that clouds are ephemeral and dynamic systems in and of themselves.
The albedo is the reflective fraction of light from a given surface, a fractional value from 0-1.
Milk, Albedo and Clouds
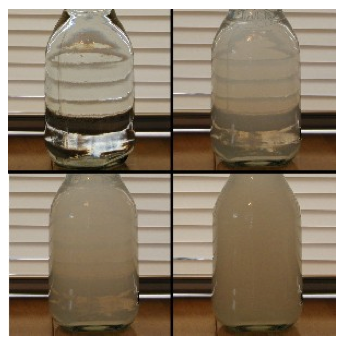
Let's consider a jar of clean water (upper left in the photograph), into which one may add a small amount of milk (upper right). Milk is a "colloidal suspension" of solid particles supported/floating in liquid. As such, the solid particles of fat reflect light, scattering the light in many directions like a cloud would do.
In the lower left and lower right corners, the milk concentration has been steadily increased. We can see through the clear glass of water, suggesting that the transmission of visible light from behind the glass to an observer standing behind the camera is high. For the low concentration mixture of milk and water in the upper right, the small amount of added milk has slightly decreased the transmission of light. We can still see the louvers of the window blinds behind the jar, however.
With more milk added to the mixture in the glass on the lower left, the transmission of light was further reduced, and one's ability to perceive the louvers on the other side of the glass was diminished. Finally, adding more milk to the glass in the lower right cut the transmission of visible light to very low levels, and we can't see through the glass.
What is not being transmitted or absorbed is being reflected. Consider this experiment in the context of albedo. The albedo of clean water in the visible sub-band is much lower than the increasing albedos of all three mixtures of water and milk. Of the three mixtures, the glass with the greatest concentration of milk has the highest albedo.
Recap: we have seen how reflection and albedo is a bit more complicated when light is interacting with millions of surfaces in a suspension, like a cloud. We can also see why a more effective term is backscattered radiation, which is used to describe the collective phenomena. And yet, we can use the backscattered data from clouds to infer useful information about the solar resource at the ground. How do you think we could use that data?