
Reading Assignment
- J.R. Brownson, Solar Energy Conversion Systems (SECS), Chapter 9: Solar Energy Economics (Please pay particular attention to on Government and Markets).
- N. Pfund and B. Healey. (2011) What would Jefferson do? The historical role of federal subsidies in shaping America’s energy future. Technical report, DBL Investors. (PDF available on DBL Site.)
- Optional: DSIRE (NC Solar Center) Database of State Incentives for Renewables and Efficiency (Please find your state or a favorite state, and the Federal incentives.)
In this reading, we are digging in to the lever of microeconomic incentives. To increase solar utility for a client, or to increase the preference of the client to solar goods and services, there exist incentives for solar that effectively internalize a positive externality. While you read Chapter 9 and scan the paper by Pfund and Healey (look to the summary and the key graphics at first), I want you to think about the following:
- What is the link between Energy Portfolio Standards and Solar Renewable Energy Certificates?
- What is an "externality" in a market sense?
- Have other energy resource systems been supported by government in the past?
Government Influence on the Developing Renewable Energy Industry
How Can Policy Impact Consumer Choices?
In other nations about the world, policy for renewable energy development can emerge at either a national or regional level. In the United States, there are currently no over-arching Federal mandates requiring the development of alternative energy power generation. Thirty-three states have varying standards and mandates for the production of renewable energy for power generation.
To see this diversity of strategies, we can review the Center for Climate and Energy Solutions report of Renewable & Alternative Energy Portfolio Standards.
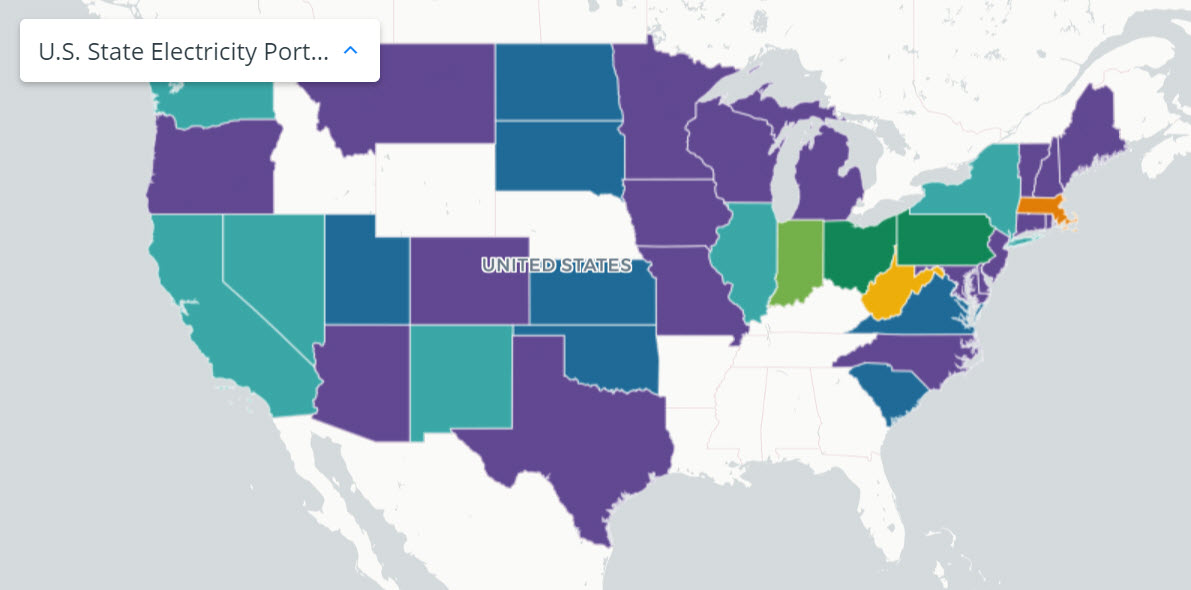 |
Try This! Interactive Map of US Electricity Portfolio StandardsClick on the image to access the interactive map showing the electricity portfolio standards for each state. Click on each state to see the updated renewable or alternative energy goals and milestones. |
The legislative process in various states has influenced how these programs have evolved. If we look at the states that have "alternative energy portfolio" standards rather than renewable energy portfolios (Michigan, Ohio, West Virginia, and Pennsylvania), we note that all of those states have significant industries such as auto, coal, steel, etc. One needs to consider the various reasons why these portfolios were outlined as "alternative" as opposed to "renewable." You should also develop an awareness for those states that have no standards whatsoever, and consider what impact this has on solar development. For example, we may consider that Wyoming has a very small population with the highest per capita energy demands, while being abundant in coal.
- Consider the Pennsylvania [Alternative Energy Portfolio Standard] : 18% by 2020 (with at least 0.5% carved out for PV solar)
On December 16, 2004, Governor Edward Rendell signed into law Pennsylvania's Alternative Energy Portfolio Standard, requiring that qualified power sources provide 18.5 percent of Pennsylvania’s electricity by 2020. There are two tiers of qualified sources that may be used to meet the standard.
- Tier 1 sources must make up 8 percent of the portfolio, and include wind, solar, coal mine methane, small hydropower, geothermal, and biomass. Solar sources must provide 0.5 percent of generation by 2020. However, the source of the solar power could be delivered from anywhere in the PJM ISO area, so that small fraction was depleted quickly and led to a crash in prices for SRECS (which we will talk about next).
- Tier 2 sources make up the remaining 10 percent of the portfolio, and include waste coal, demand side management, large hydropower, municipal solid waste, and coal integrated gasification combined cycle.
- You can read more about the Pennsylvania AEPS by directly reading the bill itself - AEPS.
- You can also visit the Pennsylvania Public Utility Commission's site describing the program - PA AEPS site.
SRECS: Market Drivers
Unique markets have been created by government stimulus of the renewable energy industry. A key market driver has been the capacity markets that have been formed in several states. In these markets, Energy Distributions Companies (EDC) are required to purchase Solar Renewable Energy Credits (SREC) or face steep fines in order to facilitate the states' requirements for renewable energy. (SREC Trade: SREC Online Auction)
|
States with SREC Markets |
States eligible to sell into other state SREC markets (All states eligible in NC) |
States with a Renewable Portfolio Standard solar requirement, but no SREC market yet |
Remaining States |
|---|---|---|---|
| District of Columbia (PA) Delaware (DC, PA) Maryland (DC, PA) Massachusetts New Jersey (DC, PA) North Carolina (DC, PA) Ohio (DC, PA) Pennsylvania (DC, OH) |
Illinois (DC, PA) Indiana (DC, OH) Kentucky (DC, OH) Michigan (DC, OH) New York (DC) Tennessee (DC) Virginia (DC, PA) West Virginia (DC, PA, OH) Wisconsin (DC) |
Arizona Colorado Missouri Nevada New Hampshire New Mexico Oregon Texas Washington |
Alabama Alaska California Connecticut Florida Georgia Hawaii Idaho Iowa Kansas Louisiana Maine Minnesota Mississippi Montana Nevada New Jersey North Dakota Oklahoma Rhode Island South Carolina South Dakota Utah Vermont Wyoming |
Something to look at closely is that in Massachusetts and New Jersey specifically, these credits can't be sold or purchased outside of the state. This has a significant impact on how these markets operate. New Jersey has outpaced all other states in the eastern PJM grid in the production of power from Solar PV. An unexpected development in the REC markets has been the pace at which these markets have met and exceeded the portfolio standards. Please note how this has impacted REC pricing.
Points of reference:
PJM originally stood for Pennsylvania, New Jersey, Maryland. It is simply known now as PJM; however, the grid it operates is now much larger.
PJM is the grid operator for all or part of 13 eastern states. It is the market through which Energy Distribution Companies (EDC) purchase power from Energy Generation Companies (EGC)
PJM is also responsible for charting future requirements of the grid and its users. It makes recommendations to its members, the EDCs and EGCs, regarding how to best meet these requirements. It is the principal link between the state regulated EDCs and the non-regulated EGCs. PJM is a non-profit corporation.
The Generation Attribute Tracking System (GATS) of PJM Environmental Information Services (EIS) has been instrumental in finding out trends including the growth of solar, captured methane, hydro, wind, and other renewable resources of production within PJM. The GATS has shown that based on the number of certificates generated, from 2005-2015, wind production has increased around 4,000%. In 2005, solar energy generation stood at 100 MWh, and increased to 81,000 MWh in 2009, which is a growth of 3,000%. In 2015, it stood at 2,900,000 MWh, a growth of 29,000% in a decade. Source: pjm EIS
In normal markets, supply and demand are the key drivers. A good deal of the growth of the renewable energy industry has been driven by regulation and government subsidy. So, conventional market drivers appear to be misaligned.
Of note is that renewable energy for the foreseeable future will continue to be an incredibly small part of power generation. What role will natural gas play in the future of our energy mix? I think it will have a significant impact on Pennsylvania because of the Marcellus Shale formation. Nuclear power could also grow at a significant rate should much smaller, localized nuclear power plants be developed that would enable cities and industrial sites to have their own sources of energy. Source: MIT Technology Review
Why Incentives and Taxes? Externalities
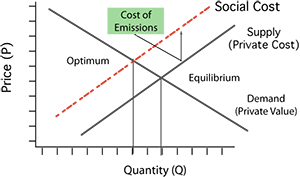
From our reading, we have seen that there are market failures in our energy industry, both from the negative externalities of emissions (greenhouse gases, SOx and NOx, and aerosols) and from the positive externalities of using SECS technologies that provide carbon neutral energy.
In the presence of a positive externality, the social value for a good exceeds the private value. Government policies can correct this form of market failure by subsidizing the good. In the presence of a negative externality, the social cost exceeds the private cost. Policies can be implemented to correct this market failure by taxing the emissions of Pigovian tax).

Examples of Past Government Incentives
After reading Pfund and Healey (2011), we should see that other energy sources displayed a higher social value in their own time. At the time of the late 1700s, coal was perceived in a similar fashion to our solar energy technologies like PV in the 1970s when it had several detractions, such as its bulk that made coal difficult to transport. States provided tax exemptions and incentives to move coal along, such that it surpassed timber as an energy resource in the late 1800s.
"Nature made coal abundant, policy made it cheap." p. 14
(cited from Sean Patrick Adams, The Journal of Policy History Vol. 18, No. 1, “Promotion, Competition, Captivity: The Political Economy of Coal” (2006)).
Self-Check
References:
Modified from ENGR 312, Sustainable Energy Entrepreneurship, by Wieslaw Grebski, Shaobiao Cai, and Christopher Flynn;
Penn State Hazleton. Accessed May 2013.