
Try This! - Print a Sunchart.
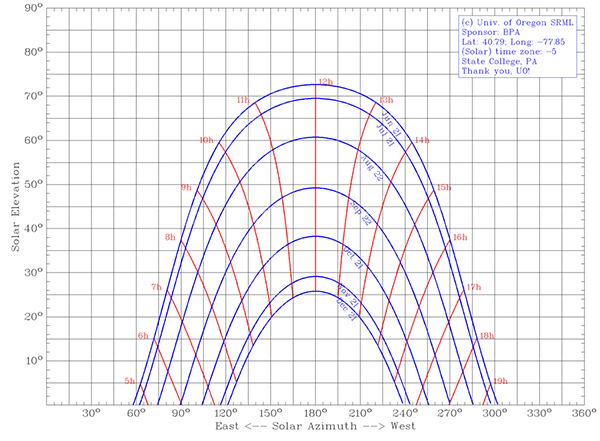
Go to the University of Oregon Solar Radiation Monitoring Laboratory web page and generate a PDF SunCharts for two locations: (1) State College, PA, and (2) your own location.
1. Download the PDF chart for the orthographic (Cartesian) projection
2. Download the PDF chart for the polar projection
3. Reflect on the charts:
- Can you find key solar days on the chart (equinoxes, solstices)?
- Can you identify sunrise and sunset solar times for different months?
- How does the position of sunrise and sunset vary throughout the year?
- How are these charts different between your location and State College, PA?
Now, based on your understanding of the SunCharts, work through the self-check questions below. While you work through these steps, try to think about all the calculations that went into each plotted point on the curves. You should reflect on the fact that the SunChart tool is simply plotting points and lines based on solar calculations of time and longitude. The same calculations that you are mastering now in class. Pretty exciting!
Self-Check Questions - based on the SunChart for State College, PA
Answer the same questions for your own locale. Are the answers different or the same compared to State College, PA?