3.15. Learning Activity: Clear Sky Model
Clear Sky Model and Measured Irradiance Data
The following readings will be helpful for completing this lesson activity.
Readings:
- SECS, Chapter 6 - Sun-Earth Geometry
- Supplemental: SECS, Chapter 8 - Measure and Estimation of the Solar Resource
Especially:
- pp. 159-161 of Moments, Hours, and Days [Ch 6] (see a breakdown of Equation 6.19 for I0)
- p. 217: Empirical Correlations for Components [Ch 8] (see Fig. 8.5)
- p. 221: Clearness Indices and Climate Regimes [Ch 8]
- p. 226: Diffuse Fraction [Ch 8] (Eq. 8.24 is related to hourly components)
Tasks
The goal of this activity is to use the BIRD Clear Sky Model to predict the solar irradiance at a specific time at a specific locale and further compare those predictions to actual irradiance measurements.
So there are two main tasks in this activity:
- Download and learn how to use the Bird Clear Sky Model (predicted irradiance)
- Download and plot the SURFRAD Measured Data (measured irradiance)
These two tasks will be performed for a specific date - July 31, 2007 (in this assignment) for the specific locale - SURFRAD Meteorological Station at Rock Springs, located just outside State College, PA.
In the end, you will need to assess how the modeled (predicted) and measured data fit and provide some discussion on it.
Part 1. Bird Clear Sky Model - Instructions
The Bird model is an old but advanced clear sky model used by solar professionals to estimate clear sky conditions at a locale. The clear sky model for a horizontal surface is the basis for almost all modern comparisons of "ideal skies" to actual skies (with clouds and dynamic light interference effects). You will see what the global, beam horizontal, and diffuse components of solar light should look like when you set the meteorological parameters affecting the sky clearness. The model could also provide DNI (Direct Normal Irradiance), which would show irradiation values higher than the global horizontal values for the mornings and evenings.
- Go to http://rredc.nrel.gov/solar/models/clearsky/ [1] to download the Bird Clear Sky Model. It is a free download, and the tool comes in the form of an Excel spreadsheet. I suggest that you rename the original file for any case study you perform further.
- Study the instructions on the spreadsheet to learn how to use the tool and make a note of the input and output parameters.
- Modify the inputs for the State College, PA, locale. The following parameters can be obtained from the SURFRAD site (see part 2):
- Latitude 40.72
- Longitude -77.93
- Time zone UTC -5
- Pressure (mbar) - average for the day
- Aerosol optical depth (AOD)
Note: access the AOD data through this graphical page [2]. Take the daily average as input for the Bird model. In this case, 415nm AOD can be used as a proxy for 380nm AOD input and 500nm AOD data can be used as is.
- You can leave other inputs at their default values
- Expand the spreadsheet (as explained in the instructions) to generate output for the entire year, then extract the data for July 31st (day # 212) and copy values to a separate file.
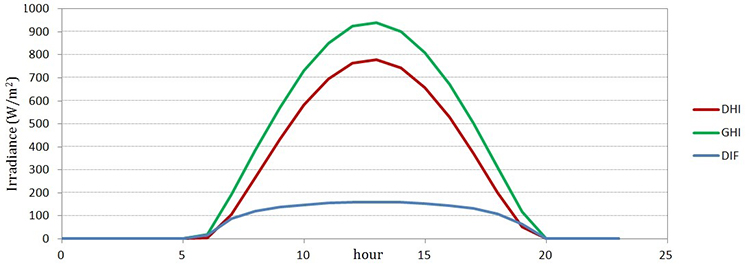
- Plot global horizontal irradiance (GHI), direct horizontal irradiance (DHI), and diffuse horizontal component (DIF) versus time for the day
The model plot will look similar to the one below. This is what you need to produce.
Part 2. SURFRAD data - Instructions
The SURFRAD site at Penn State collects real-time data for solar irradiance (using local pyranometers) and a number of other atmospheric parameters at 3-minute time intervals. These data are accessible through the Earth System Research Laboratory website [4]. This site provides you with access to data collected at the Penn State location. For each year, you can open the parent directory with .dat files, which are named by the day number. So if you are looking for July 31st, for example, that will be day #212, so check the file psu07212.dat.
Your goal will be to make sense of these data, extract your irradiance values and plot them versus time of the day.
Here are the data labels in order that correspond to the numbers in the .dat file (omit 0-value columns):
Year, jday, month, day, hour, min, dt (decimal time), zen (degrees), dw_solar (W/m^2), uw_solar (W/m^2), direct_n (W/m^2), diffuse (W/m^2), dw_ir (W/m^2), dw_casetemp (K), dw_dometemp (K), uw_ir (W/m^2), uw_casetemp (K), uw_dometemp (K), uvb (mW/m^2), par (W/m^2), netsolar (W/m^2), netir (W/m^2), totalnet (W/m^2), temp (degC), rh (%), windspd (m/s), "winddir (degrees, clockwise from north)", pressure (mb)
From this list, you will specifically need:
dt (decimal time) - your time coordinate for data plotting (Column G in MS Excel)
dw_solar - Downwelling global solar (W/m^2) = corresponding to Global Hz (GHI) in BIRD model (Column I in MS Excel)
netsolar - Net solar (W/m^2) = corresponding to Direct Hz (DHI) in BIRD model (Column AG in MS Excel)
diffuse - Real downwelling diffuse solar (W/m^2) = corresponding to Dif Hz (DIF) in BIRD model (Column O in MS Excel)
Also, 'pressure (mb)' - the last value in each array of data - daily average should be used for your Bird model input (Column AU in MS Excel).
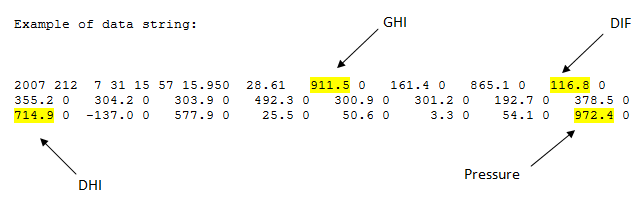
2007 212 7 31 15 57 15.950 28.61 911.5 0 161.4 0 865.1 0 116.8 0
355.2 0 304.2. 0 303.9. 0 492.3 0 300.9 0 301.2 0 192.7 0 378.5 0
714.9 0 -137.0 0 577.9 0. 25.5 0 50.6 0 3.3 0 54.1 0 972.4 0
911.5 = GHI
116.8 = DIF
714.9 = DHI
972.4 = Pressure.
To treat the data, you can either convert the .dat file to a spreadsheet (see video in Canvas Module 3 how to!) or, if you have programming skills, you can create a script to plot the irradiance data versus time.
Important Note: you may notice that the "0" decimal time in the .dat file does not correspond to the actual local midnight, but rather corresponds to Greenwich 0:00, so you may need to synchronize decimal time with the Bird model to make the calculated and measured curves match.
Comparison and discussion of the results
- Plot the Bird model data and SURFRAD measured data for GHI, DHI, and DIF types of irradiance on the same diagram. You should get a pretty close match. You may notice by visually comparing the curves, that even on a clear day, the real sky shows dynamic variations in irradiance in the diffuse component.
- Provide a discussion of the results and comment on the possible discrepancies.
Submitting Your Work
Prepare a written report including the following:
- Table of input parameters for the Bird model (left side of the Bird spreadsheet)
- Diagram with irradiance data comparison (Bird model vs. SURFRAD data points)
- Discussion of results.
Save your report as .docx or PDF and submit to the Lesson 3 Activity - Clear Sky Model dropbox in Canvas.
Grading Criteria
Please see the grading rubric in Canvas
Deadline
See the Calendar tab in Canvas for specific due dates.