
There are many different types of configurations of solar concentrators, ranging from cylindrical that focus on a line (tube) to circular that focus on a point (power tower). As was already mentioned, the main purpose of these configurations is to increase the radiation flux on the receiver, and that effect is achieved through reflection of light from multiple anlged or curved mirror surfaces. Figure below provides schematics of several common types of concentrating collectors.
The light concentration process is typically characterized by the concentration ratio (C). By physical meaning, the concentration ratio is the factor by which the incident energy flux (Io) is optically enhanced on the receiving surface (Ir) - as shown in the Figure below. So, by confining the available energy coming through a chosen aperture to a smaller area on the receiver, we should be able to increase the flux.
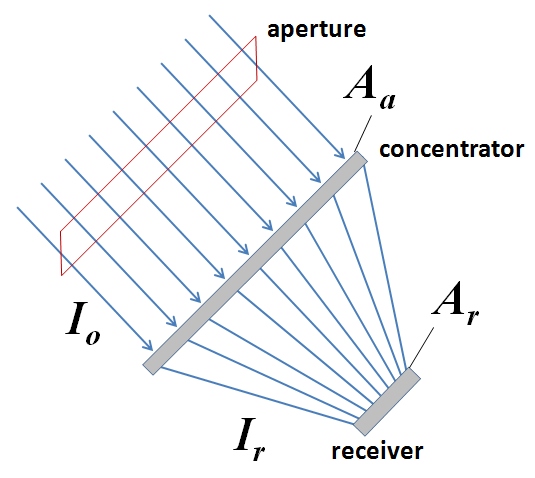
The ratio of area of the receiver to the area of the aperture, Cgeo = Ar/Aa is called the area concentration ratio (in some sources also called geometric concentration ratio). It is easy to use, as the areas of the devices are known, although it is adequate only when the radiation flux is uniform over the aperture and over the receiver. Also, please note that for some imaging concentrators, the area of the available receiver surface can be different from the area of the image produced by the concentrator on the receiver. So, if the image does not cover the entire surface of the receiver, we need to use the image area to estimate the concentration ratio.
The concentration ratio can be also represented by the energy flux ratio at the aperture and at the receiver. In this case, it is termed flux concentration ratio Copt (in some sources - optical concentration ratio) and can be directly applied to thermal calculations.
In case the ambient energy flux over the aperture (insolation) and over the receiver (irradiance) is uniform, the geometric and optical concentration ratios are equal (Cgeo = Copt).
The concentration ratios are important metrics used to characterize and rank optical concentrators. There is a theoretical limit to solar concentration. For circular concentrators - 45,000, and for linear concentrators - 212, based on the geometrical considerations; however, these limits may be unreachable by real systems because of non-idealities and losses. In general sunlight, concentration systems are roughly classified into: low concentration range (C<10), medium concentration range (10<C<100), and high concentration range (C>100). However, only some of the systems provide uniform concentrated light flux (e.g., V-troughs or pyramidal plane reflectors) and can be characterized by a single concentration ratio. Many systems with curved reflecting surfaces (e.g., conical, parabolic, spherical) create a distribution of flux density over the receiver and would rather be characterized by a variable C over the receiver width. In that case, a local concentration ratio (Cl) is the main parameter to characterize the performance of the ideal concentrator:<100),>
where I(y) is determined for any local position y from the center of the produced image, and Iap is the intensity of the incident radiation at the aperture.
In many typical cases of imaging concentrators, the reflectance of the surface (ρ), i.e., the fraction of light radiation reflected from the surface compared to the total incident radiation, is also taken into account. Then the local intensity of the concentrated light, I(y), can be described as follows:
Next we are going to refer to the following text to learn more about the optical and thermal performance of concentration collectors.
Reading assignment
Book chapter: Duffie, J.A. Beckman, W., Solar Engineering of Thermal Processes, Chapter 7: Sections 7.1-7.4.