Lesson 9: Industrial Processing Requirements
The links below provide an outline of the material for this lesson. Be sure to carefully read through the entire lesson befor returning to Canvas to submit your assignments.
9.0 Introduction
In several specific industry sectors, such as food, wine and beverages, transport equipment, machinery, textiles, pulp and paper, the share of heat demand at low and medium temperatures (below 250°C) is around 60%. Tapping into this potential would provide a significant solar contribution to industrial energy requirements.
— SHC Task 49 2013 Highlights
Global industrial processes have significant thermal energy needs that are addressable by solar thermal energy conversion systems. Any industrial process that requires heat at temperatures below 250°C is readily addressable by a solar thermal energy system. Systems that require higher temperatures are also addressable by solar thermal solutions, but the costs for such systems at small and medium scales are prohibitive. There is more to it than simply the temperature; but, at first glance, using temperature thresholds as a guide enables a rapid assessment of global potential.
Learning Objectives
- Match industrial processes with appropriate solar thermal technologies based on process parameters and inputs.
- Calculate industrial processing system requirements.
- Apply basic cost analysis to the solar thermal system in industry applications.
What is due for Lesson 9?
This lesson will take us one week to complete. Specific directions for different assignments are given in the table below and within this lesson pages.
| Tasks | Assignment Details | Access/Directions |
|---|---|---|
| Readings |
Required:
Supplementary: |
|
| Discussion | Topic for this lesson discussion is provided in Module 9 in Canvas | |
| Assignment | Problem set on solar thermal applications in industrial processes. | Specific directions for this assignment are provided on the respective page of this lesson. |
| Quiz | 10 multiple choice questions closely related to lesson readings | Registered students can access the quiz in the Lesson 9 Module in Canvas. |
Questions?
If you have any questions, please post them to our Questions and answers discussion forum in Canvas. I will check that discussion forum daily to respond. While you are there, feel free to post your own responses if you, too, are able to help out a classmate.
9.1. Overview of Solar Heat for Industrial Processes
Industries all over the world use heat. Heat is heat, whether it comes from solar radiation or from fossil fuel combustion. Using solar thermal systems for generating heat for industrial processes is a very attractive avenue since it allows significant reduction in fuel costs and decreases environmental impact due to carbon emissions. Another reason is that a wide range of industrial applications require temperatures from near-ambient to those corresponding to low-pressure steam (<400 oC) - the range that fits very well the output temperatures of solar thermal collectors. So why not switch?
The key difference is the dispatchable nature of fossil fuels. Solar heat must be stored to achieve some level of dispatchability, or the industrial process that uses the heat must be flexible to adjust and only use the heat when the solar resource is available. Most often, some combination of a small storage solution along with modifications to the industrial process is the best solution.
At present ~40% of industrial primary energy consumption is provided by natural gas and ~41% by petroleum. So there is a technical potential to increase the share of solar thermal heat and possibly reach the solar thermal deployment in the industrial sector of 33% by 2030 (IRENA, 2015).
Many industries can be potentially benefitted, including but not limited to:
- Chemical processing
- Food production
- Beverage production
- Paper making
- Tanning
- Malt processing
- Desalination
- Textile
- Paint drying
- Masonry curing
- others..
The two key factors to consider in determination of the most suitable solar system for supplying energy to an industrial application are temperature and thermal medium. How much heat does the thermal fluid need to carry? What is the best type of fluid to use in the process?
For example, if hot steam is needed to operate an application, the solar system needs to be designed to deliver temperature significantly over 100 oC, and therefore concentrating collectors will be probably required. Or if hot water is needed (e.g. for such applications as desalination or sewage treatment), liquid-based flat plat collectors can be employed.
Learn more details on the status of solar energy implementation in different industries in the following report prepared by International Renewable Energy Agency:
Reading Assignment:
Report: Solar Heat for Industrial Processes [1], IEA-ETSAP and IRENA© Technology Brief E21 – January 2015. (29 pages)
9.2. Economic Aspects of Industrial Solar Heat
One of the key economic impacts expected from the solar heat applications is fuel deduction costs. While deploying solar collectors involves additional up-front capital costs, the operational costs are much lower compared to fuel-fired units. However, due to reliability requirements, auxiliary energy supply is still typically included in industrial applications. In this case, the useful energy from the solar system is used to reduce the auxiliary fuel consumption.
Solar thermal systems are relatively high in capital costs compared against alternative thermal energy systems. However, the solar fuel is free. As such, the cost structure is inherently different from low capital cost but relatively high and often volatile fuel costs associated with petroleum, coal, natural gas, and other fossil fuel thermal energy systems. So another attractive aspect of solar thermal systems, and one of the primary drivers behind their growing installations worldwide, is the insulation that such systems provide against price shocks of fossil fuels.
For industry, taking into account depreciation rates over the long-term projects is important. In this connection, discounted cash flow analysis is a good tool to estimate the Net Present Value (NPV) of the project and realistic pay-back time. Those metrics are initially used to evaluate the economic viability of the project.
Let us recall what Net Present Value (NPV) is. In brief, NPV is the current value - as of today - of all related cash flows through the time of the project. Because $100 today is worth more than $100 next year (due to inflation rate), expenditures that will occur in the future are not valued as much as the same expenditures occurring today. This is why cheap natural gas boilers often appear as an economic choice in the light of the high capital cost of a solar thermal energy systems. Below we review the basic methods of calculating NPV.
Simple payback approach
This approach is suitable for short-term projects with quick return on investment. In this case, discounting (for money value declining over time) may be unnecessary.
In simple payback evaluation, all cash flows into and out of the project are added up to find Net Present Value (NPV). That includes initial cost (capital investment), annuities (net utlility obtained from the operation, i.e. renevue minus maintenance and operation costs), and salvage value (in the end of the project) (Vanek and Albright, 2008):
NPV = Initial Cost + S(Annuities) + Salvage Value
- If NPV is positive, the project is considered financially viable.
For example, consider a hypothetical technology project with the initial cost of $100,000, net positive annuity of $20,000 for 10 years, and a salvage value in the end of that term of $5,000. Then, its net present value can be calculated as:
NPV = - 100,000 + (10 years x 20,000) + 5,000 = $105,000
The positive NPV value indicates that the project is financially viable.
The break-even point, i.e., the year when the sum of annuities surpasses the initial cost, and the initial expenditures have been paid back, is characterized by the Simple Payback Period (SPB):
SPB (years) = Initial Cost / Net annuity
- SPB indicates the number of years after which the initial expenditures are paid back.
For the case described above:
SPB = $100,000 / $20,000 = 5 years
Capital Recovery Factor (CRF) evaluates the relationship between the cash flow and investment cost. This evaluation is applicable to short-term investments (within N=10 years).
CRF = ACC / NPV
where ACC = Annual Capital Cost
ACC = Annuity – NPV/N
Here, the NPV/N term is the average share of the net present value per each year of the project. So, ACC is the part of the annuity that goes each year to cover the investment; it does not go towards profit.
For the hypothetical project example described above, we can calculate:
ACC = $20,000 – $105,000/10 = $9,500
CRF = $9,500 /$105,000 = 0.09 (9%)
- CRF factor should not be too high for a project to be considered financially viable.
By recommendation of the Electric Power Research Institute (EPRI), CRF value should not exceed 12%.
Discounted Cash Flow Analysis
This approach is better applied to long-term projects with slow payback. Money value declines over time, so it must be taken into account. This is especially relevant to solar projects, which typically have high capital costs and long pay-pack periods.
In the case of discounted cash flow, we need to evaluate how much any cash flow element would value in the future. That would depend on the interest rate (i) imposed on initial investment and the number of years (N) the project is underway. The following conversion factors are used to adjust the future money values (Vanek and Albright 2008):
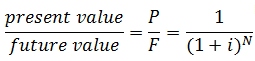
and
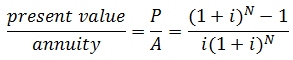
Then the discounted flow NPV can be derived as follows:
NPVfuture = Initial cost + (P/A) × Annuity + (P/F) × Salvage value
For the example used in simple payback approach section above, if the interest rate on the initial investment is set at 5%, the conversion factors for 10-year project can be calculated as:
(P/F, 5%, 10) = 0.614 and (P/A, 5%, 10) = 7.722
And the discounted NPV future value can be found as:
NPVfuture = Initial cost + (P/A) × Annuity + (P/F) × Salvage value =
= -100,000 + 7.722 × 20,000 + 0.614 × 5,000 = $57,510
Here, when depreciation is taken into account, the NPV value is much lower than that in case of simple payback assessment. But the NPV of this project is still positive, indicating that the project is economically viable.
Supplemental Reading:
Vanek, F.M. and Albright, L.D., Energy Systems Engineering, McGraw Hill, 2008. Chapter 3. Economic Tools for Energy Systems.
In case of solar system providing heating for a facility or a process, the generated thermal energy is not sold to create monetary revenue, but instead is accounted in energy savings. So amount money saved per year can be assigned as monetized benefit.
Example
Let us estimate the NPV values for a hypothetical solar collector system of total area 10 m2 designed to offset the thermal energy expenditures of a building. Assume the system cost estimated at $725 per m2 of collector surface. This includes cost of collector, associated storage, pumps, and piping. Also assume that the yearly energy savings from the solar system are 7500 kWh, and the monetary value of energy is $0.16 per kWh (this is how much the consumer would need to pay for electric water heating if the solar system is not employed). Would this system be viable over the term of 15 years? or 10 years?
Based on these parameters and assumptions, the total system installation cost will be $725/m2 x 10 m2 = $7250. We can neglect possible maintenance or repair costs in this example. So this will be the total investment.
Then, the monetary value of the saved energy will be: 0.16 $/kWh x 7500 kWh/year = $1200. This is how much annuity (in terms of energy saving) the system brings.
To assess the economic viability, first we can use the simple payback check:
NPV = - 7250 + (1200 x 15) = $10,750
This is a positive value, therefore the project makes economic sense. However, depreciation rate is not taken into account here. If we assume that depreciation is 5% (and this is how much interest will be put annually on the initial investment), we can estimate the discounted NPV as follows:
NPVfuture = Initial cost + (P/A) × Annuity + (P/F) × Salvage value
where the (P/A, 5%, 15) factor is equal to 10.38 (if you apply the above-mentioned formula). The (P/F) factor is not needed in this calculation because we are not considering any salvage value. So finally:
NPVfuture = - 7250 + (10.38 x 1200) = $5,206
This is again a positive value, so with the current economic conditions, the project is considered viable.
Self-check
Now perform the same NPV calculation for a 10-year term and a 5-year term. What do these results tell us?
Simple payback: NPV = $4,750
Discounted: NPV = $2,016
Although the value is positive, it is much lower now than in 15-year case. Is it positive enough?
As an additional step, we can check CRF value. In this case it comes to 15% which is too high to make the investment financially attractive.
Simple payback: NPV = -$1,250
Discounted: NPV = -$2,055
With negative NPV values, this project is not considered viable over 5-year term.
Another thing to consider in the economics of the solar heat - industrial process combo is investment tax credits. Those incentives effectively reduce the up-front capital costs and may create a more favorable economic scenario and allow solar to compete with relatively cheap fossil fuel heat generation. So if available in specific location, tax credits should be included in the cash flow analysis.
9.3. Industrial Process Applications and Requirements
The use of solar heating technologies can be linked to a variety of industrial applications and can replace significant amounts of fossil fuels burned in the process. The potential is high since about 30% of industrial heating demand is withing the range of solar thermal systems. Typically solar heat is supplied via heated water, steam, or air.
Industrial heating needs can be categorized into three main temperature ranges:
(1) < 80oC - low temperature - flat plate solar collectors are capable of meeting these temperatures;
(2) 80 - 250 oC - medium temperatures - concentrating collectors are needed;
(3) >250 oC - high temperatures - this range requires imaging concentrated systems to achieve such high temperatures.
All of these categories can be matched with solar systems.
For learning about some specific applications and system designs, you are now re-directed to the following textbook chapters:
Reading Assignment
Duffie, J.A., and Beckman, W.A., Solar Engineering of Thermal Processes, Wiley and Sons, 2013, Chapter 16, Sections 16.4- 16.8 (13 pages).
9.4. Assignment
The Solar Heating and Cooling Program of the International Energy Agency is documenting the majority of solar thermal projects in a database [4]. Understanding system components and how external forces, such as policy and alternative fuel costs, impact decision is critical to being effective in the sector of industrial processing.
This assignment is a series of short answer problems and calculations. These problems will require both conceptual thinking and some quantitative operations.
Lesson 9 Problem Set:
1. Take a look at Figure 16.6.1 in the D&B text. Why would a system be designed with a flat plate collector in series with a concentrating collector? Please discuss at least two benefits of this configuration.
2. Equation 16.4.1 in the D&B text says that the useful energy gain (Qu) of an open-circuit air heating system is proportional to the area of the collector (Ac), how much heat is removed from the system (FR) based on fan speed, and how much solar energy is incident on the collector minus optical losses (S). Check out a project in Germany of an air heating system for a vehicle paint shop [5]. Which of the three variables (Ac, FR, S) that impact Qu must be increased if the system owner wanted to supply air to a second paint room? Why?
3. There are several ways that a solar thermal energy system’s capital cost can be paid back within a reasonable time frame. Tax credits, other tax benefits such as depreciation, high alternative fuel costs (including a carbon tax), and more. Download the Lesson7-STE-Payback.xlsx file from Canvas in the Lesson 7 Module. If you do not have access to Microsoft Excel or an equivalent spreadsheet editor, use Google Drive (Upload the file to drive.google.com, check the box next to the file once uploaded to drive, then click More>Open with>Google Sheets). In that spreadsheet, there are several cells highlighted in green that are the input cells to the payback calculator. Adjust any/all of those values appropriately to achieve a system payback period less than 10 years. Your adjustments should match a specific project that actually exists (e.g., from the solar thermal projects [2] database), including location specific details such as annual solar resource. Policy related adjustments (tax credits, carbon tax, etc.) should be based on real policies for your location. If you are not able to find actual policies for your location, policies from other locations are okay to use if necessary. All policy related adjustments must be supported by references. Deliverable: a write-up describing the project you are assessing including a table of your adjustment values, an exported payback graph from the spreadsheet, and written justification (including references) for each of the values that you selected.
Deliverable
Submit completed problems in a single pdf file to the Lesson 9 Dropbox in Canvas by 11:55PM on Wednesday. Please check Canvas Calendar for specific deadlines.
9.5. Summary and Final Tasks
Summary
Solar heating for industrial processes is one of the largest potential markets for solar energy. However, unlike the photovoltaic industry, the solar heating for industrial processes has yet to really take off. In addition to being one of the largest potential markets for solar energy, solar thermal systems are really fundamental to the field of solar energy conversion systems. Not only are flat plate collectors comprised simply of pipes, black, and glass (technologically simple), but also the concept of absorbing solar radiation as heat has been around for thousands of years. It is about time that we start to make solar heating for industrial processes really work. The opportunity is very large.
Reminder - Complete all of the Lesson 9 tasks!
Double-check the to-do list on the Lesson 9 Introduction page [6] to make sure you have completed all of the assigned tasks before you begin Lesson 10.