Lesson 8: Concentrating Solar Power Strategies
Overview
Overview
Lesson 8 will cover a few important issues related to planning the large-scale CSP facilities. As we have already understood, performance of solar systems is very dependent on the locale, weather, and other physical conditions. Therefore, selection of a good site for a CSP project is a strategic step to take in order to ensure that the technology performs to its potential. So, criteria to consider in site selection are addressed in this lesson. Next, we will take a look at some factors in the social and economic spheres that pertinent to success of the solar projects. Finally, this lesson also touches upon the life cycle assessment of the CSP technology - LCA study examines a variety of metrics, which help to constrain the project with available resources and produced environmental impacts. In this lesson, you will be assigned to learn from a couple of published papers which present different methods of project assessment. Also, a lesson activity done in SAM software will give you some practical exercise with system parameters.
Learning Outcomes
By the end of this lesson, you should be able to:
- understand the prerequisites for location of a CSP plant;
- demonstrate the basics of the feasibility analysis for CSP systems;
- define the key metrics used in socio-economic and environmental assessment of the CSP projects;
- generate CSP system performance data in SAM software.
Readings
Report: Stoddard, L., Owens, B., Morse, F., and Kearney, D., New Mexico Concentrating Solar Plant Feasibility Study [1], Report to New Mexico Energy, Minerals and Natural Resources Department, 2005.
Journal article: Lechon, Y., de la Rua, C., and Saez, R., Life Cycle Environmental Impacts of Electricity Production by Solarthermal Power Plants in Spain [2], J. Solar Energy Eng., 130, (2008).
Journal article: Caldes, N., Varela, M., Santamaria, M., and Saez, R., Economic impact of solar thermal electricity deployment in Spain [3], Energy Policy 37, 1628-1636 (2009).
8.1. CSP site selection and feasibility analysis
8.1. CSP site selection and feasibility analysis
Solar energy systems rely on the natural solar resource, which is unevenly distributed over the planet. Clearly, some locations may be considered very favorable for harvesting sunlight, while others - much less favorable for a number of reasons. Choice of the CSP development site has therefore a strategic importance for the long-term feasibility of the project. Meteorological availability of sunlight is the first, but not the only, limitation to be considered when planning a CSP site development. One should also look at the physical geography of a potential site, available land area, available infrastructure, energy market, political and social situation. All these factors, being location-specific, can have a critical influence on the success of the CSP development in the area. In essence, the project development approach to CSP is no different from other project developments, such as those involving conventional fossil fuel power plants, photovoltaic solar, wind, etc. However, CSP has its own specific features that require special knowledge when site selection and feasibility study are performed.
Any site targeted for CSP should be carefully examined with respect to the key criteria. The most important of them are listed below:
- Direct normal irradiance (DNI). This is the amount of solar radiation received by a unit area that is perpendicular (i.e., normal) to the incoming sun rays. DNI converts to energy, which, in turn, converts to monetary return from the project. It is generally believed that DNI should be at least 2000 kWh/m2 per year to provide a viable energy yield [Lovegrove and Stein, 2012]; however, the threshold would depend on the local market, and should be assessed individually for each case. The accuracy of the DNI data is very important for estimating predicted energy output from the future plant. It is recommended to perform on-site DNI measurements for at least one year to characterize a complete seasonal cycle.
 Figure 8.1. World map of DNI.Credit: SolarGIS © 2014 GeoModel Solar. Refer to the SolarGIS [4] website to get the DNI maps for specific locations.
 - Available land area and topography. These conditions are different for different CSP technologies. For example, parabolic trough setup tolerates up to 2o slope, while Fresnel reflector systems can tolerate up to 5o slope. Solar tower systems can accommodate more variegated topography as long as the slopes properly support the arrangement of the heliostats. Typically, utility scale CSP plants requires substantial area of open land (~ 2-5 km2) free from obstructions. Typical land use by CSP plants was estimated by NREL at ~40,000 m2/MW [NREL, 2013].
- Soil and subsoil structures. The land should allow some leveling works to be performed. This requires the analysis of soil and rock conditions. Some soft soils may be unstable and undermine the alignment of optics; so, it may need to be replaced. Rocky formations underneath may bring extra costs for leveling works.
- Weather profile. Long-term data analysis of meteorological and satellite data helps to create predictions for the cloudiness in the area over the system lifetime. Also, strong tendencies for rain, water run-off, or flooding may have effect on site topography. Strong winds may have a direct impact on power generation since they create vibrations and deformations on concentrators and thus affect sunbeam focusing precision. Some sites benefit from wind-breaking barriers and other mitigation measures. Dry bulb and wet bulb temperatures are assessed to define the achievable cold-end temperatures of the power plant. This has effect on the steam turbine efficiency.
- Local water resources. Water is needed for CSP plants first of all as the cooling agent for steam turbine condenser. Both subsurface and surface water can be used. However, the locations with highest DNI are typically arid areas (e.g., deserts), where water is scarce. Associated need for water use authorization may become an additional obstacle for site approval. Other water use includes service, mirror cleaning. Water-steam cycle requires demineralized water, which would require an additional on-site water treatment plant.
- Grid connections. The power produced must be delivered to customers, so the connection to the high voltage electricity line is necessary. CSP plants of 20 MW and above capacity usually use the lines in the range of 60-400 kV. The distance to the grid should be minimal to avoid additional investments for power transmission. If auxiliary routes for power transmission need to be constructed, authorization and environmental concerns should be addressed up front.
- Proximity of roads. Roads are needed at the stage of plant construction for transport of materials and equipment to the site. Further, at the operation stage, access roads become permanent structures.
The simultaneous analysis of the multiple factors make the site assessment a complex iterative process. The main successive phases of this process are illustrated below (Lovegrove and Stein, 2012):
1. Market Analysis
- Analysis of interest and suitability of CSP
- Identification of targeted markets
2. Regional Stud and Site Identification
- GIS data assessment: is DNI promising for this region?
- Infrastructure analysis for the main phases of the project
- Finding potential sites for the project
- Identification of CSP technologies and technical concept
3. Feasibility Analysis
- DNI assessment / measurement
- Identification of potential fatal flaws, risks
- Geotechnical and topographic site assessment
- Detailed economic analysis / financial modeling
- Socio-economic analysis
4. Project Qualification
- Expert assessment of solar resource and yield
- Environmental impact assessment
- Geotechnical and topographic survey
- Obtaining permits and authorizations
- Contract negotiations
- Obtaining equipment price quotes
5. Contract Closing
- Completion of legal steps
- Risk assessments
- Construction contract
- Equity and debt agreements
Each subsequent stage in the above scheme requires more specific information and additional expertise. This process of site characterization and selection is to some extent illustrated in the report by Stoddard et al. (2005) - the study that considered various alternatives for CSP plant development in New Mexico:
Reading Assignment
Report: Stoddard, L., Owens, B., Morse, F., and Kearney, D., New Mexico Concentrating Solar Plant Feasibility Study [1], Report to New Mexico Energy, Minerals and Natural Resources Department, 2005.
Please read Section 3.0 of the document. Especially pay attention to Table 3-1, which provides a comparative matrix for nine different sites with potential for CSP development.
Water considerations
The water use strategy at the CSP facility is one of the keystones of the project, as it would influence many other factors and choices and may become a go/no-go tipping point for the project. This is because water shortage is being identified as a severe environmental problem in many regions, and, therefore, is subject to strict environmental regulations. So, let us take a closer look at the water requirements in CSP systems and associated technological options.
The biggest consumption point of water in CSP is cooling for the steam turbine condenser. Cooling systems can utilize both salt and fresh water, which can be taken from both surface and subsurface reservoirs. Agreement on water withdrawal should be reached prior to the project start, and that should be part of the project feasibility analysis. There are wet-cooling and dry-cooling systems. The wet cooling usually implies using a cooling tower, and that is the most efficient technology for cooling as long as water is affordable and continuously available for plant operation.
If you are not familiar with those, watch the following video (3:16) to see how they work:
Video: How Cooling Towers WorkV (3:16)
Cooling towers are devices used to transfer heat or cool water for reuse.
The basic operation is fairly simple. Hot water is pumped in from an outside source and sprayed into the tower. The hot water flows over what is called the fill. This spreads the water over a larger surface to allow for more cooling. Cool air flows over the fill, which transfers more heat through evaporation. The heat exits the tower, and the now cooler water gathers in the basin. This cooler water is then pumped back into the system to be used again.
Cooling towers are just one part of the cooling system. In this lesson, we will cover the basic process of how a cooling tower works, define the components, and describe their purposes, and we'll also cover some common terminology that is used when discussing cooling towers.
Within a cooling tower, you will see the use of plastic or wooden slats. These are called fill, and are used to direct the flow. The purpose of this is to increase the area of contact between the hot water and the cooler air.
There are two types of heat loss that occur in this process, sensible heat loss and evaporation. Sensible heat is what can be felt or measured. Evaporation accounts for the majority of the heat transfer and is the most critical aspect of the entire process.
Many factors can affect the efficiency of the evaporation in a cooling tower. Things such as relative humidity, outside temperature, and wind velocity can affect the efficiency. Even the design of the tower, water contamination, and outside equipment will also play a part.
Cooling towers are classified by how airflow is produced. This allows them to be broken down into two categories, atmospheric and mechanical draft. These two will be covered in detail in a separate video, but for now here's a quick description.
To see the rest of this video and many more, please visit us at CTESkills.com.
However, cooling towers use up to 85-90% of all process water. When water is in short supply, dry-cooling systems can be an alternative. Dry-cooling systems use ~10 times less water than wet cooling systems do; even truck-based supply may suffice. However, from an economic point of view, dry cooling systems are less beneficial. In dry cooling systems, air is used as heat transfer medium, and air has much lower heat transfer coefficient than water. Furthermore, the cooling effect of evaporation, which is the core mechanism of cooling in cooling towers, is not available. This results in lower efficiency of the water-steam cycle. Another drawback of the dry-cooling systems is additional power consumption by fans blowing air for cooling. For the above reasons, the wet-cooled projects have an economic advantage over dry-cooled projects. The decision involving the trade-off of water versus energy is to be made individually in each particular case based on available resources. One of the compromise options for water use is hybrid cooling tower, which combines dry cooling and wet cooling. In this technology, water is sprayed on the condenser allowing for evaporative action, but the water consumption is significantly lower compared to conventional wet cooling method.
According to water use estimation by Andrew Eilbert (Worldwatch Institute), on the average, CSP plants use only 120 Gal of water per megawatt-hour of energy. For comparison, this number is lined up against typical values for other types of power plants in Table 8.1. [Eilbert, 2010]. Visit the WorldWatch website [6] for specific data on water use by different CSP plants in California.
| Type of power plant | Average lifecycle water use |
|---|---|
| CSP (with dry or wet cooling) | ~120 gal/MWh |
| Powder River Basin coal power plant | 523 - 1,084 gal/MWh |
| Conventional natural gas combined cycle power plant with wet cooling | 152 - 525 gal/MWh |
| Conventional nuclear power plant with wet cooling | 475 - 900 gal/MWh |
Other water uses in CSP plants include:
- process (water-steam cycle)
- service (cooling rotating equipment)
- washing (mirror cleaning)
The water involved in water-steam cycle needs to be relatively pure and often needs to be de-mineralized. Requirements for water purity is specified by the turbine manufacturers. These requirements impose an additional limitation on the water sources. If raw water contains significant amounts of ions and other chemicals, a special water treatment plant may need to be added to the facility. Much of this water is recycled, and its total volume is not substantial.
Please answer the following self-check questions before proceeding to the next section.
Check Your Understanding Questions 1 & 2 (Multiple Choice)
Check Your Understanding Question 3 (Essay)
What are the main types of site-related costs to consider in site selection?
Additional Resources for Section 8.1
8.2. Socio-economic aspects of CSP technology
8.2. Socio-economic aspects of CSP technology
CSP deployment has a number of positive collateral impacts on environment and social welfare, and those impacts are important to consider in the project feasibility analysis. Sometimes, when project evaluation is solely based on the energy prices, renewable energy technologies may not look competitive enough at the modern energy market. However, including externalities, such as greenhouse gas emission reduction effect, improved diversity, security of the energy supply, employment, etc., into the evaluation process can help to justify the value of a renewable energy project more fairly.
One of the prominent impacts of CSP in the socio-economic area is stimulation of the economy and creation of new jobs at the local level. This is largely due to relatively "low-tech" profile of this technology: the main components are mirrors, steel, concrete, and labor. These local impacts are realized through the increase in demand for goods and services and creation of jobs. These impacts can be classified as direct, indirect, and induced.
The direct effects imply the increased demand for good and services that are required to construct, operate, and maintain the CSP facility. The indirect effects involve the one the new investment has on new sales and material flows among other productive sectors of the economy. The induced effects are related to expansion of private expenditure (for example, from workers employed) in goods and services, such as food, health care, transportation, etc. [Lovegrove, Stein, 2012]. For proper accounting of all levels of external benefits, there should be a way to quantify them and to assign them a monetary value.
One of the analytical methods to quantify the externalities of energy projects is based on Input-Output (I-O) analysis. The I-O analysis is an economic theory that was developed by Wassily Leontieff, a Russian economist who received a Nobel Prize for it. This model describes the inter-industry relationships within an economy, connecting the outputs from one part of the economy to the inputs to another part of the economy. The data are typically expressed as monetary values and are organized as a matrix, with column entries representing inputs to an industrial sector, and rows representing outputs from that sector. [Input-Output Model from Wikipedia.org [8] ]. Essentially, this approach recognizes that spent investment becomes income to other industries, and thus stimulates their development.
To understand how this method can be applied to CSP projects, we refer to the following publication, which analyzes the socio-economic impacts of parabolic-trough and solar-tower plants in Spain. The authors come up with impressive numbers for increase in demand and employment impacts, demonstrating the remarkable potential of CSP for benefiting local economy.
Reading Assignment
Journal article: Caldes, N., Varela, M., Santamaria, M., and Saez, R., Economic impact of solar thermal electricity deployment in Spain, Energy Policy 37, 1628-1636 (2009).
This article is available online through the PSU library system. See copy of the article in Canvas Module 8.
This article nicely demonstrates the quantified benefits from solar thermal energy projects, which are rarely taken into account in feasibility analysis. The type of analysis presented there is a convenient tool to determine whether the government subsidies provided to defray the cost of the renewable technology are justified in terms of social welfare.
Some main points in the above-mentioned study are included in the self-check questions below.
Check Your Understanding Questions 4-6 (Multiple Choice)
8.3. Environmental assessment of CSP Technology
8.3. Environmental assessment of CSP Technology
As a technology based on the renewable solar resource, the CSP has a great potential to reduce greenhouse gas (GHG) emissions. Emissions typically associated with conventional electricity production result from coal or natural gas burning and have been a severe factor in global pollution in climate change. Hence, installation of CSP offsets generation from fossil fuel plants. It does not mean, however, that CSP technology is emission free: while operational emissions are negligible compared to fossil-fuel power plants, lifecycle emissions may be still significant. To estimate the GHG emission level and the magnitude of the emission reduction benefit, one can employ Life Cycle Assessment (LCA) - a comprehensive methodology dealing with inventory of all processes and materials involved in a technology.
Life Cycle Assessment (LCA) methodology
Life Cycle Assessment (LCA) is a “cradle-to-grave” approach for assessing products, processes, industrial systems, and the like. “Cradle-to-grave” begins with the gathering of raw materials from the earth to create the product and ends at the point when all materials are returned to the earth. LCA evaluates all stages of a product's life from the perspective that they are interdependent, meaning that one operation leads to the next. LCA enables the estimation of the cumulative environmental impacts resulting from all stages in the product life cycle, and, as a result, allows selecting a path or process that is more environmentally benign.
LCA helps decision-makers select the product, process, or technology that results in the least impact to the environment. This information can be used with other factors, such as cost and performance data, to find optimal solutions. LCA identifies the transfer of environmental impacts from one media to another (for instance: a new process may lower air emissions, but creates more wastewater, etc.) and between different lifecycle stages. The diagram below illustrates the main lifecycle stages to be considered in LCA:
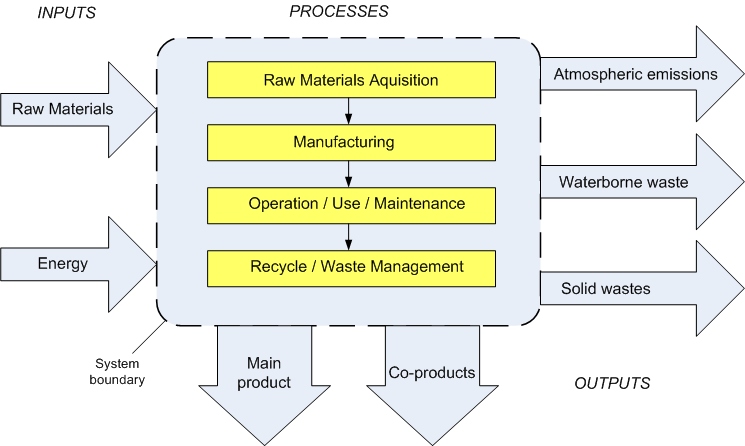
Figure 8.2. The main flows and stages considered in lifecycle assessment.
The diagram above lists the main stages of product lifecycle: (1) raw material acquisition, (2) manufacturing / construction, (3) operation or use, and (4) recycling or waste disposal (decommission stage). Each of these stages has inputs of materials and energy and outputs of atmospheric emissions, waterborne wastes and solid wastes. Each stage creates the main useful input to the next stage, and usually the operational stage of the lifecycle is where the main product of the technology is produced. Any co-products (desirable or undesirable) are also identified and taken into account in the analysis. The LCA based on this scheme is a complex process (even for small systems), which requires large amount of data and interdisciplinary expertise for proper assessment. A typical LCA project plan includes the following main steps:
- Goal definition and scope: Identify a product / process / technology; establish context and system boundaries.
- Inventory analysis: Identify and quantify energy, water, and materials as inputs as well as environmental releases as outputs.
- Impact assessment: Assess the potential human and ecological effects, quantify metrics.
- Data interpretation: Compare data from Inventory Analysis and Impact Assessment stages to select or recommend a preferred product, process, or technology.
LCA Limitations:
- LCA thoroughness and accuracy will depend on the availability of data; gathering of data can be problematic; hence, a clear understanding of the uncertainty and assumptions is important.
- Classic LCA will not determine which product, process, or technology is the most cost-effective or top-performing; therefore, LCA needs to be combined with cost analysis, technical evaluation, and social metrics for comprehensive sustainability analysis.
- Unlike traditional risk assessment, LCA does not necessarily attempt to quantify any specific actual impacts. While seeking to establish a linkage between a system and potential impacts, LCA models are suitable for relative comparisons, but may be not sufficient for absolute predictions of risks.
- The standardized procedure for the LCA recommended for product and technology assessment in the U.S. is documented in the EPA guidelines referenced below.
Life Cycle Assessment: Principles and Practice [9], EPA/600/R-06/060, 2006.
LCA Methodology Applied to CSP Plants
When the LCA analysis is applied to a CSP plant, a number of impact metrics need to be identified. One of them, as mentioned above, is greenhouse gas emissions, but there are also other impacts that involve environmental harm. Other typically assessed impacts are acidification and eutrophication potential. Acidification is referred to as increase in acidity of natural waters and soils. It may cause loss of aquatic life, forests, and other plants in the area and increase ecotoxicity. Eutrophication is related to nutrient enriching in aquatic and terrestrial environments. It can cause harm to ecological system through a chain of feedbacks, change in dissolved oxygen contents.
With respect to above metrics, CSP offers significant benefits, according to various studies reviewed in Lovegrove and Stein (2012). Values of GHG emissions by CSP plant (in case of solar only operation - no hybrid systems with natural gas backup) are estimated in the range from 11 to 90 g CO2 equivalent per kWh of electric energy generated. For central tower plants, the emissions are on the lower side, and for the parabolic trough plants, the emissions are on the higher side of that range; but, in either case, these numbers are well below the values typical for other electricity generation facilities (Table 8.2).
| Technology | GHG emissions g CO2 equiv/kWh |
|---|---|
| CSP (solar thermal) | 11-90 |
| Solar photovoltaic (PV) | 57-109 |
| Nuclear power | 14 |
| Heavy oil condensing | 726 |
| Light oil gas turbine | 436 |
| Coal/lignite | 690-820 |
| Natural gas combined cycle | 391 |
The CSP emissions have been shown to increase by 650 g CO2 equiv./kWh if a fossil-fuel back-up is used and by 60 g CO2 equiv./kWh if heat storage is used. The different studies indicate that CSP's GHG emissions are mainly associated with steel and concrete used in solar field and tower, and salts used in storage systems. The use of synthetic salts instead of naturally mined salts for storage system results in an increase in GHG emissions by ~13 g CO2 equiv/kWh. Also, non-renewable electricity and materials may be used at the manufacturing stage of the project and in transportation to the site. It is known that the use of dry-cooling system instead of wet-cooling system increases GHG emissions by ~2 g CO2 equiv/kWh.
Acidification impact of CSP reported in the range 70-100 mg SO2 equiv/kWh. In case of hybrid plant (solar + fossil fuel backup), this number is substantially higher - 590-612 mg SO2 equiv/kWh. In case of eutrophication, the impact range is 6-10 mg PO4/kWh for solar only mode and ~50 PO4/kWh for hybrid mode.
It is important to note that these impacts take place during the operational phase only because the plant consumes power from the grid rather than power being produced on site.
A published study by Lechon and co-authors (2008), referenced below, describes the LCA analysis for CSP systems in more detail. The first two sections of the article define the method and scope of LCA, so you can just briefly look through those. It is more important to look at the data tables that contain specifications of the assessed facilities and various metrics. Usually, LCA studies collect considerable amounts of data, and our goal here is to learn to read and to interpret that information.
Reading Assignment
Journal article: Lechon, Y., de la Rua, C., and Saez, R., Life Cycle Environmental Impacts of Electricity Production by Solar thermal Power Plants in Spain, J. Solar Energy Eng., 130, (2008).
This article is available through the PSU library system. See a copy of this article in Module 8 in Canvas.
As you can understand from the above article, the energy consumption at different stages of the system lifecycle is still the main source of the environmental impact. The numbers characterizing two different CSP facilities in terms of energy consumed and energy generated are listed in Table 3, which is the basis for finding the lifecycle emissions. Also, pay attention to Table 6, where the emissions are itemized by system component. This itemization can be helpful in finding engineering solutions to further decrease the environmental impact of the technology. Note that the plants assessed in this study are hybrid (solar thermal + natural gas 15%), and this is the reason for higher overall GHG emissions calculated for this case compared to solar-only values given in Table 8.2 above.
Check Your Understanding Question 7 (Multiple Choice)
Check Your Understanding Question 8 (Essay)
What sources of GHG emissions can you assume at the construction phase of the CSP plant?
Check Your Understanding Question 9 (Multiple Choice)
8.4. Optimization of CSP Systems
8.4. Optimization of CSP Systems
The biggest challenge in prediction of the CSP performance coming from a projected solar thermal plant is the unsteady nature of the solar resource. Models involve weather and insolation data which bring in uncertainties in the final power output. So, it is not sufficient to calculate the annual energy yield simply by expected load hours, as it is usually done for conventional fossil fuel power stations.
The energy flow within a CSP plant follows a complex chain of transformations, each provided by a certain technology block. This step-wise energy flow can be represented by the following diagram:

Each step in the power conversion chain is performed by technological units, each characterized by a number of parameters, which can be optimized depending on the scale of the facility, external conditions, available resources, and other preferences. Simultaneous optimization of those parameters and computation of the power output can be done by System Advisor Model (SAM) software, distributed by the National Renewable Energy Laboratory (NREL). SAM currently is one of the widely used and most developed tools for solar plant modeling, which incorporates both energetic and economic parameters. SAM has a user-friendly graphic interface, which allows the operator to see diverse technical performance information in table and graphs.
In SAM, the setting for each of the above mentioned technological units can be predefined and controlled separately, which creates opportunities for simulating different solar systems at different locations.
If you are not yet familiar with how the SAM software works, please refer to the following video (35:08), which explains the basic things about the program interface.
Video: SAM Intro Webinar 1 of 5: User Interface Overview (35:08)
PRESENTER: As most of you know, SAM is a free computer program that you can download from NREL's website.
And basically, what the model does is it calculates a renewable energy system's hourly energy output over a single year. So it simulates the performance of a power system over a year and then calculates the cost of energy of that project over the life of the project.
So conceptually, the model combines a performance model with a financial model. Here's a diagram of the structure of the program. There are basically three conceptual parts to the software. There are the input pages, which we'll see in a moment. And then, there are the model results. And then, there's a simulation engine that makes calculations based on the input variables and reports the results.
There are some more advanced features-- including Excel Data Exchange and SamUL scripting, and some advanced simulation control options-- that we'll be covering in tomorrow's session.
So this next slide sort of shows a little bit more the conceptual model to help you picture what's going on with SAM. The simulation engine is an hourly model, as I mentioned before. It's based on TRNSYS, which is a simulation software developed at the University of Wisconsin.
The simulation engine does an hour-by-hour simulation of the power system. So in order to do hour-by-hour calculations, it requires hourly weather data, which you provide as input to the model, so that you've got a weather file with 8,760 hourly data points for the solar radiation, temperature, wind speed, and other weather factors that affect system performance.
And then, you also have the system description, which tells the simulation engine what size of system you're modeling and what complements your system is made of.
So the two green blocks are inputs, and the red circle represents a calculation process. And then, the blue rectangles represent outputs. So the simulation engine generates a set of hourly outputs, a set of hourly values representing the electric output of the system-- so kilowatt-hours for each hour of the year. And that's the basic output of the simulation engine.
It also outputs some intermediate variables. So if you're interested in looking in more detail at how the system is operating, you can see for example the energy output at different points of the system, perhaps coming out of the solar array for a PV system, or coming out of a solar field for concentrating solar power system. But the primary output of the simulation engine is the electric kilowatt-hours for each hour of the year.
Then, SAM adds up those hourly values to calculate the total annual output of the system. So that's one number that is then passed to the financial model. And the financial model calculates the cost of energy of producing electricity with your system, and that runs over some long period, a number of years. So it uses the annual output of the performance model for year one, and then calculates the cost of operating the system for each year over a 20- or 30-year analysis period.
OK, so next I'd like to jump right into SAM. This is what you see when you first open SAM, the welcome page. And it provides you with three different options for getting started using the model. You can either start with a sample file-- so here's a list of the sample files. So sample files are files that we've prepared that have a complete set of inputs and results or a range of different systems and different technologies that SAM can model.
You can also start with a new file or new project. And to do that, you just type the name of your project under Create a New Project, and then click Create. And then, there's a list of recent files. These are files that I've worked with over the last few weeks.
These three options are also available under the File menu. So File, you could start with a new project, open a sample file, or look through a list of recent files.
These other options-- open a GIF file is for anyone who's used version three of SAM, which is a legacy version that uses a different file format. So if you have files that you created using SAM version three, you can save them as a GIF file and open them in the current version of SAM.
OK, so I'll just start by opening a sample file. And I'll start with a sample PV system to show you around the user interface. A SAM file or SAM project-- I'll use those two terms interchangeably-- consists of one or more cases. And a case in SAM is sort of analogous to a worksheet in Excel. So an Excel workbook can have one worksheet or it can have several worksheets. In Excel, each worksheet is accessible by a tab, which are along the bottom of the page in Excel. But in SAM they're along the top.
Each case in SAM is a complete set of inputs and results. So they're intended to allow you to do comparisons of different analyses within a single file. So by switching between cases in the file, you can compare different analyses. So you might set up different cases to compare different financial scenarios, or you might set up different cases to compare different technologies, for example.
So in this PV sample file, we have a case for a residential PV system, another for a commercial system, and another for a utility system. And as I click the tabs, I can see the results for the different cases.
Along the left side of the window here we have the navigation menu, and each of the items in this menu is actually a button that you can click. And by clicking each button, you display the input page. So for example, the climate page shows the input page where you specify climate file for your analysis. Financing-- there's finance inputs. Human Incentives-- those are the incentives inputs.
At the bottom under the navigation menu here are buttons that allow you to control simulations, run simulations, and also to display the results page. So this graph button with the bar graph button on it here displays the results page. And this is where you see graphs and tables of the results after you've run simulations.
One thing you'll notice about SAM, whether you start a sample file or a new file, is that the values on all the input pages are already populated. The variables are all populated with values. SAM has a large number of input variables, and so in order to help you get started, we've just chosen representative values for all of the input variables.
It's up to you as the modeler, once you start actually using SAM, to take ownership of the input variables and make sure that they all make sense for your analysis. These are values that we on the development team have chosen that are fairly representative of projects, generally in the US. But of course, the values that you choose for your analyses are going to be very project-specific and depend on the location of the project and also what type of project.
So be aware that these input various variables, the input values, are representative. They aren't officially sanctioned values by either NREL or DOE.
So the process for using SAM is to go through each of these input pages and either choose values for your project or change them. So some variables you choose values from a dropdown list, and other variables are fields that allow you to type values. And once you've specified values for all of the input variables, then you run the simulation by clicking the green arrow button down here, which is the Run button.
The status bar up here in the sort of top-middle of the page tells you the status of the simulations when they run. And then, once simulations are finished running, SAM displays the results page where you can explore the results. For more advanced analyses, you can use the Configure Simulations button here to access advanced simulation options. And these, again, are ones that we'll be discussing tomorrow.
So the basic process is specify your inputs, run simulations, and review results. And if you want, optionally, you can configure more advanced analyses.
So the results page-- again, to display the results page, I'm clicking this button with the graphs on it. The results page is divided into a couple of sections. Under the navigation menu is the metrics table, which displays kind of general metrics of your project.
And I'll be going through these in a little bit more detail later on in the session, but I just wanted to point out the metrics table here and two of the more important metrics, which are annual energy-- this is the total electric generation for this system over one year. So it's the electric output of the system, in this case in year one of the analysis period. And then, the levelized cost of energy, which is one of the primary outputs of SAM. So in this case, we've modeled a system with a levelized cost of energy, or LCOE, of about $0.155 cents per kilowatt-hour.
Over on the right-hand side of the screen are where you see a bunch of graphs. SAM displays a set of default graphs, which we see here. You can also create your own custom graphs. And in this case, by default, we see four graphs. But you can change the number of graphs that appear in the results page by clicking the little thumbnail images of graphs at the bottom of the window.
So as I click buttons, I see different graphs. If I want to display two graphs, I hold down the Control key, and then, I can display two graphs, three graphs, or four graphs. So you can display up to four graphs on the results page.
The buttons along the top center of the window here control what you see on the results page. So right now we're in the View Graphs and Charts mode. I can also view the base case cash flow table by clicking Base Case Cash Flow.
So these are the results of the financial model. And each column represents a year. So Year 0, Year 1, Year 2, and so on. In this case, we have a 30-year project, so there's 30 years of data in the cash flow table.
And then, each row in the table shows detail in the cash flow. The after-tax cash flow row is the key output of the financial model, and it's down towards the bottom of the cash flow table.
This cash flow table is not an Excel spreadsheet. It sort of looks like one. And you can click the Send To Excel button here to export the cash flow table to Excel.
But when you do that, this Excel spreadsheet doesn't have any calculations. SAM just dumps the cash flow values into Excel so that you can see them and manipulate them if you want to use them in your own external model in Excel or do some of your own graphing outside of SAM. So be aware that the cash flow table is just a table of values. It's not connected to Excel on how to equate formulas.
You can also copy the data from this cash flow to the clipboard and paste it into Excel or any other program, or you can save the table as a comma-separated text file.
For those of you running SAM on a Mac, the Mac version of SAM can't control Excel. So the Send to Excel option is disabled for Mac versions, but you can always use the Save As CSV option to save your data for use in Excel on a Mac.
The Tabular Data Browser is a table-building tool that allows you to sort of build tables of all of the outputs in SAM, or many of the outputs in SAM. So for example, the metrics list here is a list of all of the metrics that are available in SAM. And by checking boxes here, I can build a table of metrics. And when you clear the checkbox, SAM removes the value from the table. And once you build a table, then you can send it to Excel or save it as CSV text to use in reports or other programs.
You can also export monthly data. So the monthly data-- these are averages of the hourly data by month. And then, you can also look at annual averages. So this is for each of the 30 years in the analysis period. These are the monthly averages, so months 1 through 12. I'm simultaneously showing monthly data and annual data on the table, which is why I have 1 column of 30 values and another column of 12 values.
I'll clear all of those and show the hourly data. So if you want to dig into the details of the simulation results, you can display the hourly data. And let's look at the derated DC outputs. So this is the net output of the PV system for each of the 8,760 hours in a year. So that's the main output of the simulation engine.
But I can also look at intermediate values. Here's the total incident radiation. This is the energy incident upon the PV array. And then, I can look at the derated DC output. So this is the DC output of the array. Sorry, I misspoke earlier. The main output is the derated AC output.
So here we can see the progression from energy incident on the array, energy output of the array, and then, energy output of the inverter or the entire system. So you can build this table, and then, you can export it to Excel to examine in more detail.
There's also an option for looking at results that you can access either using the Export and View Data button here or through the Results menu. This Export button shows these options are all equivalent to the options that are available on the results menu. So you can use either method to access these results.
So here, Graph Data option just exports all the data from the graphs to the clipboard or to Excel. That's sort of equivalent to this Copy Graph Data button on the results page when you're in View Graphs and Charts mode.
You can also export the cash flow table via the Results menu. That's equivalent to choosing one of these buttons when you're viewing the page in cash flow mode.
And then, there's this case summary. So this is an Excel workbook that has a bunch of worksheets in it with all of the data. So here's the cash flow table in Excel. Here's the metrics summary table in Excel, the data from the graphs that we were viewing in SAM when we created this summary spreadsheet, a summary of inputs, hourly data, the monthly averages, and annual averages.
So the summary spreadsheet some people find to be a useful way to look at the results. Again, you get to that from Results, Case Summary, or by clicking the Results button here and choosing Case Summary and then clicking Send to Excel.
Another option for viewing results is to use DView, by clicking either the View Hourly Time Series button in the export data window or on the Results menu choosing View Hourly Time Series. And this opens a separate program called DView that displays graphs of the hourly data.
And it's a pretty nifty tool. It's kind of hard to interpret tables of large numbers of values, like a table of 8,760 values. So these graphs kind of give you a snapshot of the data.
One of the more powerful graphs in DView is called a DMap. So once you open DView, you have options for viewing the 8,760 data in various formats. One is as the line graph. This is looking at the hourly data itself, and I can look at the derated AC power, the derated DC power. I can show a second graph by using the two columns of check boxes here. So I can look at cell temperature and inverter efficiency.
On the top graph, I can zoom in and zoom out. I can look at the entire year. The daily tab shows daily averages of the data. And again, I can use the checkboxes to choose what data I display. There's monthly averages, daily profiles by month, the DMap, which shows a snapshot of the entire year.
If we look at the AC power out, we have months on the x-axis and hours on the y-axis. So you can sort of see the daily shape for the entire year, and also the seasonal variation over the year. And then, there's other statistical summaries of the data.
And you can export this data either as an image, if you want to copy pictures of the graph to include in your reports or presentations. You can also export the data itself. So if you click Export Data here, it'll just export the data that's visible in the graph to a text file, which you can then manipulate.
So that's DView. And again, DView is a separate little program that SAM calls to display the hourly data. SAM automatically includes a copy of DView when you install it, so you don't need to install any separate software. But DView is handy if you have other hourly data on your computer that you want to look at. You can use the File Open command here to look at other hourly data.
So that's a quick summary of viewing results in SAM. A couple of other things I want to point out about the user interface before I show you an example. One is this Notes feature. You'll see at the top right corner of the page a little sticky icon that look like a sticky note. If you click that icon and type some text, SAM will store this bit of text with the climate page.
So it shows a little sticky note icon on the Climate button to indicate that there's a note for the climate page. And then, when you click on the climate page, then, the note appears. So this is useful if you're sharing files with colleagues. You can make notes to each other, or you can make notes to yourself to remember changes that you made or to store values temporarily, and so on.
You can have notes. These are tax credit incentive notes that only appear when the tax credit incentives page is showing. You can store notes with the results page.
Another feature is the Help System, which is a useful resource when you're learning to use the model. There are a few ways to access Help. One is on the Help menu. If you click one of these options, you can display the Help System.
This is a browser-based help system. There's also a PDF version of the help system. So this is the same information that's in Help, but as a PDF file. If you prefer to use that, you can print pages from the PDF file. You can also use the search feature in your PDF reader to find information.
When you're on a page in SAM, you can press the F1 key to open the help topic for that page. So we're on the payment incentives page, and I pressed F1. And that opened the payment incentives help topic. I could also click the Help button here, this little round circle with a question mark in it, to open the help topic for the payments and incentives page.
The way the help pages are set up, they open just showing the headings to kind of help you find information. So if you're looking for information about input variables on the payment incentives page, then you can expand the input variable reference heading to see a list of all the input variables and descriptions. And you can expand and collapse the headings using the plus-minus button at the top of each topic.
And then, these buttons over on the top right-- you can open your email browser already addressed to user support if you have questions. This is a link to the Google Group page for SAM. And then, this is a link to the SAM website.
OK, I'm going to take a moment to pause and take a quick look at questions here.
So there's a question about the color of the input fields. You'll notice that some of the input variables have blue type, and others have black type. So the ones with black type are values that you can edit, and the ones with blue type are ones that you cannot edit. So SAM calculates the values in blue.
Some of these questions we're going to address later, so I won't answer now.
I think I answered this question about hourly granularity. You can look at the results and the weather data, both as hourly data. So you can compare the weather data and the results using the Tabular Data browser on the results page. So here we see the incident total radiation. That's the input from the weather data. And then, here's the simulation output at hourly resolution.
The climate page also allows you to see the climate data. If you click View Hourly Data here, that opens DView so you can see the data in the weather file, in case you're interested in exploring the weather data. So you can look at the wind speed data and so on.
Here's a question about currency units. There's no facility in SAM to change units. You're kind of stuck with the units that are provided in SAM. If you're very careful, you could change values. If you wanted to do your financial and cost modeling using Euros or some other currency, you could change all these values to your currency.
But I would recommend converting everything to dollars because it'd be easy to miss a value somewhere and some of the internal calculations may be based on dollars. So in general, I would recommend doing your modeling in SAM in dollars. And then, as far as other units-- watts and so on-- you're stuck with the units there. We don't have a conversion facility in SAM.
And then, before I continue, I'll just repeat-- I see a few questions about the logistics. So we're going to try to post a recording of the session on the SAM website, and I will post a PowerPoint presentation that has the talking points that I'm speaking from that'll serve as an outline of the session.
As an activity in this lesson, you will use a few examples from SAM to explore the differences between different cases of CSP installations.
8.5. Thermal Energy Storage
8.5. Thermal Energy Storage
Different types of fluids are commonly used for storing thermal energy from concentrating solar power (CSP) facilities. CSP plants typically use two types of fluids: (1) heat-transfer fluid to transfer the thermal energy from the solar collectors through the pipes to the steam generator or storage, and (2) storage media fluid to store the thermal energy for a certain period of time before it is used on demand.
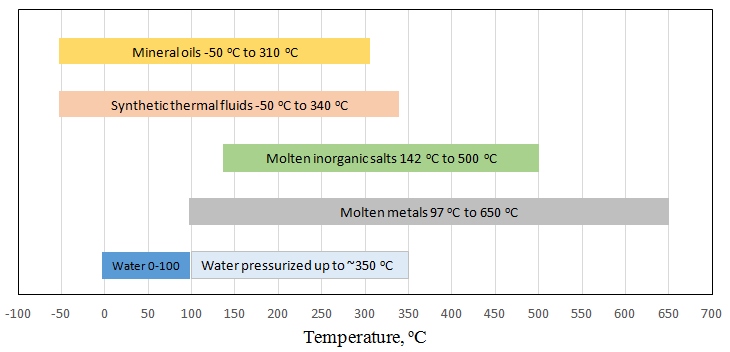
These are some available heat transfer and storage fluids currently used:
- Water
- Water-Glycol mixtures (for low temperature only)
- Mineral oils
- Synthetic thermal fluids
- Molten inorganic salts
- Molten metals
Water is the most available and cheapest fluid to use, but the problem with water is that it has very limited temperature range when it is liquid. Keeping water in liquid state above 100 oC requires high pressure, which adds significantly to system complexity and cost. Oils and other synthetic liquids are commonly used in CSP plants, as they have a much wider working temperature range. Molten salts are probably the most common storage medium (Wu et al., 2001), but are not the best heat transfer medium, because salt tends to solidify in tubes at lower temperatures, blocking transport. Additional heating will need to be provided in that case to start up the plant. There are developments for novel fluids that can be used for both heat transfer and storage at the same time (Moens and Blake, 2004). Some commonly used fluids and their working temperature ranges are shown in the diagram in Figure 9.1.
Molten salt storage is employed at many existing solar thermal plants, so we are going to look at it in some more detail. As was mentioned above, salt "freezing" (i.e., transforming from a molten state to solid state) can present some problems, because the salt is supposed to circulate through the tubes to deliver thermal energy to the steam generator or another application. So, to achieve the lowest possible "freezing" temperature, a eutectic mixture of salts is used.
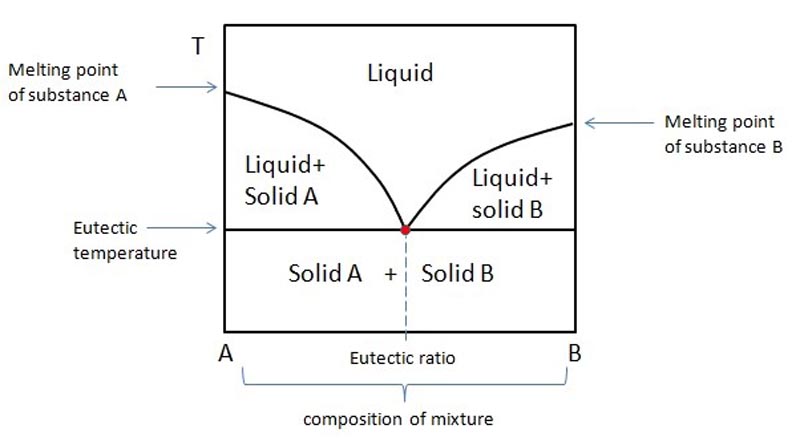
What is eutectic?
A eutectic system is a homogeneous mixture of two or more components, which together have a lower melting point than each of them separately. The eutectic mixture melts as a whole only at a specific ratio of those two components in the mixture. A generic eutectic phase diagram is shown below.
Typical molten salt mixture used for energy storage is represented by the ternary eutectic
53 wt % KNO3 (potassium nitrate)
40 wt % NaNO2 (sodium nitrite)
7 wt % NaNO3 (sodium nitrate)
or binary eutectic
45.5 wt % KNO3 (potassium nitrate)
54.5 wt % NaNO2 (sodium nitrite)
The eutectic temperature for those compositions is in the range 142 to 145 oC.
The molten salt is used for high temperature energy storage applications (above 400 oC) because typical thermal fluids, such as synthetic oils, have temperature limitation and decompose beyond the maximum allowable temperature (410-430 oC).
This is how the molten salt storage is employed in a solar thermal plant. First, the solar energy is caught by the collectors and concentrated on the receiver tube filled with heat transfer fluid. The heat transfer fluid (with temperature of ~393 oC) is circulated in a closed loop to deliver heat to the steam generator, which produces superheated steam, and then the thermal fluid flows back to the solar collectors (with temperature of ~ 293 oC). Such a loop can only operate during sunshine hours. To extend the steam generation beyond sunshine hours, molten salt thermal energy storage is used. The thermal storage usually consists of two salt storage tanks. In this case, the closed loop with the heat transfer fluid is passed through one of the salt tanks, where salt is heated to the temperature of ~ 384oC. The tank is insulated, so salt can stay hot for a substantial period of time (estimated heat loss ~0.5 oC per day). The molten salt is stored in the tanks at ambient (atmospheric pressure). To discharge heat during night hours, the molten salt from the hot tank is pumped through the steam generator to produce steam, and then to the cold storage tank (at ~ 292 oC). In this configuration, some part of the heat transfer fluid loop is diverted to the heat exchanger between the cold and hot salt tanks. The cooled molten salt is then pumped through the heat exchangers and returns to the hot salt tank.
Solar tower systems can use molten salt as heat transfer fluid and heat storage medium without involving any additional thermal transfer fluid loops due to higher radiation concentration temperatures. In this case, molten salt is flowing through the tower-mounted molten salt receiver, where it is heated to 565 oC. Then the salt is supplied to the hot salt tank, from where it flows to the steam generator. This concept is illustrated on the eSolar website [11].
In this case, the use of molten salt for both heat transfer and thermal energy storage minimizes the number of storage tanks and salt volumes needed.
The following video (~2 min) provides a simple illustration of the molten salt thermal energy storage concept.
Storing energy in fluids involves exchanging heat between different types of fluids in heat exchangers. For example, transfer of heat from a thermal fluid in solar-heated tubes to the molten salt reservoir requires a heat exchanger; further transfer of heat from the molten salt to water to produce steam would involve another heat exchanger. There is a thermal physics method to calculate the effectiveness of the heat transfer in different types of heat exchangers and to evaluate their performance. One example of such calculation is given in Section 3.17. of the book "Solar Engineering of Thermal Processes" by Duffie and Beckman (2013), referred to below.
Additional Reading
Book chapter: Duffie, J.A. and Beckman, W.A., Solar Engineering of Thermal Processes. Section 3.17 Effectiveness-NTU calculations for heat exchangers. pp. 168-170.
This reading is available online through PSU Library system. It is an optional material to study if you are interested in more insight in how heat is transferred from one medium to another, and what kind of losses can be expected. More thorough consideration of thermal topics is included in EME 811, which is also part of RESS Solar Option program.
Summary and Activities
Summary and Activities
Strategic planning of a CSP facility involves a number of steps - site evaluation, socio-economic assessment, environmental assessment, and system modeling and optimization. All these steps must be taken before investment is made, and work has begun. Feasibility analysis requires several iterations and special expertise to justify the decision. This lesson introduced you to a few useful tools and methods to start with.
After you have covered the assigned readings for this lesson, please complete the following assignments:
| Type | Description/Instructions | Deadline |
|---|---|---|
| Discussion Forum | Discussion Forum "Social benefits of solar thermal systems": Lesson 8 What, in your opinion, is the most important benefit of CSP technology for local economy and society in general?
|
Sunday night |
| Activity | SAM exercise
Note: I hope you are familiar with the SAM software, since it was used in your EME 810 course. If you are missing that prerequisite, go to this EME 810 page [12]to learn how to install and run SAM. |
Wednesday night |
References for Lesson 8
Lovegrove, K., Stein W., Concentrating Solar Power Technology, Woodhead Publishing, 2012.
NREL, 2013 / http://www.nrel.gov/docs/fy13osti/56290.pdf [7]
Eilbert, A., The Trade-Off Between Water and Energy: CSP Cooling Systems Dry Out in California, Revolt - Worldwatch Institute, 2010.
Caldes, N., Varela, M., Santamaria, M., and Saez, R., Economic impact of solar thermal electricity deployment in Spain, Energy Policy 37, 1628-1636 (2009).
Lechon, Y., de la Rua, C., and Saez, R., Life Cycle Environmental Impacts of Electricity Production by Solar thermal Power Plants in Spain, J. Solar Energy Eng., 130, (2008).