Learning Objectives Self-Check
Read through the following statements/questions. You should be able to answer all of these after reading through the content on this page. I suggest writing or typing out your answers, but if nothing else, say them out loud to yourself.
We'll start with climate change for two reasons. First, of all of the specific issues in this lesson, this is the one that potentially has the most devastating impact because of the scale of the problem. If the climate continues to change, the impacts will likely be catastrophic and on a global scale. Second, climate change will likely impact all of the other sectors of sustainability and society, including all of those listed in this section. It is absolutely essential to understand climate change if you want to address sustainability. The following is a short list of facts that indicate why we should be concerned about the human influence on the climate.
First, a few important terms:
- Greenhouse effect: the term used to describe the phenomenon whereby infrared heat warms the lower atmosphere of the earth or another planet due to the gaseous content of the atmosphere.
- Enhanced greenhouse effect: This occurs when the magnitude of the greenhouse effect is enhanced by human activity, due to the emission of greenhouse gases at an unnaturally high level.
- Greenhouse gas: a gas that absorbs infrared radiation and contributes to the greenhouse effect.
- Anthropogenic: caused by humans.
- Anthropogenic climate change: the component of climate change that is believed to be caused by humans.
The following article from the U.S. National Aeronautics and Space Administration (NASA) explains a lot of the basics regarding the terms listed above.
To Read Now
Nota Bene - Climate Change is a Massive Topic
As I hope you know, climate change is a massive, complex topic. This short lesson is meant to provide an overview of some key concepts. We could spend all semester - and dozens of semesters afterward - focusing on the ins and outs of climate change and still have more to analyze. Hopefully, this will provide a good introduction to those of you who are not well-versed and some helpful reminders and deeper information for others.
There are many sources of information about different aspects of problems, solutions, myths, etc. related to climate change, and I encourage you to explore them. A few of my favorites are as follows. Feel free to share your own sources in the Coffee Shop!
Fact 1: The Greenhouse Effect is Settled Science
The greenhouse effect is a universally accepted natural phenomenon, and carbon dioxide (CO2) is one of the primary greenhouse gases. Without it, life on earth would not be possible. The video below from Stile Education provides a good succinct explanation of the basic physics behind the greenhouse effect.
Watch "What is the greenhouse effect and how does it work?" by Stile Education (3:14 minutes)
The greenhouse effect. When you see a beautiful fat full moon, do you ever imagine what it'd be like to be up there standing on its surface? Well for one thing, hot. About 120 degrees Celsius hot! But 14 days later at new moon you'd be in the middle of the long lunar night and the temperature would have plummeted to around -170 degrees.
On average the moon and earth are the same distance from the sun, so they get the same amount of solar energy. But here the average temperature is 16 degrees Celsius while on the moon it's more like minus 80. The earth has a much smaller range of temperatures too. Minus 88 and plus 57 are the lowest and highest on record. So why the difference? The answer is the atmosphere. It protects us from a lot of the sun's energy but also traps some that gets through so that, for example, at night temperatures don't fall that much. Especially if it's cloudy.
The energy that comes from the sun is electromagnetic radiation in a broad range of wavelengths. The upper atmosphere absorbs most of these wavelengths. Visible light gets through but a third of this reflects straight back out again, mainly of clouds and ice. So only half of the energy heading for earth gets to warm its land and oceans. Rock, soil, and water heated by visible light re-emit the energy as low-energy infrared radiation - heat. This can pass through the oxygen and nitrogen in the air but some gases - the so-called greenhouse gases - carbon dioxide, methane, nitrous oxide, and water vapor - have molecules with structures that make them absorb the radiation. Struck by an infrared wave they vibrate strongly before releasing the energy as a new infrared wave. This can shoot out in any direction - towards space, down to earth, or out sideways. But in every case there's a good chance that the wave will strike another greenhouse gas molecule and change course again.
Although greenhouse gases typically make up less than one percent of the atmosphere, six kilometers deep, not much escaping radiation makes it through without encountering at least one greenhouse gas molecule Over the entire planet the result of this giant pinball game is that heat stays close to the earth's surface for longer than it otherwise would, keeping it warmer this is the greenhouse effect. Without it earth would have an average temperature of minus 18 degrees Celsius. Which is better than the moon but I, think you'll agree not as good as what we've got.
In a nutshell:
- Greenhouse gases (GHGs) allow visible light (shortwave radiation) to pass through them but absorb infrared (longwave radiation) and re-radiate it in all directions after they absorb it. This is simply a physical property of certain gases. Nature just doing its thing.
- Sunlight is mostly shortwave radiation, so passes through the GHGs on its way toward the earth's surface.
- If the shortwave radiation is reflected on or near the earth's surface (e.g., clouds, water, physical objects), it passes back through the GHGs, because it is still shortwave. It goes back out to space.
- If the shortwave radiation is absorbed on or near the earth's surface (e.g, by your skin, water, soil, other surfaces) then it is radiated as longwave radiation. (This is radiant/electromagnetic heat transfer that was mentioned in Lesson 1, by the way!)
- If this longwave radiation hits a GHG molecule on its way out, it is absorbed and re-radiated in all directions.
- Some of that longwave radiation (about 50%) heads back toward the earth's surface. This results in warming that would not occur if the GHGs were not in the atmosphere.
The following gases contribute to the greenhouse effect: water vapor (H2O), carbon dioxide (CO2), methane (CH4), nitrous oxide (N2O), and chlorofluorocarbons (CFCs). There are a lot of details about each, but the main focus of anthropocentric climate change are carbon dioxide and methane, because they play the largest role in the climate impact that most scientists believe humans are having.
Note that methane is considered approximately 30 times as powerful as carbon dioxide in terms of causing increased warming (over a 100-year period). Methane is the primary component of natural gas and is what gives natural gas its energy. If natural gas is burned, it releases about half as much CO2 as if you burn an equivalent amount of coal. But if natural gas leaks or is otherwise emitted, it is about 30 times more potent than carbon dioxide. Despite this, carbon dioxide reduction is the main focus because it is far and away the biggest contributor to anthropogenic greenhouse gas emissions impact.
Good to Know: Why does the sun emit mostly visible light?
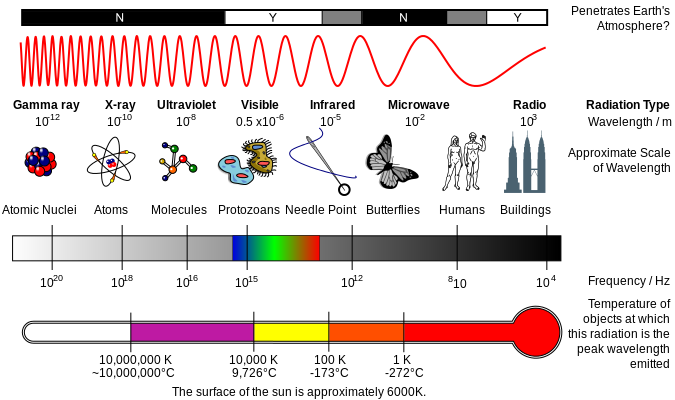
It was mentioned in the video above that the sun emits most of its radiation in the visible spectrum. This is due entirely to its surface temperature. Every object with any temperature above absolute zero emits electromagnetic radiation in a range of wavelengths. (Wavelengths are the distance between the peaks of the electromagnetic waves.) The hotter the temperature, the shorter the wavelengths emitted. See the image below for an illustration of wavelengths. Note that the magnitude of the wavelengths is in meters, e.g. the distance between peaks of visible light is approximately 0.5 x 10⁻⁶ m, or 500 nanometers. (Visible light actually ranges from around 380 nm for violet to around 700 nm for red, according to NASA.)
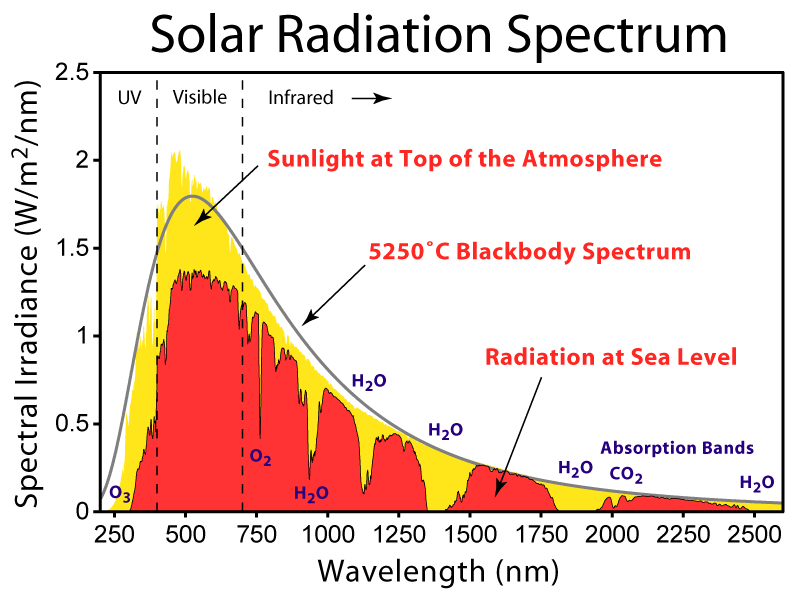
The sun's surface temperature averages between around 5,500 to 6,000 degrees C, which is pretty darn hot. Because it's so hot, the peak radiation is shortwave. More specifically, it peaks in the visible spectrum. The idealized amount of each type of radiation that is emitted by an object can be described using a blackbody radiation curve. Humboldt State University provided a good description of a blackbody radiation curve, now provided on answersmore.com: "The intensity and distribution (and peak) of the radiation depends only on its temperature. The graphical representation of this is commonly known as a Blackbody Radiation Curve. For example, our Sun has an approximate temperature of 5800K and emits peak radiation in the visible portion of the spectrum. The Earth on the other hand is significantly cooler and emits a fraction of the energy and peaks in much longer wavelengths in what's known as the thermal infrared portion of the spectrum."
The image below provides an illustration of the blackbody radiation curve of the sun. Note the peak in the visible portion of the electromagnetic spectrum, but that the sun emits other wavelengths as well. To the left of the visible spectrum (shorter wavelength) is ultraviolet radiation, much of which is absorbed by ozone in the stratosphere. To the right of the visible spectrum on the chart is longwave radiation, much of which is absorbed by greenhouse gases.
Fact 2: Carbon Dioxide Levels are Increasing Due to Human Activity
There are a few fundamental things to know in regards to the carbon dioxide content of the atmosphere.
- First, the amount of CO2 in the atmosphere is measured in parts per million (ppm). A concentration of 1 ppm means that there is one unit of mass of fluid for every million units of mass of the enveloping fluid. The current concentration of carbon dioxide is a little more than 400 ppm. (FYI, this means that if you took 1 kg of air, there would be about 400/1,000,000 kg, which is 0.0004 kg or 0.4 g of CO2 in that kg of air.)
- Second, when measuring concentration, the atmosphere is considered effectively the same everywhere you go on earth. Localized variations occur, but the current CO2 concentration is considered to be effectively the same no matter where you are on the earth.
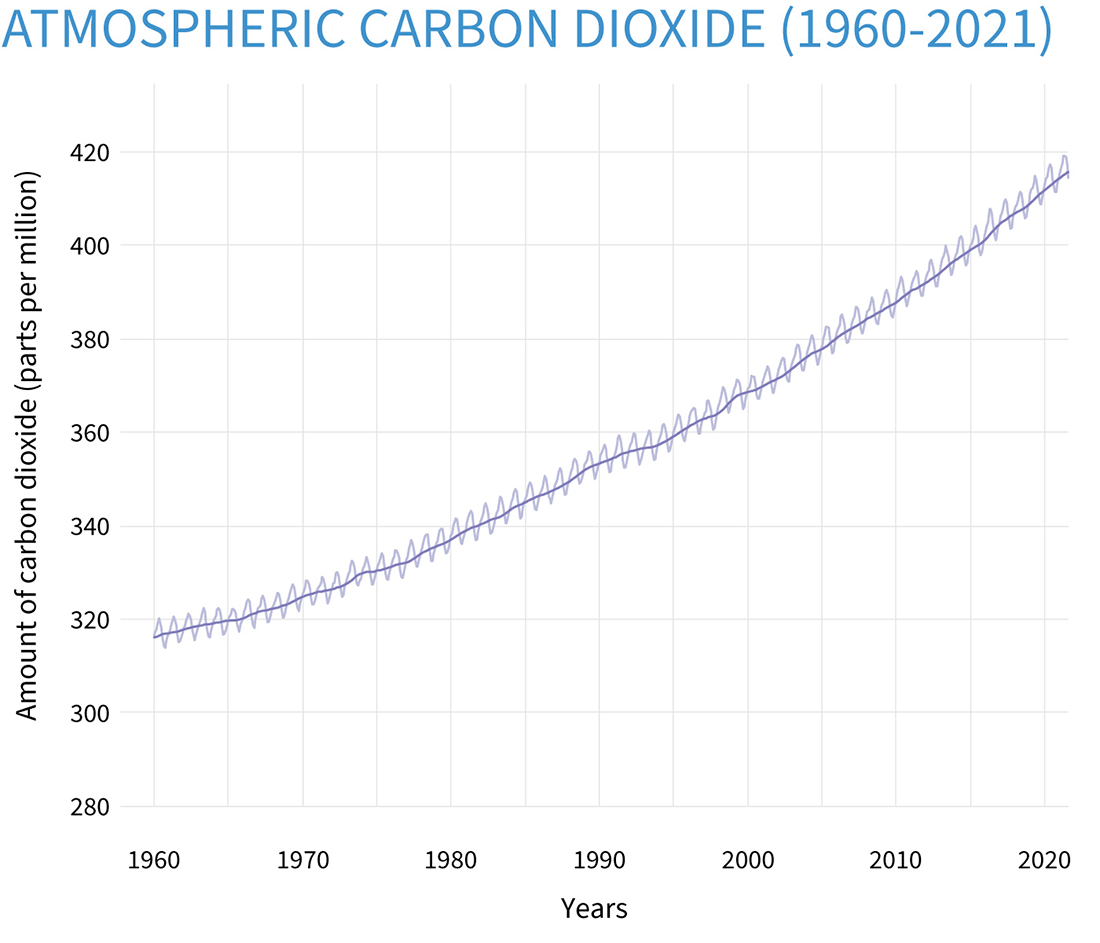
We have been directly measuring the atmospheric concentration of CO2 since 1958 in the Mauna Loa Observatory in Hawaii and have seen it increase steadily since then (see Figure 3.5 below). This is known as the Keeling curve, and is named after Andrew Keeling, who initiated the measurements.
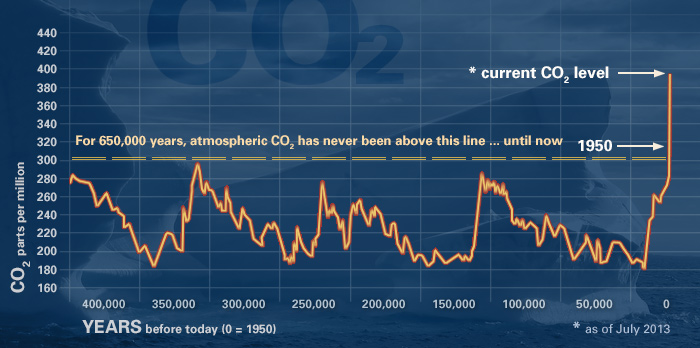
We also know with a very high level of certainty the concentration of the ancient atmosphere through time as well through proxy measures such as ice core samples from ancient ice (click here for some links to explanations of how this is done- click on CO2 Past at the top of the page). The current levels of CO2 are almost certainly unprecedented in the past 800,000 years. The chart below depicts the carbon dioxide levels in the atmosphere for the past 400,000 years.
It is an established fact that the burning of fossil fuels releases carbon dioxide and that the concentration of carbon dioxide has been increasing rapidly since around the beginning of the Industrial Revolution in the late 1700s. The Industrial Revolution is characterized by the increased use of fossil fuels - first coal, then oil, then natural gas. All of these non-renewable energy sources release CO2 when burned, and aside from minor natural occurrences like volcanic eruptions, are what has primarily caused the increased carbon dioxide concentration over the past 200+ years.
In short, energy is the primary culprit in anthropogenic greenhouse gas emissions. In fact, according to the International Energy Agency, two-thirds of global anthropogenic greenhouse gas emissions are due to energy use and production (source: IEA, "Energy and Climate Change," World Energy Outlook 2015). This boils down to the fact that:
- We are emitting carbon dioxide and other greenhouse gases at rates faster than can naturally be absorbed.
This causes an imbalance, and thus the concentration increases. This is one of the fundamental things to understand about sustainability that has been addressed a few times in this course: As noted last lesson, and as Herman Daly stated in regards to the steady state economy, we simply cannot emit wastes faster than they can be naturally reabsorbed.
Mythbusting: The Earth Emits More CO2 Than People Do, So We Don't Make An Impact
You may hear something like the following as a reason to be skeptical of anthropogenic climate change: "The earth naturally emits WAY more CO2 than humans do. The emissions are so relatively small that they cannot have an impact on CO2 concentrations, never mind climate change."
The earth does, in fact, emit significantly more CO2 than humans do! The image below is from the Intergovernmental Panel on Climate Change's (IPCC) most recent report, called the Fifth Assessment Report or simply AR5. This is an illustration of the global carbon cycle. Carbon, like most other elements, is constantly moving around the earth, e.g. being emitted and absorbed by oceans, being taken up by plants, being released by decaying plants, being released by volcanoes, etc. The carbon cycle illustrates this process. (Don't worry about analyzing this image if you don't want to - it's pretty dense, and you do not need to know any of the numbers.)
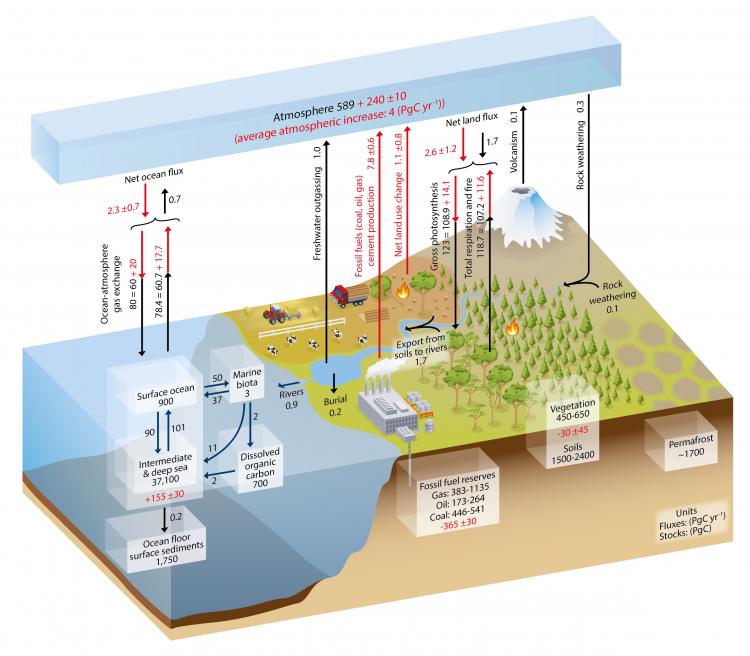
This is a pretty busy image, so I'll summarize it for you:
- Humans directly cause about 9 billion tons (Gt) of carbon to enter the atmosphere each year.
- Natural emissions are on the order of 170 Gt per year.
Hmm, okay, so there are way more natural than anthropogenic emissions. So why care so much about the measly 9 billion anthropogenic ton? As it turns out, if there were no anthropogenic emissions, the carbon cycle would likely even out, or perhaps even cause a reduction in carbon in the atmosphere. There are many natural processes that absorb carbon, mostly oceans, and vegetation. According to the IPCC, the total increase in carbon in the atmosphere is only about 4 Gt per year (including anthropogenic emissions). If you do a little math it becomes apparent: if those 9 Gt of emissions caused by humans were not there, then there would likely be no increase in overall concentration. Even though the relative contribution is small, anthropogenic emissions throw the global carbon cycle out of whack.
One good analogy of this process is weight gain. Let's say you average around 2,000 calories of food intake each day, and on average you burn off the same amount each day. If this continues over time, you will not gain weight. But if you add one extra 100 calorie snack each day, it will throw this balance out of whack. Even though you are only increasing your calorie intake by a measly 5%, over time this will cause weight gain. Well, it appears that the earth has put on some serious carbon weight in the past ~200 years, and it is almost entirely due to the extra human emissions!
Fact 3: The Climate Is Warming
Humans have been taking direct temperature measurements since about 1880. There has been an upward trend in global temperature since around 1900, and the increase has become very sharp since about 1980.

Optional Reading
According to the National Oceanic and Atmospheric Administration (NOAA) (via NASA):
"Nineteen of the warmest years have occurred since 2000, with the exception of 1998. The year 2020 tied with 2016 for the warmest year on record since record-keeping began in 1880"
Based on this evidence (which has been corroborated by other scientific sources) and Figure 3.8 above, it is clear that the global temperature has been increasing since humans have been measuring it on a global scale, and it appears that the warming is accelerating.
One note of caution: The earth operates in cycles of thousands and millions of years, so less than 150 years of warming is not irrefutable evidence that the climate will continue to warm at this rate. However, the correlation that is observed between increased CO2 levels and temperature, along with what we know about GHGs, indicates that we are on a very unsustainable path.
Mythbusting: 2 Degrees of Warming. What's the Big Deal?
There is wide agreement that the Earth's average global temperature has increased about 2 degrees Fahrenheit since the beginning of the 20th century. I am the first to admit that this does not seem like a big deal, but it takes a LOT lof extra heat to increase global temperatures by that much and a few degrees can make a huge difference in the climate system. As NASA states:
Two degrees may sound like a small amount, but it's an unusual event in our planet's recent history. Earth's climate record, preserved in tree rings, ice cores, and coral reefs, shows that the global average temperature is stable over long periods of time. Furthermore, small changes in temperature correspond to enormous changes in the environment.
For example, at the end of the last ice age, when the Northeast United States was covered by more than 3,000 feet of ice, average temperatures were only 5 to 9 degrees cooler than today.
Fact 4: If Climate Change Continues, the Results Will Almost Certainly Be Catastrophic
There is wide consensus that if the climate continues to change and CO2 levels continue to rise, the results will not be good (okay, "not good" is a pretty big understatement). As the Intergovernmental Panel on Climate Change (IPCC) stated in their 2013 report: "Taken as a whole, the range of published evidence indicates that the net damage costs of climate change are likely to be significant and to increase over time" (source: IPCC, quoted by NASA). This is a stuffy way of saying that "things will probably be really bad and continue to get worse."
The link below outlines some of the possible impacts, some of which have already begun to occur. Note that I am not saying that all of these things will happen, even if climate change continues, but it is meant as a survey of some of the most commonly cited negative impacts of climate change. Also note that some of the likely consequences may be positive in some areas, including extended growing seasons in cool climate zones and some increased growth of plants due to extra carbon being available, but the overall impact will very likely be overwhelmingly negative.
Suggested Reading
It is also very important to note that the most vulnerable to these impacts will be low-income and otherwise marginalized people all over the world. As the IPCC states in their 2014 assessment:
"(Climate change) risks are unevenly distributed and are generally greater for disadvantaged people and communities in countries at all levels of development" (IPCC, Climate Change 2014 Syntheses Report, p. 13).
Translation: the people with little power and/or resources will be disproportionately affected by climate change, regardless of whether they live in a low- or high-income country. This is thus an important social and environmental justice issue!
Mythbusting: Weather vs. Climate
I wish that I did not have to note this, but it is such a frequent occurrence that I would be remiss if I did not. Okay, here goes: Weather and climate are two different things. Weather refers to short-term variations in ambient atmospheric conditions, mostly day-to-day. It can be hot and sunny one day, and cold and rainy the next. This is weather. Climate refers to long-term trends in atmospheric conditions, which exhibit seasonal trends over the course of decades. (The National Centers for Environmental Information [NEI] from NOAA has some information here, if you are interested.) As NEI puts it: "Climate is what you expect. Weather is what you get." In other words, you can expect a certain type of condition based on the season, but the weather can change daily. The tweet below from Donald Trump in January of 2019 is typical of the conflating (on purpose or otherwise) of weather and climate.
In the beautiful Midwest, windchill temperatures are reaching minus 60 degrees, the coldest ever recorded. In coming days, expected to get even colder. People can’t last outside even for minutes. What the hell is going on with Global Warming? Please come back fast, we need you!
— Donald J. Trump (@realDonaldTrump) January 29, 2019
There are in fact at least two important things wrong about this statement.
- First, this is just weather. 2019 was in the top three hottest years ever recorded.
- Second, it is called "global" climate change for a reason. Regional effects are only one small part of the story. It is essential to look at temperatures across the world. The image below from January of 2019 clearly shows that yes, the upper Midwest was colder than normal, but almost the entire rest of the U.S. was warmer than normal, as was most of the world.
Fact 5: There is Broad Scientific Consensus that Humans are the Primary Driver of Observed Climate Change
First of all, it is important to recognize that the climate is a complex system that cannot as of yet be completely modeled. There are gaps in our knowledge, so we do not know with 100% certainty the extent to which our emissions are impacting the climate. But, the evidence has become increasingly clear and compelling.
The Intergovernmental Panel on Climate Change (IPCC) is the most highly regarded climate change research body in the world, as it is made up of over 1,000 of the top climate scientists in the world. Their conclusion in their most recent report in the summer of 2021:
It is unequivocal that human influence has warmed the atmosphere, ocean and land. Widespread and rapid changes in the atmosphere, ocean, cryosphere and biosphere have occurred...Human-induced climate change is already affecting many weather and climate extremes in every region across the globe
In addition, multiple reports in peer-reviewed journals have found that at least 97% of scientists actively publishing in the climate field agree that the climate change observed in the past century is likely due to human influence, i.e., it is anthropogenic. See these links to some studies. In 2015, 24 of Britain's top "Learned Societies" - groups of scientific experts, basically - wrote a letter urging that we need to establish a "zero-carbon world" early in the second half of the 21st century. In the past 15 years, 18 U.S. scientific associations have confirmed that climate change is likely being caused by humans. Big players in the private sector are concerned as well. For example, CEOs from 43 companies in various sectors (with over $1.2 trillion of revenue in 2014) signed an open letter urging action in April of 2015. Even Exxon Mobil states as their official position on climate change (as of the summer of 2018) that:
"We believe that climate change risks warrant action and it’s going to take all of us — business, governments and consumers — to make meaningful progress."
Exxon Mobil, the world's largest publicly traded oil and gas company, is not known to be a friend of carbon reduction advocates. In fact, a study published in August of 2017 found that they systematically misled the public for nearly 40 years about the dangers of climate change, even though they acknowledged the risks internally. Yet even they assert that emissions should be reduced.
Mythbusting: It's China's Fault
(Note: You are welcome to browse and play with the charts below, but please at least read this short explanation.)
You might also hear that China is the world leader in emissions. This is true, and has been since 2006/2007 (see the first chart below). There are at least three important considerations to make with regards to assigning blame for global emissions, though:
- First, CO2 emissions can last for hundreds of years in the atmosphere, so we should consider the cumulative emissions over the past few hundred years. As the second chart below shows, the U.S. has nearly twice the cumulative emissions as China.
- Second, China has about four times the population of the U.S. So all else being equal, China "should" have about four times the emissions. But they don't. This means that their emissions per capita are lower than the U.S. As it turns out, China emits a little more than half the emissions per capita as the U.S.
- Finally, as the charts indicate the data are "based on territorial emissions (production-based) and do not account for emissions embedded in trade." Most of China's emissions are the result of producing goods for other countries, so the accounting methods are not entirely fair.
Putting it All Together
Let's consider these facts together:
- We know that the greenhouse effect warms the planet and that carbon dioxide is a greenhouse gas.
- We know that humans are emitting greenhouse gases at a rate that is increasing their concentration in the atmosphere.
- We know that the global climate is warming.
These three facts alone indicate that there is likely a problem. But, on top of this, you add that:
- The vast majority of active climate scientists agree that climate change is a problem and that observed climate change is anthropogenic. So, the people that we trust to understand the climate widely agree that it is a problem.
- Finally, if climate change is happening, then the results will likely be devastating and on a global scale.
We know that humans are impacting the climate. Do we know the exact extent to which we are? The short answer is "no." The longer answer is that we are almost certain that humans are the primary cause of the warming that has occurred and that it is worth taking the precaution to prevent the worst of climate change just in case. Yes, it is possible that so many climate experts are wrong about the severity of the human impact on the climate - it is a rare occurrence that so many experts are wrong, but there is a possibility, however miniscule. And yes, there will be costs associated with making the change to a low-carbon society. But why do people buy life insurance? What about fire insurance? As silly as it sounds, what about buying an extended warranty on a new piece of electronics, or extra insurance for a rental car? The point is that even though the likelihood of using those insurances is minimal, people are willing to pay the cost in order to avoid catastrophe. The same could be said of climate change. Taking steps to avoid the worst-case scenario, or perhaps something near the worst-case scenario, is known as the precautionary principle. This may cost money or other resources in the short term, but is seen as worth it because of the situation it may prevent.
One quick addendum to this: If steps are successfully taken to reduce climate emissions to a sustainable level, it is very likely that there will also be cleaner air, less environmental damage, more energy security (not being dependent on another country for energy), and probably more active/healthy citizens. Something to think about.
Good to Know - Wicked Problems
Climate change is a very complicated, multifaceted, and unique problem that overlaps a multitude of sectors and has no capital "S" Solution. This, among other things, makes it a so-called "wicked problem." Stony Brook University provides an excellent synopsis of wicked problems. (Feel free to read more about them here.)
- They do not have a definitive formulation.
- They do not have a 'stopping rule.' In other words, these problems lack an inherent logic that signals when they are solved.
- Their solutions are not true or false, only good or bad.
- There is no way to test the solution to a wicked problem.
- They cannot be studied through trial and error.
- Their solutions are irreversible so, as Rittel and Webber put it, 'every trial counts.'
- There is no end to the number of solutions or approaches to a wicked problem.
- All wicked problems are essentially unique.
- Wicked problems can always be described as the symptom of other problems.
- The way a wicked problem is described determines its possible solutions.
- Planners, that is those who present solutions to these problems, have no right to be wrong. Unlike mathematicians, 'planners are liable for the consequences of the solutions they generate; the effects can matter a great deal to the people who are touched by those actions.'
Check Your Understanding
Further Reading - OPTIONAL
If you are interested in reading more about this topic, here are some suggested readings.
- "Climate Change 2021: The Physical Science Basis, Summary for Policymakers." Intergovernmental Panel on Climate Change.
- U.S. Environmental Protection Agency's Climate Change Website
- Link to a number of IPCC documents.
Optional (But Strongly Suggested)
Now that you have completed the content, I suggest going through the Learning Objectives Self-Check list at the top of the page.