Lesson 3: Critical Thinking and Specific Sustainability Issues
Overview
The material covered in this lesson applies a lot of the concepts introduced in Lessons 1 and 2 to specific issues related to sustainability. We could spend a whole semester on just this content, so the focus has been reduced to three areas of consideration: climate change, freshwater availability, and biodiversity. In addition, the beginning of the lesson provides some insight into critical analysis, and how to investigate the credibility of sources of information, a key concern in critical analysis.
Lesson Objectives
By the end of this lesson, you should be able to:
- utilize characteristics of critical thinking;
- analyze the credibility of information sources;
- identify characteristics of the Anthropocene;
- explain how the greenhouse effect increases the average surface temperature of the earth;
- identify evidence for anthropogenic climate change;
- analyze equity impacts of sustainability considerations, such as climate change and water scarcity;
- identify characteristics of the 6th Mass Extinction;
- explain the benefits of biodiversity;
- analyze sustainability impacts of freshwater availability;
- identify equity implications of access to fresh water; and
- apply the precautionary principle to sustainability considerations.
What is due this lesson?
Please note that the quiz can only be taken once. You have unlimited time to complete it prior to the deadline, and can save your progress and pick up where you left off at a later time. See the Assignments and Grading section of the syllabus [1] for tips on how to do this. Once you submit the quiz, you cannot change answers. All saved answers will automatically be submitted at the deadline if you have not submitted them.
| Requirement | Submission Location |
|---|---|
| Lesson 3 Quiz | Canvas - Modules tab > Lesson 3 |
| Continue posting to the Yellowdig discussion board. | Canvas - Modules tab > Lesson 3 |
| (Optional) Lesson 3 Extra credit quiz | Canvas - Modules tab > Lesson 3 |
Questions?
If you have any general course questions, please post them to our HAVE A QUESTION? discussion forum located under the Discussions tab. I will check that discussion forum regularly to respond as appropriate. While you are there, feel free to post your own responses and comments if you are able to help out a classmate. If you have a question but would like to remain anonymous to the other students, email me.
If you have something related to the material that you'd like to share, feel free to post to the Coffee Shop forum, also under the Discussions tab.
Critical Thinking
Learning Objectives Self-Check
Read through the following statements/questions. You should be able to answer all of these after reading through the content on this page. I suggest writing or typing out your answers, but if nothing else, say them out loud to yourself.
How many times have you been asked to "think critically" about an issue? Have you ever stopped to think what that really means? I think most of us innately understand what it entails, but it is difficult to put into words. I must admit that I am guilty of asking that of students without clearly outlining what I expect, but that ends today for this course! Please take a minute or two to fill out the poll below before continuing.
Fill out the poll below
- Click to respond to the following: "Define critical thinking." [2]
- After you enter your answer, click here to see the real-time results [3]. [4] You can go back to this page at a later time to see results as well. All answers are anonymous to the other students.
- See results [5]from past course sections.
Suggested Reading
What better source to look to for critical thinking advice than the Foundation for Critical Thinking? This is hands-down the best summary of critical thinking that I have seen. You are welcome to read the following, but I summarize the key points below.
- "Defining Critical Thinking [6]." The Foundation for Critical Thinking.
There is a lot to unpack here. Let's take a look at it again, with key elements indicated in bold. It is all important, really, but a few things stand out. I have numbered the paragraphs to assist in the analysis below.
Critical Thinking as Defined by the National Council for Excellence in Critical Thinking, 1987A statement by Michael Scriven & Richard Paul, presented at the 8th Annual International Conference on Critical Thinking and Education Reform, Summer 1987.
(1) Critical thinking is the intellectually disciplined process of actively and skillfully conceptualizing, applying, analyzing, synthesizing, and/or evaluating information gathered from, or generated by, observation, experience, reflection, reasoning, or communication, as a guide to belief and action. In its exemplary form, it is based on universal intellectual values that transcend subject matter divisions: clarity, accuracy, precision, consistency, relevance, sound evidence, good reasons, depth, breadth, and fairness.
(2) It entails the examination of those structures or elements of thought implicit in all reasoning: purpose, problem, or question-at-issue; assumptions; concepts; empirical grounding; reasoning leading to conclusions; implications and consequences; objections from alternative viewpoints; and frame of reference. Critical thinking — in being responsive to variable subject matter, issues, and purposes — is incorporated in a family of interwoven modes of thinking, among them: scientific thinking, mathematical thinking, historical thinking, anthropological thinking, economic thinking, moral thinking, and philosophical thinking.
(3) Critical thinking can be seen as having two components: 1) a set of information and belief generating and processing skills, and 2) the habit, based on intellectual commitment, of using those skills to guide behavior. It is thus to be contrasted with: 1) the mere acquisition and retention of information alone, because it involves a particular way in which information is sought and treated; 2) the mere possession of a set of skills, because it involves the continual use of them; and 3) the mere use of those skills ("as an exercise") without acceptance of their results.
(4) Critical thinking varies according to the motivation underlying it. When grounded in selfish motives, it is often manifested in the skillful manipulation of ideas in service of one’s own, or one's groups’, vested interest. As such it is typically intellectually flawed, however pragmatically successful it might be. When grounded in fair-mindedness and intellectual integrity, it is typically of a higher order intellectually, though subject to the charge of "idealism" by those habituated to its selfish use.
(5) Critical thinking of any kind is never universal in any individual; everyone is subject to episodes of undisciplined or irrational thought. Its quality is therefore typically a matter of degree and dependent on, among other things, the quality and depth of experience in a given domain of thinking or with respect to a particular class of questions. No one is a critical thinker through-and-through, but only to such-and-such a degree, with such-and-such insights and blind spots, subject to such-and-such tendencies towards self-delusion. For this reason, the development of critical thinking skills and dispositions is a life-long endeavor.
Source: The Foundation for Critical Thinking [6]
Let's look at these paragraphs one at a time:
- Critical thinking requires skilled evaluation of information using all manner of analytical and observational tools at your disposal. Regardless of what you are analyzing, you should use the same or similar set of skills. Critical thinking transcends the subject material.
- Critical thinking requires self-evaluation of what you know and do not know, your assumptions, the scientific basis of the problem at hand, and an analysis of the results. One aspect of this is looking at issues from viewpoints different than your own, to the extent possible.
- Critical thinking requires more than just "knowing things" and having information processing skills. You must apply this knowledge and these skills, and accept the results, whether they are the results you had hoped/expected or not.
- If you are seeking selfish (subjective) motives, you may be able to think critically, but the results will usually be flawed. You must approach the issue with "intellectual integrity," which really refers to the above three points (thorough analysis and acceptance of the results).
- No one knows everything, and everyone is subject to bias by virtue of being limited in knowledge and experience. You can be an extremely skilled critical thinker but are limited by your knowledge and experience in the topic at hand. The best critical analysis may arrive at an incorrect conclusion due to this. The flip side of this is that the more you know about, experience, and objectively analyze a piece or type of information, the more likely you are to arrive at a sound conclusion. As stated in the article: "The development of critical thinking skills and dispositions is a life-long endeavor."
They also provide a good approach to critical thinking:
A well cultivated critical thinker:
- raises vital questions and problems, formulating them clearly and precisely;
- gathers and assesses relevant information, using abstract ideas to interpret it effectively;
- comes to well-reasoned conclusions and solutions, testing them against relevant criteria and standards;
- thinks open mindedly within alternative systems of thought, recognizing and assessing, as need be, their assumptions, implications, and practical consequences; and
- communicates effectively with others in figuring out solutions to complex problems.
Source: The Foundation for Critical Thinking [6]
The following is a brief explanation of each aspect:
- raises vital questions and problems, formulating them clearly and precisely; (Did you deeply contemplate the information and ask relevant questions that help you verify it? This aspect really puts the "critical" in "critical thinking" - you should think like a scientist and question everything, even if the information reinforces your existing beliefs.)
- gathers and assesses relevant information, using abstract ideas to interpret it effectively; (Pretty self-explanatory. Search for information from reliable outside sources that helps you evaluate the information. Consider hypotheticals that test the validity of the information.)
- comes to well-reasoned conclusions and solutions, testing them against relevant criteria and standards; (Use logic to arrive at conclusions, based on the information that you have gathered and considerations you contemplated. As you did above, test these conclusions with reliable sources and standards.)
- thinks open mindedly within alternative systems of thought, recognizing and assessing, as need be, their assumptions, implications, and practical consequences; (Think about the information and your conclusion from the perspective of someone who thinks the information is wrong and/or approaches it from a different perspective. The more alternative perspectives, the better.)
- communicates effectively with others in figuring out solutions to complex problems. (Self-explanatory. If possible, do not just arrive at the conclusion on your own! Talk through it with others.)
This is all very good advice when reading through the material in this course. I am asking you to apply these principles as much as possible. Keep an open mind, and try to analyze information using evidence, logic, reason, and with an eye on alternative viewpoints. Try to recognize the limitations of your knowledge, and attempt to be self-critical with regards to biases and limited worldviews that you have. Embrace discussion with others, and try to approach discussions with the intent of learning from each other to come to a reasonable conclusion, not to convince the other person that you are correct. This is particularly important because some of the material that follows is considered controversial in some circles, largely because it does not fit with certain worldviews and social/political modes of thinking. Please do your best to look at things as objectively as possible.
To be clear, I do not claim to know all of the answers and recognize that I have limitations in knowledge. The ideas presented in this course are based on reliable evidence, but many of the issues are not clear-cut and are thus open to substantive discussion. As noted in the Orientation, respectful dialogue is encouraged, and often the best way to learn is to discuss things with someone that does not agree with you. I hope that we can have good, substantive discussions throughout this course.
One last thing and this probably goes without saying but I'll say it anyway: critical thinking should be "systematically cultivated," as stated in the reading, and applied constantly. It is useful for every human endeavor, and certainly, can and should be applied beyond this course.
Optional (But Strongly Suggested)
Now that you have completed the content, I suggest going through the Learning Objectives Self-Check list at the top of the page.
Critiquing Information Sources
Learning Objectives Self-Check
Read through the following statements/questions. You should be able to answer all of these after reading through the content on this page. I suggest writing or typing out your answers, but if nothing else, say them out loud to yourself.
As I'm sure you know, there is no shortage of information sources available to us, especially those of us with an Internet connection. We live in a unique moment in human history [7] - never before has it been so easy for so many to access so much information so quickly. But having so much available can make it difficult to determine whether or not information sources can be trusted. Engaging in critical thinking requires (among other things) knowing credible sources of information. This is an imperfect science, but there are many ways to evaluate sources. Harvard University provides a good, straightforward guide to doing this.
Suggested Reading
- "Harvard Guide to Using Sources [8]." Read through the "Questions to Ask About All Sources," "Evaluating Journal Articles," and "Evaluating Web Sources." You are welcome to read the rest of the website - there is a lot of good, relevant information there. I summarize the key points below.
I will ask you to analyze the reliability of information sources throughout the semester, so please take the time to read this thoroughly. Here are some general and additional tips:
- Always check sources! This can't be stressed enough. Any information critique that does not include this is incomplete. As indicated in a previous lesson, peer-reviewed journals are generally the most reliable information sources, but there are many reliable sources that are not peer-reveiwed. (Note that often, non-peer reviewed articles use data from peer-reviewed sources.) Consider the expertise of the author and the organization they are providing content for, especially if no outside sources are used. Keep in mind that reliable outside information can be misconstrued, purposefully or not, so it is a best practice to refer to the original soruce of information if possible.
- Always consider the author's credentials. All else being equal, someone who has spent many years analyzing a subject or has advanced training is more likely to be reliable than someone with thin credentials.
- Consider the objectivity of the language used. Does the author use language that is clearly designed to sway you one way or the other? Is it designed to elicit an emotional reaction? Or do they use objective, analytical, academica language?
- Be careful when using a source that is expressly opinion-based, e.g., in the Opinion pages of the newspaper (hard copy or online). An opinion is not necessarily wrong - there are certainly such things as "well-informed" opinions - but you should not use this as an academic reference. Opinions from people you trust are a great way to learn things, but you should not use them as unvarnished truth. Always seek to corroborate the information provided.
- As indicated by the Harvard articles, I strongly suggest corroborating factual information presented in the article elsewhere (in general, not just for opinions).
- Currency is important for some sources (especially for things like technology), but for others, it is less important (e.g., historical events, foundational theories). Use your best judgment.
- If you don't know already, do some research about the author of the article. Use Google to your advantage! You can search "<author or organization's name> bias" or "is <name> biased," etc. I strongly suggest searching for other articles/websites published by the author/organization. Oftentimes, you can click on the author's name on the website and it will link you to other articles written by them. Scan through them and see if a consistent bias (or at least worldview) is presented. It will often become obvious if someone holds a certain political/social viewpoint. There are some sites that provide bias charts and evaluations, such as the Ad Fontes Media Bias Chart [9] and All Sides Medi [10]a.
- The same advice as the previous point goes for the site owner - look through articles published on the website, and try to figure out if a one-sided viewpoint is presented. All that said, keep in mind that just because someone holds a certain worldview does not mean that the information is unusable (complicated, I know!). There are many reliable information sources (people and organizations) that hold a certain worldview. You should consider the other aspects of the information, particularly the objectivity. Also, keep a look out for consistently extreme viewpoints.
- Do NOT take a website's self-description as proof of its objectivity. I wish it were that easy! Even the most biased of sources want you to believe that they are unbiased.
- Just because a website is a ".org" and not a ".com" does not mean it is unbiased. In fact, the type of organization is pretty meaningless. There are a lot of biased non-profits out there.
Overall, understanding the reliability of sources gets easier with time. The keys are a) to keep reading and paying attention to other information sources, b) to constantly investigate the reliability of sources, and most importantly c) learn as much as you can! The more you do this, the more you will develop a "bias detector," so to speak.
This can be complicated, so here are a few scenarios that might help you as you evaluate sources throughout the course. This is not comprehensive, but provides some common scenarios you may encounter.
| Information source details | Evaluation |
|---|---|
| The information is pulled directly from a peer-reviewed journal. |
It's a good idea to google the journal to see if it's reputable or not, and you should google the author(s) as well. This is the best source of information you can use. |
| The information is NOT an opinion and is from a known reputable source (e.g., NPR, New York Times, Wall Street Journal). | Note that the source is reliable (make sure you know this for a fact), but suggested to look to verify the information elsewhere to be certain. |
| An article provides a summary of peer-reviewed research, but you are not familiar with the source and/or author. |
|
| An article seems reliable, but you are not familiar with the source and/or author. |
Follow all of the steps listed in the box above. |
| The website is a non-profit (.org). | As stated above, this is basically meaningless! There are many objective non-profits, but many biased ones. Perform the research indicated above. |
| The information comes from an academic institution. |
|
| You click on the "about" link on the organization's website, and they state that: "<name of organization> provides research-based, unbiased information about..." |
|
| The information seems reliable, but is on a site that has a known bias (e.g. Fox News or MSNBC) or is from an advocacy organization or company that might seek to promote their own interest. |
|
| The information is from a government website. |
|
| The information is on Wikipedia. | NEVER cite Wikipedia! It is absolutely fine to use it as an initial source, but ALWAYS use another, reputable source to verify the information. Wikipedia does a good job of citing their sources, so click on the citation/footnote link to find the original source, and proceed from there. I love looking up things on Wikipedia as much as the next person, but I never assume that it is accurate unless I can verify it elsewhere. |
Final Thought
Please know that you are not expected to memorize all of this! I will try to be as clear as possible when I ask you how to analyze a source. But moving forward you should always at least investigate the following when analyzing a specific information source:
- If it is an article from a peer-reviewed journal, mention that specifically. Then at least look at the credentials of the author(s) and make sure they provide citations for information that they use.
For any other article, evaluate the following:
-
Author's credentials (e.g. Do they appear to be an authority on the subject? Is their expertise relevant?)
-
Objectivity of the way the information is presented in the article (e.g. is it matter-of-fact/objective or does it use sensational/emotional language?)
-
Objectivity of the site the information is on (Investigate other articles on the website to see if their appears to be an agenda.) For example, is the article on Fox News? New York Times? Etc. Does that site have an agenda?
-
Reliability of original source material (Does the author use reliable sources? Can you find other reliable sources that have the same information? Do they cite all sources?)
Keep in mind that this is as much an art as a science! Use your best judgment based on the factors above to evaluate the source. Remember that a source can be totally reliable, totally unreliable, or all points between.
Optional (But Strongly Suggested)
Now that you have completed the content, I suggest going through the Learning Objectives Self-Check list at the top of the page.
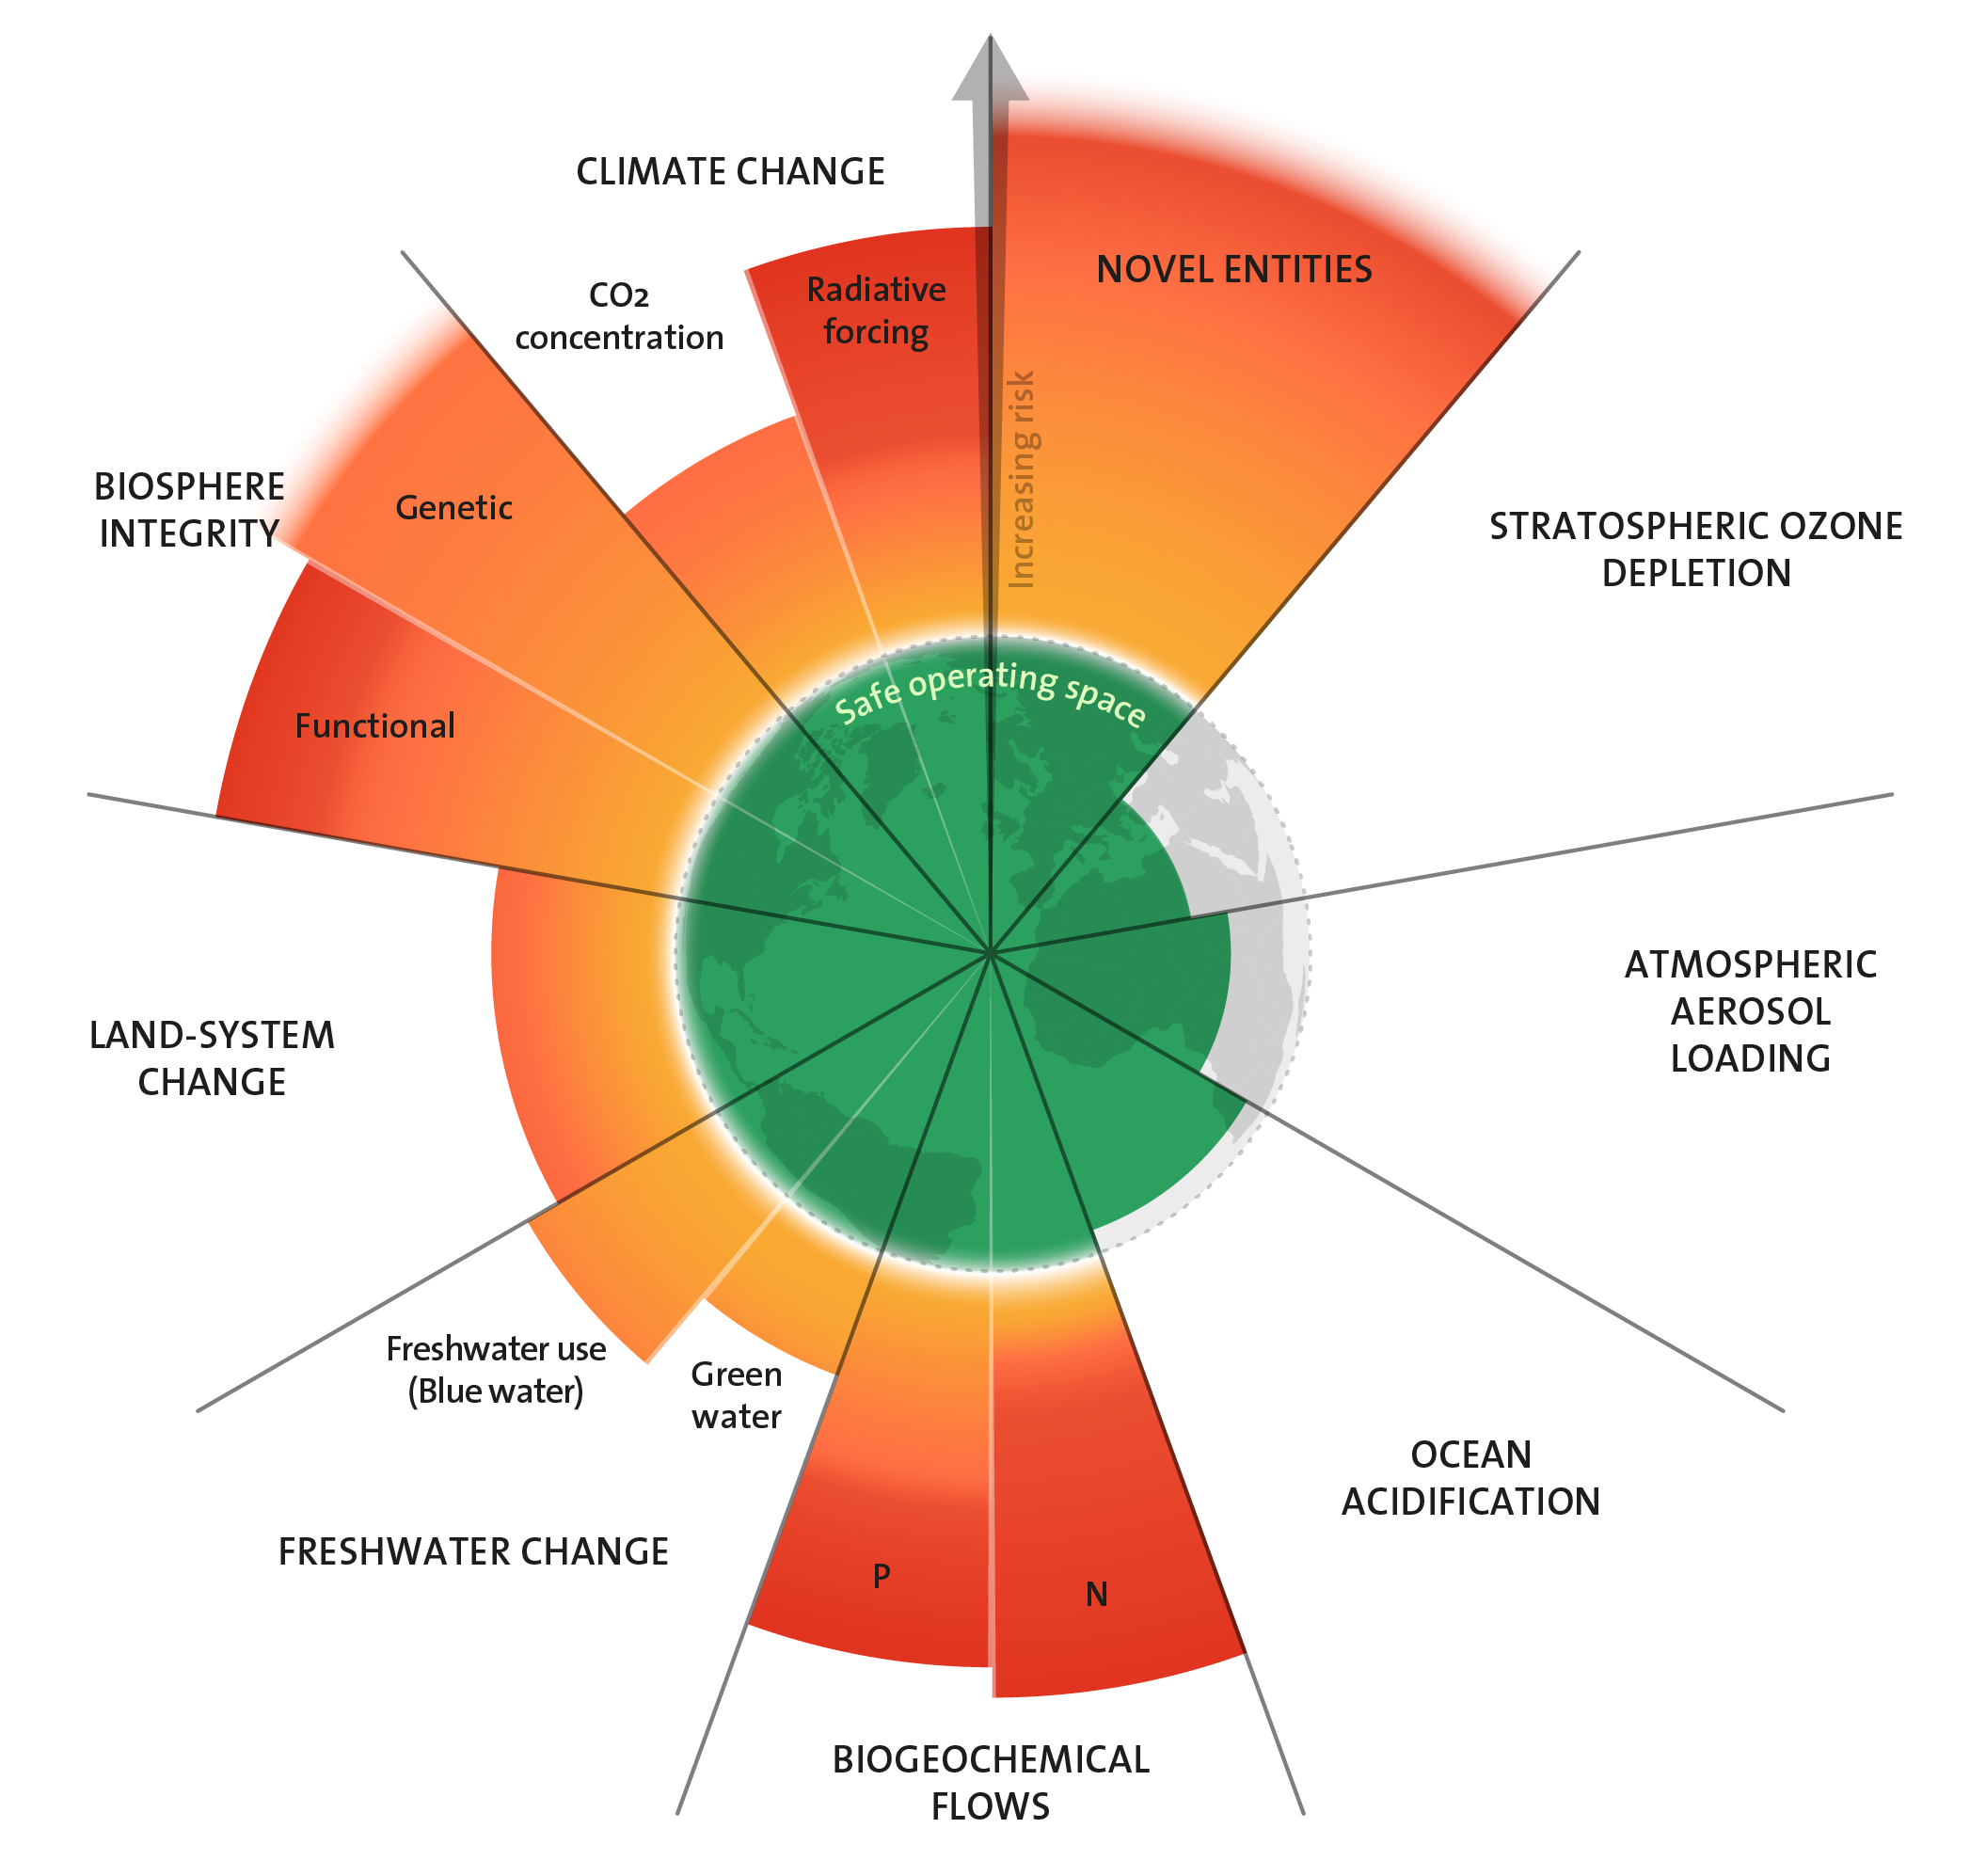
Respecting Planetary Boundaries - Life in the Anthropocene
Learning Objectives Self-Check
Read through the following statements/questions. You should be able to answer all of these after reading through the content on this page. I suggest writing or typing out your answers, but if nothing else, say them out loud to yourself.
Before diving into specific sustainability issues, we'll get an overview of some of the key "planetary boundaries," as outlined by Carl Folke In Chapter 2 ofIs Sustainability Still Possible? As you'll see, we'll go over some of these in more detail in this lesson. One important term that Folke does not define, but is important to understand, is ecosystem services. The National Wildlife Federation [11] defines an ecosystem service as:
"any positive benefit that wildlife or ecosystems provide to people."
Examples include plants that convert carbon dioxide into oxygen, fisheries that naturally replenish themselves and feed humans, wetlands that filter toxins and mitigate storm impacts, soil organisms that foster plant growth, and bees that pollinate food crops and other plants. We could cite innumerable examples, but without ecosystem services, life on earth would not be possible. Further, much of what we depend on for survival is offered for free by nature. Most ecosystem services are performed by the biosphere, which "includes all living organisms on earth, together with the dead organic matter produced by them." (Credit: Encyclopedia of Earth [12]).
To Read Now
- Read pp. 19 - 22 of chapter 2 of Sustainability Still Possible?. "Respecting Planetary Boundaries and Reconnecting to the Biosphere." This is located in the Module tab under Lesson 3. Note that I summarize key content below.
- Skim through the most up-to-date status of the 9 Planetary Boundaries [13] and a description of each of the 9 boundaries [14]. This link takes you to the Stockholm Resilience Center, which is where the 9 Planetary Boundaries concept originated. (Not required, but you can access a downloadable, resizeable image of the Planetary Boundaries here [15].)
- "Ecosystem Services [16]." National Wildlife Federation.
The following is a summary of some key points from the readings:
- Folke starts out with a brief discussion of the biosphere, which is "the living part" of the area on and near the earth's surface.
- He points out that humans have become "a dominant force in the operation of the biosphere."
The time that we find ourselves in now is what he terms the "Anthropocene," which he defines as "the age in which human actions are a powerful planetary force shaping the biosphere."
- Note that the term "Anthropocene" is well-known in scientific circles - Folke is nowhere near alone in using it! Regardless, the unprecedented success of the human species during this time has "to a large extent...been enabled by the human ability to draw on the functioning of the biosphere." He notes that ecosystem services (e.g., "fertile soils, storm protection, and sinks for greenhouse gases and other wastes") have played an essential role in humanity's success.
- He points out that there have been many positive benefits to people, but that we are overburdening the biosphere and risk "undermin(ing) the capacity of life [17]-supporting ecosystems to...provide the essential ecosystem services that human well-being ultimately depends on."
- If we humans are to continue the success that we have realized in the past few thousand years, he believes that we need to work on reducing our ecological impact to the point that ecosystems can continue to thrive and provide essential services. In order to do this, he points to the need to measure our impact in "critical biophysical processes in the Earth's system." These are termed the "nine planetary boundaries."
- The nine planetary boundaries provide metrics that can be analyzed to determine if humans are overusing ecological capacity. They are called "boundaries" because they represent indicators of when we have crossed into dangerous territory. He is careful to point out that there is some uncertainty with some of the boundaries, but that they provide the best scientific analysis of whether or not humanity is operating within safe ecological limits.
Why call it the Anthropocene?
So where does the term Anthropocene come from? You may remember the concept of the geologic time scale [19] from Geology or Environmental Science class, which is how the earth's history is separated into different time periods called eons, eras, periods, epochs, and ages. (Refer to this chart from the Geological Society of America [20] for details.)
The Holocene epoch began around 10,000 years ago, and saw the beginning of agriculture and thus permanent human settlements. The term "Anthropocene" is a deliberate reference to the fact that humans have become such a dominant force in the world that many scientists consider it to be a new geologic epoch. "Anthro" refers to "humans" (remember anthropocentric from an earlier lesson?), which is why it is referred to as the Anthropocene.
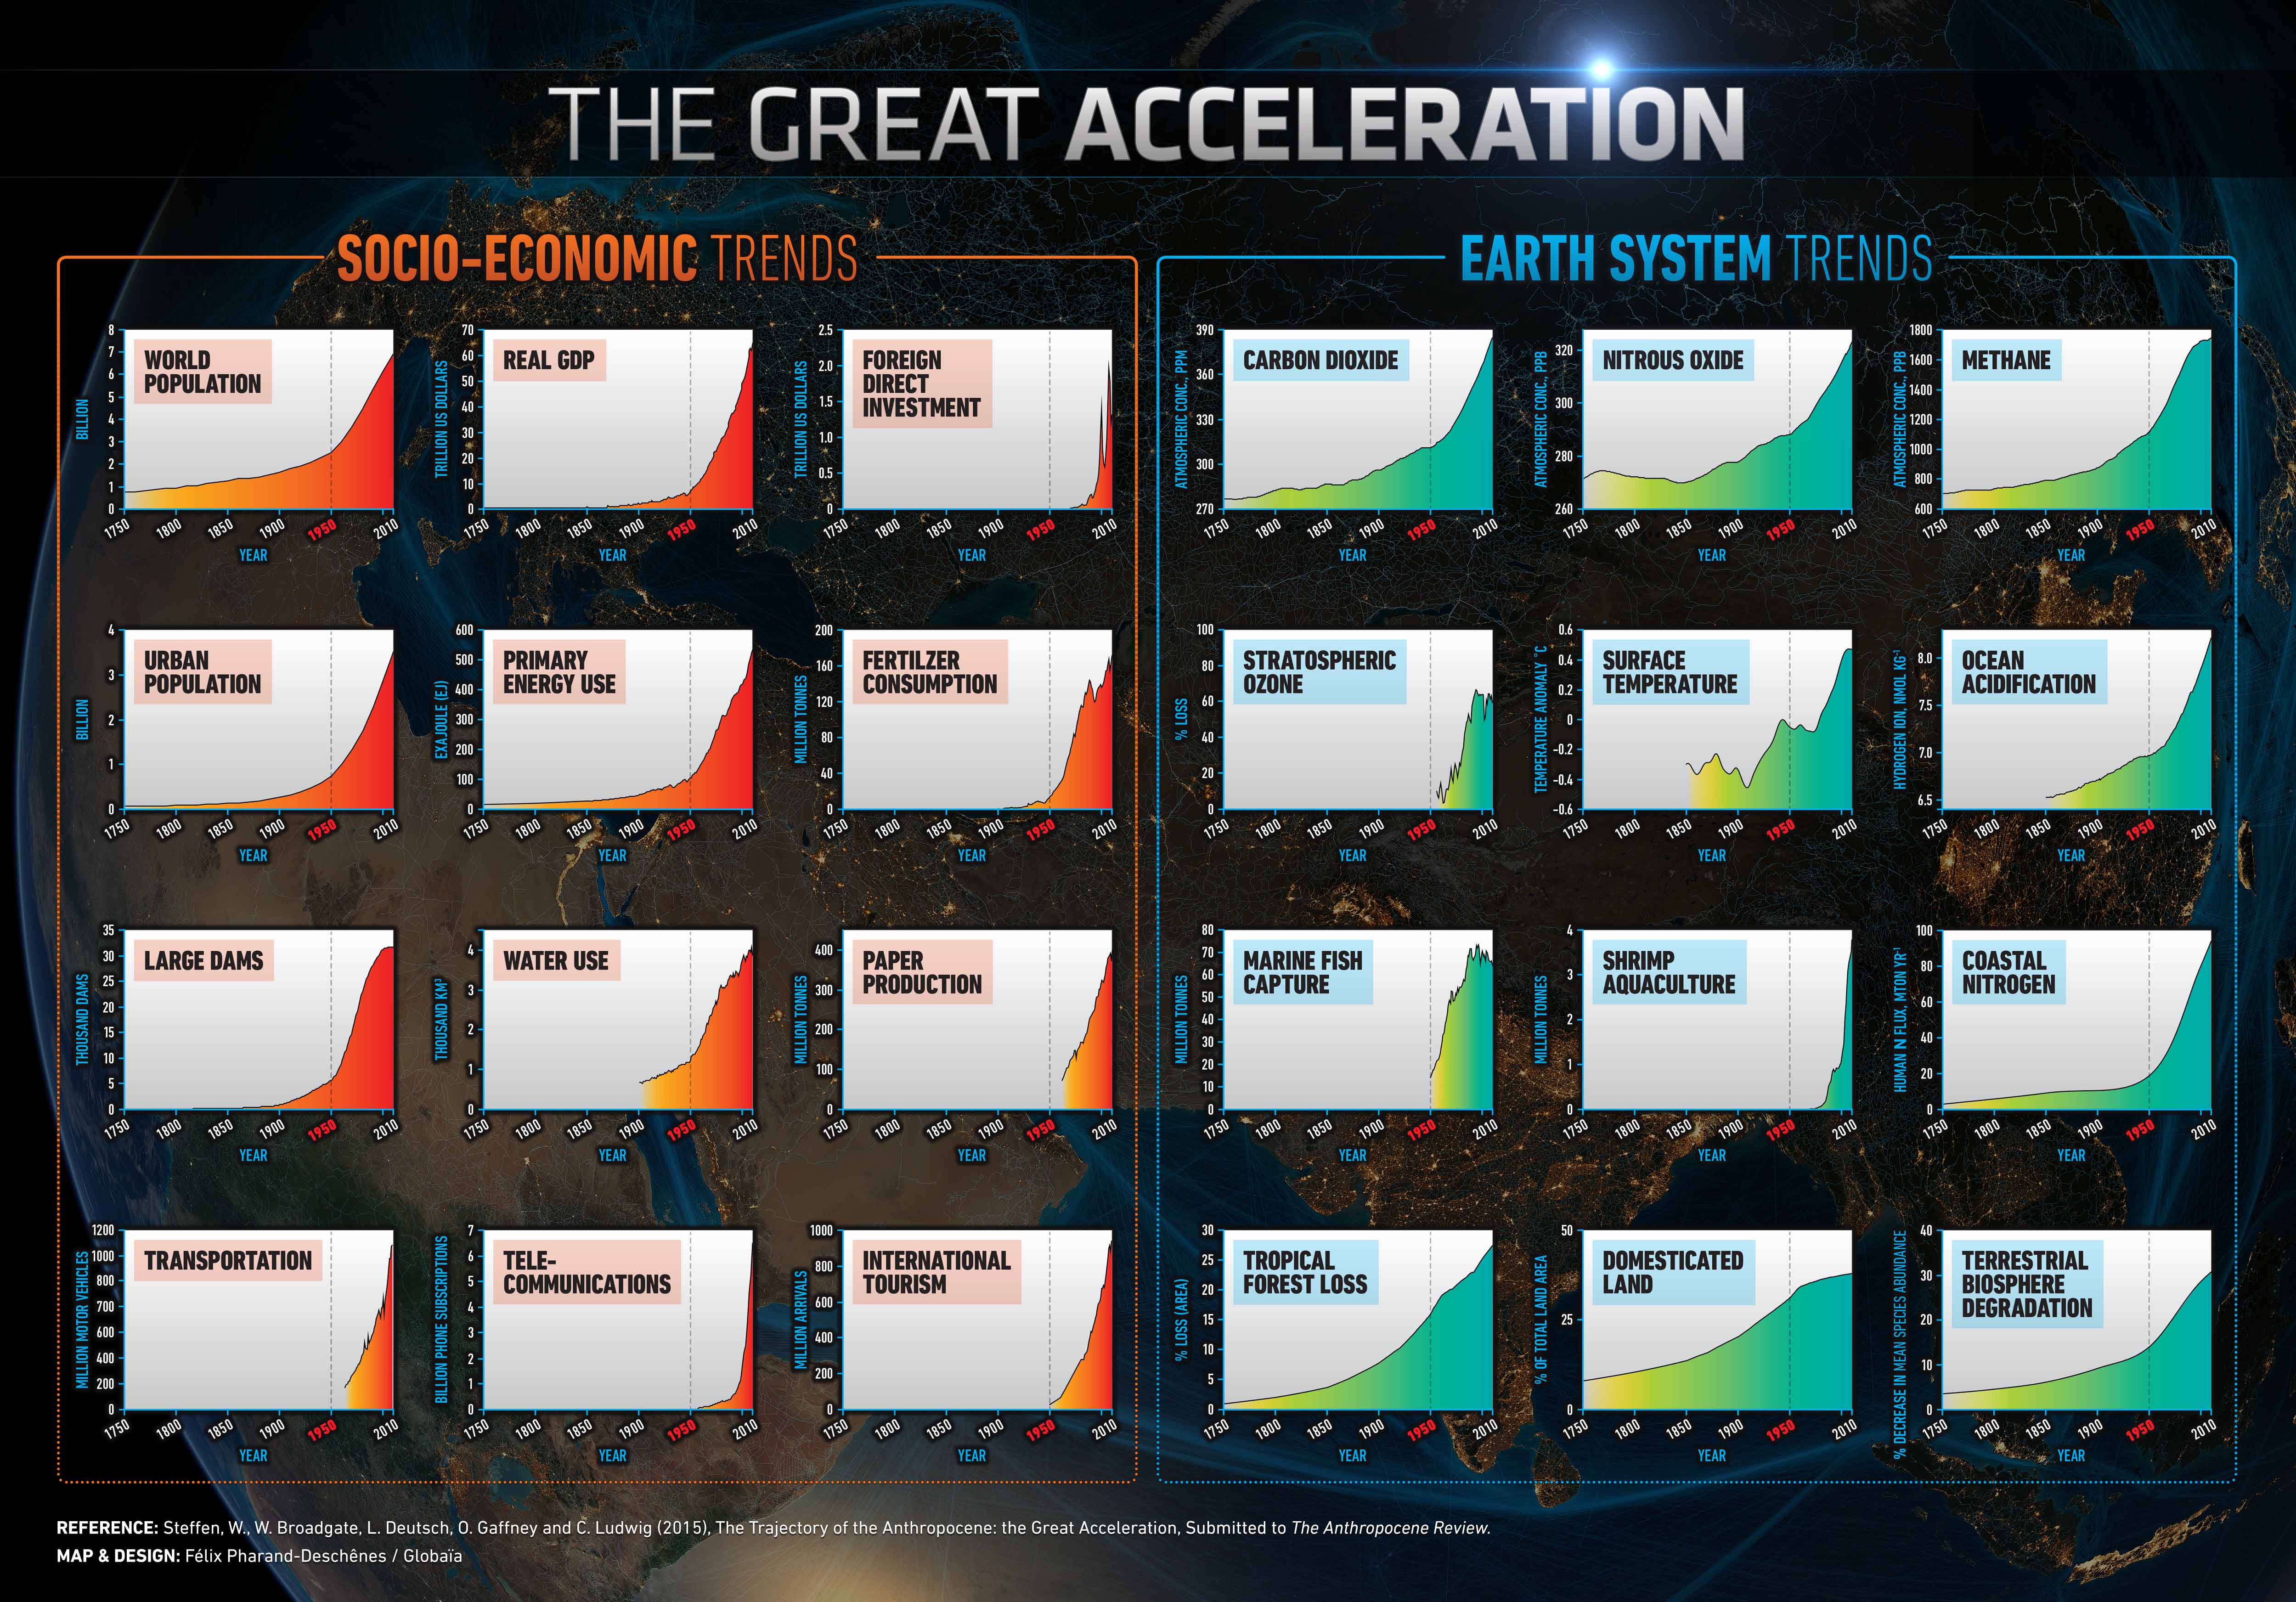
The Great Acceleration
By now you should have a sense that humans are using resources at an unsustainable rate. As we have seen previously, it is important to look at specific metrics when possible. The International Geosphere-Bioshpere Programme (IGBP) did just that when they looked at what they consider key socio-economic and earth system trends. What they found is frequently referred to as the Great Acceleration. (See the full original report here [21], if you are interested.)
Here is how they described what they found (emphasis added in bold): "The second half of the 20th Century is unique in the history of human existence. Many human activities reached take-off points sometime in the 20th Century and sharply accelerated towards the end of the century...The last 60 years have without doubt seen the most profound transformation of the human relationship with the natural world in the history of humankind." (Source: International Geosphere-Biosphere Programme [22])
The charts below provide a stark illustration of the Great Acceleration. Every indicator - world population, real GDP, foreign direct investment, urban population, primary energy use, fertilizer consumption, large dams, water use, paper production, transportation, telecommunications, international tourism, carbon dioxide, nitrous oxide, methane, stratospheric ozone, surface temperature, ocean acidification, marine fish capture, shrimp aquaculture, coastal nitrogen, tropical forest loss, domesticated land, and terrestrial biosphere degradation - took a sharp upward (upward is bad) turn sometime around the mid-20th century. Because of this, some scientists point to the mid-20th century as the beginning of the Anthropocene.
For more detailed information, see IGBP [22]. If you have trouble seeing the image, click on itfor a resizable version. You can also see each one up close in the slideshow below the image.
Check Your Understanding
How important are humans to the Anthropocene? Do they play a large role?
Optional (But Strongly Suggested)
Now that you have completed the content, I suggest going through the Learning Objectives Self-Check list at the top of the page.
Climate Change
Learning Objectives Self-Check
Read through the following statements/questions. You should be able to answer all of these after reading through the content on this page. I suggest writing or typing out your answers, but if nothing else, say them out loud to yourself.
We'll start with climate change for two reasons. First, of all of the specific issues in this lesson, this is the one that potentially has the most devastating impact because of the scale of the problem. If the climate continues to change, the impacts will likely be catastrophic and on a global scale. Second, climate change will likely impact all of the other sectors of sustainability and society, including all of those listed in this section. It is absolutely essential to understand climate change if you want to address sustainability. The following is a short list of facts that indicate why we should be concerned about the human influence on the climate.
First, a few important terms:
- Greenhouse effect: the term used to describe the phenomenon whereby infrared heat warms the lower atmosphere of the earth or another planet due to the gaseous content of the atmosphere.
- Enhanced greenhouse effect: This occurs when the magnitude of the greenhouse effect is enhanced by human activity, due to the emission of greenhouse gases at an unnaturally high level.
- Greenhouse gas: a gas that absorbs infrared radiation and contributes to the greenhouse effect.
- Anthropogenic: caused by humans.
- Anthropogenic climate change: the component of climate change that is believed to be caused by humans.
The following article from the U.S. National Aeronautics and Space Administration (NASA) explains a lot of the basics regarding the terms listed above.
To Read Now
Nota Bene - Climate Change is a Massive Topic
As I hope you know, climate change is a massive, complex topic. This short lesson is meant to provide an overview of some key concepts. We could spend all semester - and dozens of semesters afterward - focusing on the ins and outs of climate change and still have more to analyze. Hopefully, this will provide a good introduction to those of you who are not well-versed and some helpful reminders and deeper information for others.
There are many sources of information about different aspects of problems, solutions, myths, etc. related to climate change, and I encourage you to explore them. A few of my favorites are as follows. Feel free to share your own sources in the Coffee Shop!
- NASA climate change site [28]
- Our World in Data [29] (great visualizations)
- Intergovernmental Panel on Climate Change (IPCC) [30]
- U.S. Environmental Protection Agency [31]
- Climate Central [32]
- Center for Climate and Energy Solutions [33](C2ES)
- Yale Climate Connections [34]
- Skeptical Science [35]
Fact 1: The Greenhouse Effect is Settled Science
The greenhouse effect is a universally accepted natural phenomenon, and carbon dioxide (CO2) is one of the primary greenhouse gases. Without it, life on earth would not be possible. The video below from Stile Education provides a good succinct explanation of the basic physics behind the greenhouse effect.
Watch "What is the greenhouse effect and how does it work?" by Stile Education (3:14 minutes)
The greenhouse effect. When you see a beautiful fat full moon, do you ever imagine what it'd be like to be up there standing on its surface? Well for one thing, hot. About 120 degrees Celsius hot! But 14 days later at new moon you'd be in the middle of the long lunar night and the temperature would have plummeted to around -170 degrees.
On average the moon and earth are the same distance from the sun, so they get the same amount of solar energy. But here the average temperature is 16 degrees Celsius while on the moon it's more like minus 80. The earth has a much smaller range of temperatures too. Minus 88 and plus 57 are the lowest and highest on record. So why the difference? The answer is the atmosphere. It protects us from a lot of the sun's energy but also traps some that gets through so that, for example, at night temperatures don't fall that much. Especially if it's cloudy.
The energy that comes from the sun is electromagnetic radiation in a broad range of wavelengths. The upper atmosphere absorbs most of these wavelengths. Visible light gets through but a third of this reflects straight back out again, mainly of clouds and ice. So only half of the energy heading for earth gets to warm its land and oceans. Rock, soil, and water heated by visible light re-emit the energy as low-energy infrared radiation - heat. This can pass through the oxygen and nitrogen in the air but some gases - the so-called greenhouse gases - carbon dioxide, methane, nitrous oxide, and water vapor - have molecules with structures that make them absorb the radiation. Struck by an infrared wave they vibrate strongly before releasing the energy as a new infrared wave. This can shoot out in any direction - towards space, down to earth, or out sideways. But in every case there's a good chance that the wave will strike another greenhouse gas molecule and change course again.
Although greenhouse gases typically make up less than one percent of the atmosphere, six kilometers deep, not much escaping radiation makes it through without encountering at least one greenhouse gas molecule Over the entire planet the result of this giant pinball game is that heat stays close to the earth's surface for longer than it otherwise would, keeping it warmer this is the greenhouse effect. Without it earth would have an average temperature of minus 18 degrees Celsius. Which is better than the moon but I, think you'll agree not as good as what we've got.
In a nutshell:
- Greenhouse gases (GHGs) allow visible light (shortwave radiation) to pass through them but absorb infrared (longwave radiation) and re-radiate it in all directions after they absorb it. This is simply a physical property of certain gases. Nature just doing its thing.
- Sunlight is mostly shortwave radiation, so passes through the GHGs on its way toward the earth's surface.
- If the shortwave radiation is reflected on or near the earth's surface (e.g., clouds, water, physical objects), it passes back through the GHGs, because it is still shortwave. It goes back out to space.
- If the shortwave radiation is absorbed on or near the earth's surface (e.g, by your skin, water, soil, other surfaces) then it is radiated as longwave radiation. (This is radiant/electromagnetic heat transfer that was mentioned in Lesson 1, by the way!)
- If this longwave radiation hits a GHG molecule on its way out, it is absorbed and re-radiated in all directions.
- Some of that longwave radiation (about 50%) heads back toward the earth's surface. This results in warming that would not occur if the GHGs were not in the atmosphere.
The following gases contribute to the greenhouse effect: water vapor (H2O), carbon dioxide (CO2), methane (CH4), nitrous oxide (N2O), and chlorofluorocarbons (CFCs). There are a lot of details about each, but the main focus of anthropocentric climate change are carbon dioxide and methane, because they play the largest role in the climate impact that most scientists believe humans are having.
Note that methane is considered approximately 30 times as powerful [38] as carbon dioxide in terms of causing increased warming (over a 100-year period). Methane is the primary component of natural gas and is what gives natural gas its energy. If natural gas is burned, it releases about half as much CO2 as if you burn an equivalent amount of coal. But if natural gas leaks or is otherwise emitted, it is about 30 times more potent than carbon dioxide. Despite this, carbon dioxide reduction is the main focus because it is far and away the biggest contributor to anthropogenic greenhouse gas emissions impact.
Good to Know: Why does the sun emit mostly visible light?
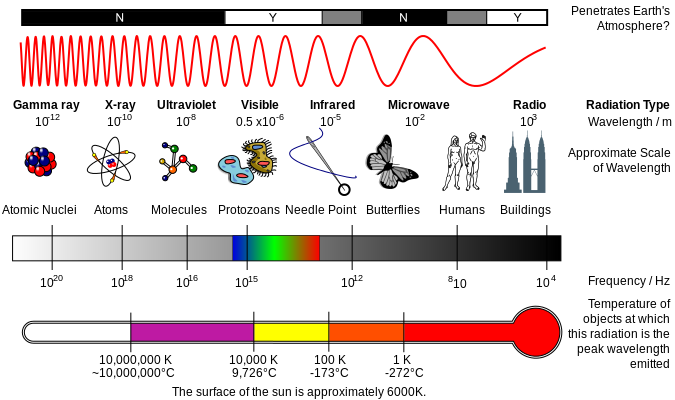
It was mentioned in the video above that the sun emits most of its radiation in the visible spectrum. This is due entirely to its surface temperature. Every object with any temperature above absolute zero emits electromagnetic radiation in a range of wavelengths. (Wavelengths are the distance between the peaks of the electromagnetic waves.) The hotter the temperature, the shorter the wavelengths emitted. See the image below for an illustration of wavelengths. Note that the magnitude of the wavelengths is in meters, e.g. the distance between peaks of visible light is approximately 0.5 x 10⁻⁶ m, or 500 nanometers. (Visible light actually ranges from around 380 nm for violet to around 700 nm for red, according to NASA [39].)
The sun's surface temperature averages between around 5,500 to 6,000 degrees C, which is pretty darn hot. Because it's so hot, the peak radiation is shortwave. More specifically, it peaks in the visible spectrum. The idealized amount of each type of radiation that is emitted by an object can be described using a blackbody radiation curve. Humboldt State University provided a good description [41] of a blackbody radiation curve, now provided on answersmore.com: "The intensity and distribution (and peak) of the radiation depends only on its temperature. The graphical representation of this is commonly known as a Blackbody Radiation Curve. For example, our Sun has an approximate temperature of 5800K and emits peak radiation in the visible portion of the spectrum. The Earth on the other hand is significantly cooler and emits a fraction of the energy and peaks in much longer wavelengths in what's known as the thermal infrared portion of the spectrum."
The image below provides an illustration of the blackbody radiation curve of the sun. Note the peak in the visible portion of the electromagnetic spectrum, but that the sun emits other wavelengths as well. To the left of the visible spectrum (shorter wavelength) is ultraviolet radiation, much of which is absorbed by ozone in the stratosphere. To the right of the visible spectrum on the chart is longwave radiation, much of which is absorbed by greenhouse gases.
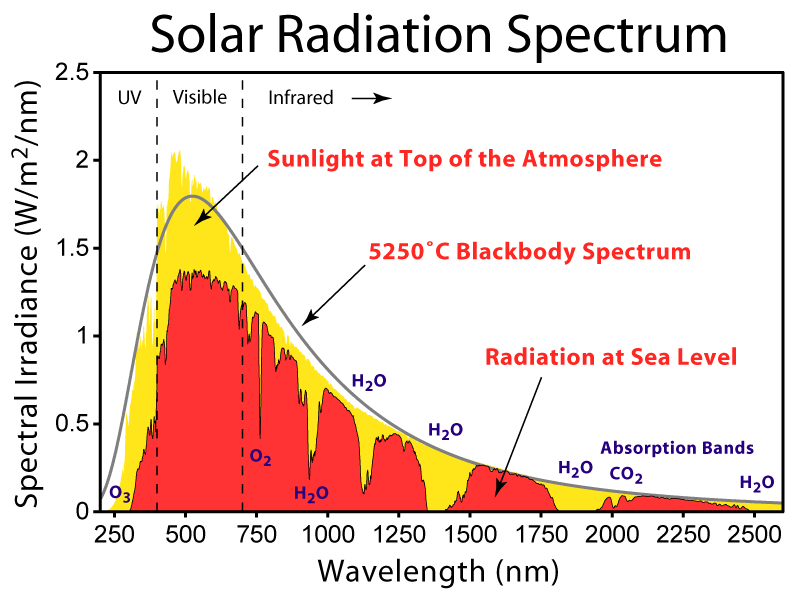
Fact 2: Carbon Dioxide Levels are Increasing Due to Human Activity
There are a few fundamental things to know in regards to the carbon dioxide content of the atmosphere.
- First, the amount of CO2 in the atmosphere is measured in parts per million (ppm). A concentration of 1 ppm means that there is one unit of mass of fluid for every million units of mass of the enveloping fluid. The current concentration of carbon dioxide is a little more than 400 ppm [43]. (FYI, this means that if you took 1 kg of air, there would be about 400/1,000,000 kg, which is 0.0004 kg or 0.4 g of CO2 in that kg of air.)
- Second, when measuring concentration, the atmosphere is considered effectively the same everywhere you go on earth. Localized variations occur, but the current CO2 concentration is considered to be effectively the same no matter where you are on the earth.
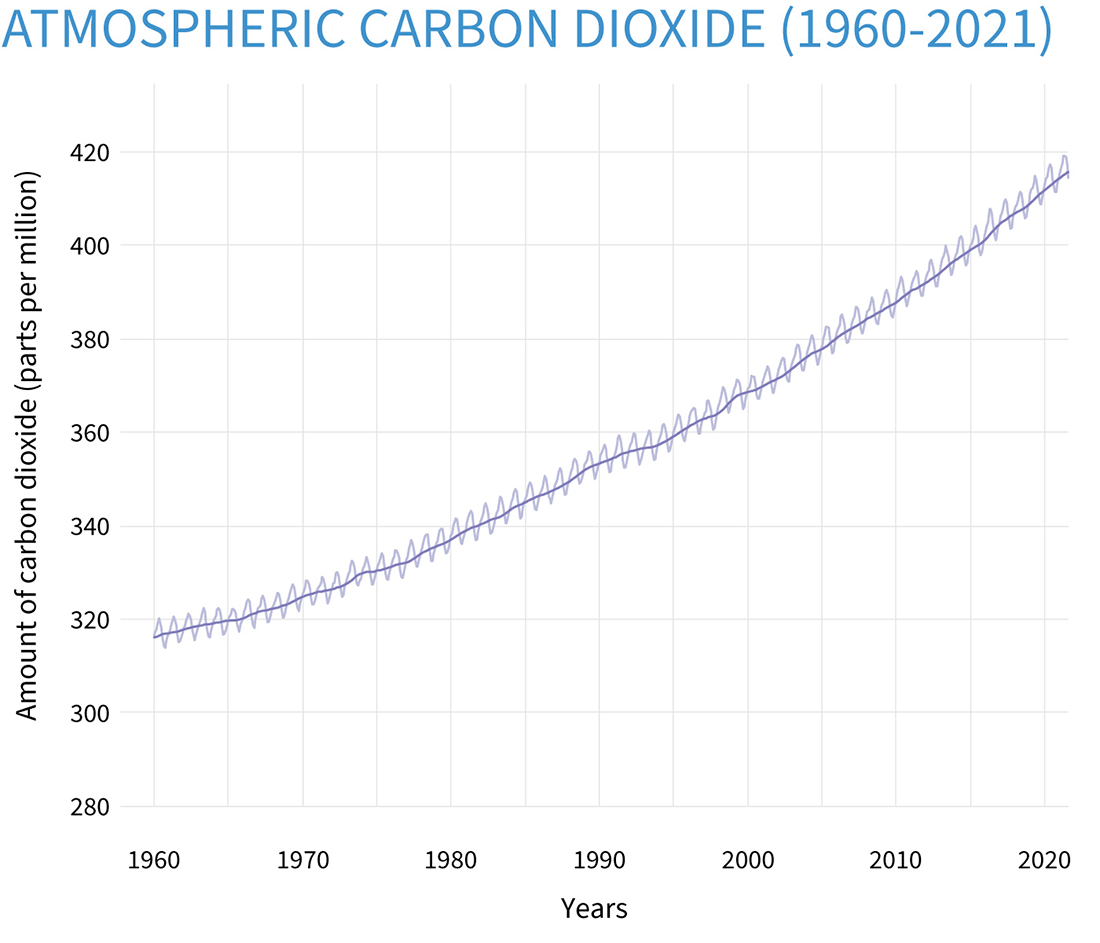
We have been directly measuring the atmospheric concentration of CO2 since 1958 in the Mauna Loa Observatory [44] in Hawaii and have seen it increase steadily since then (see Figure 3.5 below). This is known as the Keeling curve, and is named after Andrew Keeling, who initiated the measurements.
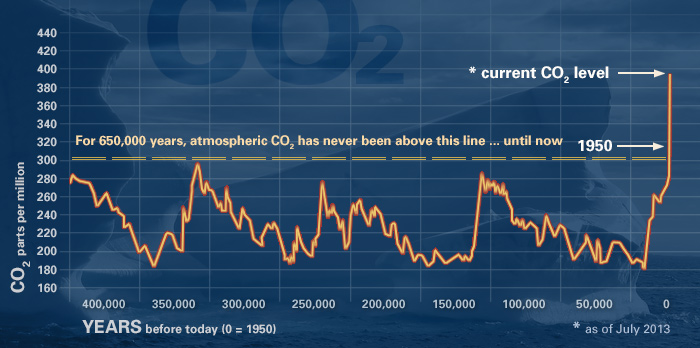
We also know with a very high level of certainty the concentration of the ancient atmosphere through time as well through proxy measures such as ice core samples from ancient ice (click here for some links to explanations of how this is done [46]- click on CO2 Past at the top of the page). The current levels of CO2 are almost certainly unprecedented in the past 800,000 years. The chart below depicts the carbon dioxide levels in the atmosphere for the past 400,000 years.
It is an established fact that the burning of fossil fuels releases carbon dioxide and that the concentration of carbon dioxide has been increasing rapidly since around the beginning of the Industrial Revolution in the late 1700s. The Industrial Revolution is characterized by the increased use of fossil fuels - first coal, then oil, then natural gas. All of these non-renewable energy sources release CO2 when burned, and aside from minor natural occurrences like volcanic eruptions, are what has primarily caused the increased carbon dioxide concentration over the past 200+ years.
In short, energy is the primary culprit in anthropogenic greenhouse gas emissions. In fact, according to the International Energy Agency, two-thirds of global anthropogenic greenhouse gas emissions are due to energy use and production (source: IEA, "Energy and Climate Change [48]," World Energy Outlook 2015). This boils down to the fact that:
- We are emitting carbon dioxide and other greenhouse gases at rates faster than can naturally be absorbed.
This causes an imbalance, and thus the concentration increases. This is one of the fundamental things to understand about sustainability that has been addressed a few times in this course: As noted last lesson, and as Herman Daly stated in regards to the steady state economy, we simply cannot emit wastes faster than they can be naturally reabsorbed.
Mythbusting: The Earth Emits More CO2 Than People Do, So We Don't Make An Impact
You may hear something like the following as a reason to be skeptical of anthropogenic climate change: "The earth naturally emits WAY more CO2 than humans do. The emissions are so relatively small that they cannot have an impact on CO2 concentrations, never mind climate change."
The earth does, in fact, emit significantly more CO2 than humans do! The image below is from the Intergovernmental Panel on Climate Change's (IPCC) most recent report, called the Fifth Assessment Report or simply AR5. This is an illustration of the global carbon cycle. Carbon, like most other elements, is constantly moving around the earth, e.g. being emitted and absorbed by oceans, being taken up by plants, being released by decaying plants, being released by volcanoes, etc. The carbon cycle illustrates this process. (Don't worry about analyzing this image if you don't want to - it's pretty dense, and you do not need to know any of the numbers.)
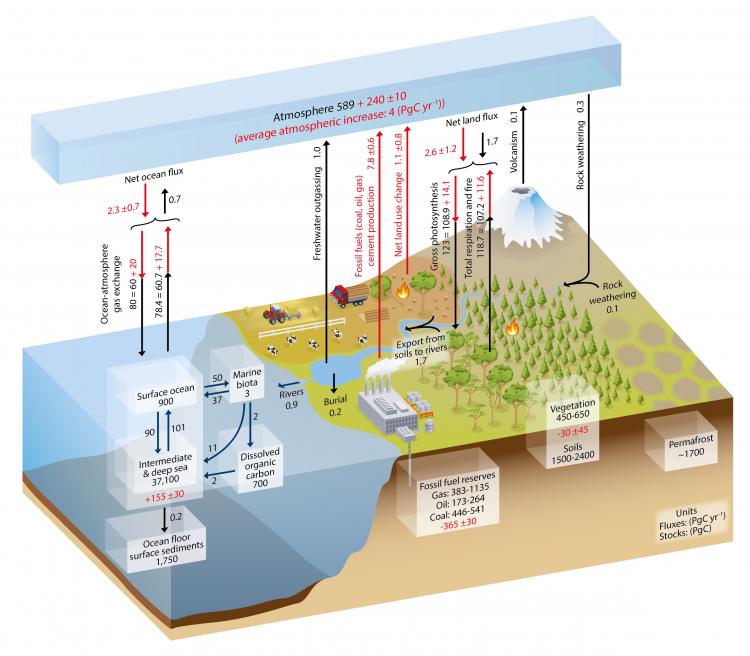
This is a pretty busy image, so I'll summarize it for you:
- Humans directly cause about 9 billion tons (Gt) of carbon to enter the atmosphere each year.
- Natural emissions are on the order of 170 Gt per year.
Hmm, okay, so there are way more natural than anthropogenic emissions. So why care so much about the measly 9 billion anthropogenic ton? As it turns out, if there were no anthropogenic emissions, the carbon cycle would likely even out, or perhaps even cause a reduction in carbon in the atmosphere. There are many natural processes that absorb carbon, mostly oceans, and vegetation. According to the IPCC, the total increase in carbon in the atmosphere is only about 4 Gt per year (including anthropogenic emissions). If you do a little math it becomes apparent: if those 9 Gt of emissions caused by humans were not there, then there would likely be no increase in overall concentration. Even though the relative contribution is small, anthropogenic emissions throw the global carbon cycle out of whack.
One good analogy of this process is weight gain. Let's say you average around 2,000 calories of food intake each day, and on average you burn off the same amount each day. If this continues over time, you will not gain weight. But if you add one extra 100 calorie snack each day, it will throw this balance out of whack. Even though you are only increasing your calorie intake by a measly 5%, over time this will cause weight gain. Well, it appears that the earth has put on some serious carbon weight in the past ~200 years, and it is almost entirely due to the extra human emissions!
Fact 3: The Climate Is Warming
Humans have been taking direct temperature measurements since about 1880. There has been an upward trend in global temperature since around 1900, and the increase has become very sharp since about 1980.

Optional Reading
According to the National Oceanic and Atmospheric Administration (NOAA) (via NASA [53]):
"Nineteen of the warmest years have occurred since 2000, with the exception of 1998. The year 2020 tied with 2016 for the warmest year on record since record-keeping began in 1880"
Based on this evidence (which has been corroborated by other scientific sources) and Figure 3.8 above, it is clear that the global temperature has been increasing since humans have been measuring it on a global scale, and it appears that the warming is accelerating.
One note of caution: The earth operates in cycles of thousands and millions of years, so less than 150 years of warming is not irrefutable evidence that the climate will continue to warm at this rate. However, the correlation that is observed between increased CO2 levels and temperature, along with what we know about GHGs, indicates that we are on a very unsustainable path.
Mythbusting: 2 Degrees of Warming. What's the Big Deal?
There is wide agreement that the Earth's average global temperature has increased about 2 degrees Fahrenheit since the beginning of the 20th century. I am the first to admit that this does not seem like a big deal, but it takes a LOT lof extra heat to increase global temperatures by that much and a few degrees can make a huge difference in the climate system. As NASA states:
Two degrees may sound like a small amount, but it's an unusual event in our planet's recent history. Earth's climate record, preserved in tree rings, ice cores, and coral reefs, shows that the global average temperature is stable over long periods of time. Furthermore, small changes in temperature correspond to enormous changes in the environment.
For example, at the end of the last ice age, when the Northeast United States was covered by more than 3,000 feet of ice, average temperatures were only 5 to 9 degrees cooler than today.
Fact 4: If Climate Change Continues, the Results Will Almost Certainly Be Catastrophic
There is wide consensus that if the climate continues to change and CO2 levels continue to rise, the results will not be good (okay, "not good" is a pretty big understatement). As the Intergovernmental Panel on Climate Change (IPCC) stated in their 2013 report: "Taken as a whole, the range of published evidence indicates that the net damage costs of climate change are likely to be significant and to increase over time" (source: IPCC, quoted by NASA [54]). This is a stuffy way of saying that "things will probably be really bad and continue to get worse."
The link below outlines some of the possible impacts, some of which have already begun to occur. Note that I am not saying that all of these things will happen, even if climate change continues, but it is meant as a survey of some of the most commonly cited negative impacts of climate change. Also note that some of the likely consequences may be positive in some areas, including extended growing seasons in cool climate zones and some increased growth of plants due to extra carbon being available, but the overall impact will very likely be overwhelmingly negative.
Suggested Reading
It is also very important to note that the most vulnerable to these impacts will be low-income and otherwise marginalized people all over the world. As the IPCC states in their 2014 assessment:
"(Climate change) risks are unevenly distributed and are generally greater for disadvantaged people and communities in countries at all levels of development" (IPCC, Climate Change 2014 Syntheses Report [56], p. 13).
Translation: the people with little power and/or resources will be disproportionately affected by climate change, regardless of whether they live in a low- or high-income country. This is thus an important social and environmental justice issue!
Mythbusting: Weather vs. Climate
I wish that I did not have to note this, but it is such a frequent occurrence that I would be remiss if I did not. Okay, here goes: Weather and climate are two different things. Weather refers to short-term variations in ambient atmospheric conditions, mostly day-to-day. It can be hot and sunny one day, and cold and rainy the next. This is weather. Climate refers to long-term trends in atmospheric conditions, which exhibit seasonal trends over the course of decades. (The National Centers for Environmental Information [NEI] from NOAA has some information here [57], if you are interested.) As NEI puts it: "Climate is what you expect. Weather is what you get." In other words, you can expect a certain type of condition based on the season, but the weather can change daily. The tweet below from Donald Trump in January of 2019 is typical of the conflating (on purpose or otherwise) of weather and climate.
In the beautiful Midwest, windchill temperatures are reaching minus 60 degrees, the coldest ever recorded. In coming days, expected to get even colder. People can’t last outside even for minutes. What the hell is going on with Global Warming? Please come back fast, we need you!
— Donald J. Trump (@realDonaldTrump) January 29, 2019 [58]
There are in fact at least two important things wrong about this statement.
- First, this is just weather. 2019 was in the top three hottest years ever recorded [60].
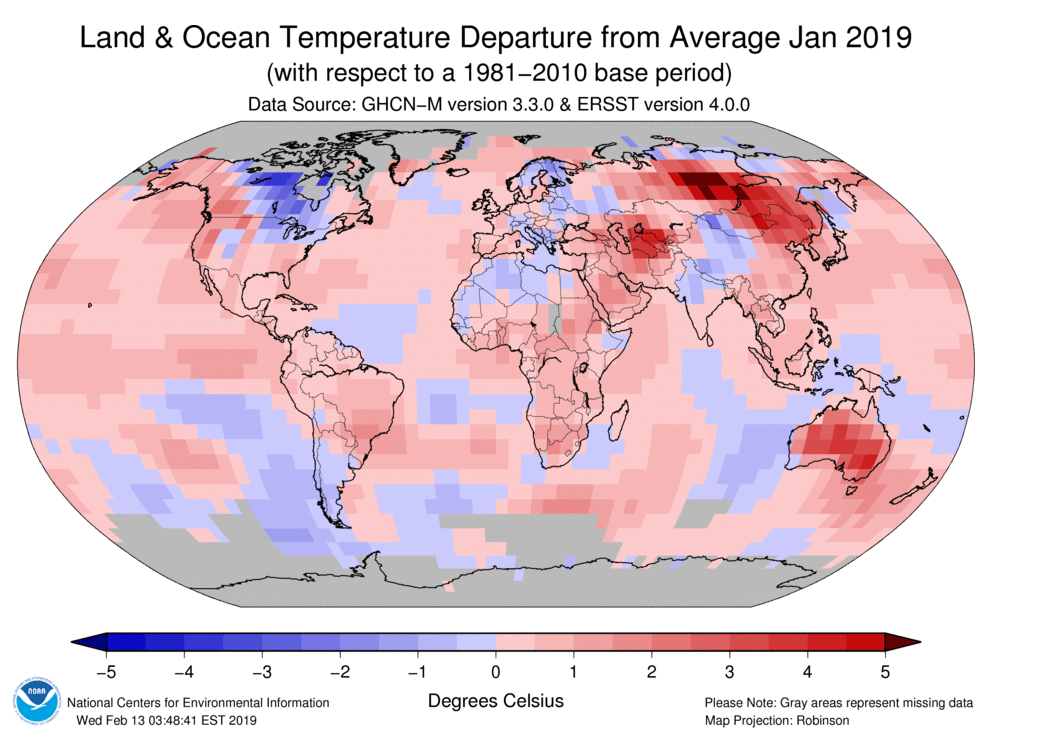
- Second, it is called "global" climate change for a reason. Regional effects are only one small part of the story. It is essential to look at temperatures across the world. The image below from January of 2019 clearly shows that yes, the upper Midwest was colder than normal, but almost the entire rest of the U.S. was warmer than normal, as was most of the world.
Fact 5: There is Broad Scientific Consensus that Humans are the Primary Driver of Observed Climate Change
First of all, it is important to recognize that the climate is a complex system that cannot as of yet be completely modeled. There are gaps in our knowledge, so we do not know with 100% certainty the extent to which our emissions are impacting the climate. But, the evidence has become increasingly clear and compelling.
The Intergovernmental Panel on Climate Change (IPCC) is the most highly regarded climate change research body in the world, as it is made up of over 1,000 of the top climate scientists in the world. Their conclusion in their most recent report [62] in the summer of 2021:
It is unequivocal that human influence has warmed the atmosphere, ocean and land. Widespread and rapid changes in the atmosphere, ocean, cryosphere and biosphere have occurred...Human-induced climate change is already affecting many weather and climate extremes in every region across the globe
In addition, multiple reports in peer-reviewed journals have found that at least 97% of scientists actively publishing in the climate field agree that the climate change observed in the past century is likely due to human influence, i.e., it is anthropogenic. See these links to some studies [63]. In 2015, 24 of Britain's top "Learned Societies" - groups of scientific experts, basically - wrote a letter [64] urging that we need to establish a "zero-carbon world" early in the second half of the 21st century. In the past 15 years, 18 U.S. scientific associations [63] have confirmed that climate change is likely being caused by humans. Big players in the private sector are concerned as well. For example, CEOs from 43 companies in various sectors (with over $1.2 trillion of revenue in 2014) signed an open letter [65] urging action in April of 2015. Even Exxon Mobil states as their official position [66] on climate change (as of the summer of 2018) that:
"We believe that climate change risks warrant action and it’s going to take all of us — business, governments and consumers — to make meaningful progress."
Exxon Mobil, the world's largest publicly traded oil and gas company, is not known to be a friend of carbon reduction advocates. In fact, a study published in August of 2017 [67] found that they systematically misled the public for nearly 40 years about the dangers of climate change, even though they acknowledged the risks internally. Yet even they assert that emissions should be reduced.
Mythbusting: It's China's Fault
(Note: You are welcome to browse and play with the charts below, but please at least read this short explanation.)
You might also hear that China is the world leader in emissions. This is true, and has been since 2006/2007 (see the first chart below). There are at least three important considerations to make with regards to assigning blame for global emissions, though:
- First, CO2 emissions can last for hundreds of years in the atmosphere, so we should consider the cumulative emissions over the past few hundred years. As the second chart below shows, the U.S. has nearly twice the cumulative emissions as China.
- Second, China has about four times the population of the U.S. So all else being equal, China "should" have about four times the emissions. But they don't. This means that their emissions per capita are lower than the U.S. As it turns out, China emits a little more than half the emissions per capita as the U.S.
- Finally, as the charts indicate the data are "based on territorial emissions (production-based) and do not account for emissions embedded in trade." Most of China's emissions are the result of producing goods for other countries, so the accounting methods are not entirely fair.
Putting it All Together
Let's consider these facts together:
- We know that the greenhouse effect warms the planet and that carbon dioxide is a greenhouse gas.
- We know that humans are emitting greenhouse gases at a rate that is increasing their concentration in the atmosphere.
- We know that the global climate is warming.
These three facts alone indicate that there is likely a problem. But, on top of this, you add that:
- The vast majority of active climate scientists agree that climate change is a problem and that observed climate change is anthropogenic. So, the people that we trust to understand the climate widely agree that it is a problem.
- Finally, if climate change is happening, then the results will likely be devastating and on a global scale.
We know that humans are impacting the climate. Do we know the exact extent to which we are? The short answer is "no." The longer answer is that we are almost certain that humans are the primary cause of the warming that has occurred and that it is worth taking the precaution to prevent the worst of climate change just in case. Yes, it is possible that so many climate experts are wrong about the severity of the human impact on the climate - it is a rare occurrence that so many experts are wrong, but there is a possibility, however miniscule. And yes, there will be costs associated with making the change to a low-carbon society. But why do people buy life insurance? What about fire insurance? As silly as it sounds, what about buying an extended warranty on a new piece of electronics, or extra insurance for a rental car? The point is that even though the likelihood of using those insurances is minimal, people are willing to pay the cost in order to avoid catastrophe. The same could be said of climate change. Taking steps to avoid the worst-case scenario, or perhaps something near the worst-case scenario, is known as the precautionary principle. This may cost money or other resources in the short term, but is seen as worth it because of the situation it may prevent.
One quick addendum to this: If steps are successfully taken to reduce climate emissions to a sustainable level, it is very likely that there will also be cleaner air, less environmental damage, more energy security (not being dependent on another country for energy), and probably more active/healthy citizens. Something to think about.
Good to Know - Wicked Problems
Climate change is a very complicated, multifaceted, and unique problem that overlaps a multitude of sectors and has no capital "S" Solution. This, among other things, makes it a so-called "wicked problem." Stony Brook University [70] provides an excellent synopsis of wicked problems. (Feel free to read more about them here [70].)
- They do not have a definitive formulation.
- They do not have a 'stopping rule.' In other words, these problems lack an inherent logic that signals when they are solved.
- Their solutions are not true or false, only good or bad.
- There is no way to test the solution to a wicked problem.
- They cannot be studied through trial and error.
- Their solutions are irreversible so, as Rittel and Webber put it, 'every trial counts.'
- There is no end to the number of solutions or approaches to a wicked problem.
- All wicked problems are essentially unique.
- Wicked problems can always be described as the symptom of other problems.
- The way a wicked problem is described determines its possible solutions.
- Planners, that is those who present solutions to these problems, have no right to be wrong. Unlike mathematicians, 'planners are liable for the consequences of the solutions they generate; the effects can matter a great deal to the people who are touched by those actions.'
Check Your Understanding
Further Reading - OPTIONAL
If you are interested in reading more about this topic, here are some suggested readings.
- "Climate Change 2021: The Physical Science Basis, Summary for Policymakers [62]." Intergovernmental Panel on Climate Change.
- U.S. Environmental Protection Agency's Climate Change Website [71]
- Link to a number of IPCC documents [72].
Optional (But Strongly Suggested)
Now that you have completed the content, I suggest going through the Learning Objectives Self-Check list at the top of the page.
Water
Learning Objectives Self-Check
Read through the following statements/questions. You should be able to answer all of these after reading through the content on this page. I suggest writing or typing out your answers, but if nothing else, say them out loud to yourself.
Quick Quiz
It is a widely known fact that people can survive much longer without food than without water. Under optimal conditions, humans can go around a week, maybe a bit more, without water [76], whereas it is possible to go more than a month without eating food [77]. But when water sustainability is being discussed, it is rare that death from lack of drinking water is the concern. A more likely cause of death (or, otherwise, a reduction in quality of life) is lack of clean water, and the water-borne diseases like diarrhea and cholera that result. Lack of access to water will likely be a very important problem in the future, though it also poses a threat right now.
Suggested Reading
The World Health Organization (WHO) [78] was established by the United Nations (UN) in 1948. Its goal is "to build a better, healthier future for people all over the world" and its "staff work side by side with governments and other partners to ensure the highest attainable level of health for all people" (source: World Health Organization [79]). They perform and fund research, write reports, establish international health recommendations/standards, provide aid throughout the world, and publish a LOT of data. They are a great source for information regarding international health (and sickness/disease).
- You are welcome to read the entire article, or you can just click below to read the key passages:"Drinking-water [80]" by the World Health Organization.
Key facts
Over 2 billion people live in water-stressed countries, which is expected to be exacerbated in some regions as result of climate change and population growth.
Globally, at least 1.7 billion people use a drinking water source contaminated with faeces. Microbial contamination of drinking-water as a result of contamination with faeces poses the greatest risk to drinking-water safety.
Safe and sufficient water facilitates the practice of hygiene, which is a key measure to prevent not only diarrhoeal diseases, but acute respiratory infections and numerous neglected tropical diseases.
Microbiologically contaminated drinking water can transmit diseases such as diarrhoea, cholera, dysentery, typhoid and polio and is estimated to cause 505 000 diarrhoeal deaths each year.
In 2022, 73% of the global population (6 billion people) used a safely managed drinking-water service – that is, one located on premises, available when needed, and free from contamination.
Overview
Safe and readily available water is important for public health, whether it is used for drinking, domestic use, food production or recreational purposes. Improved water supply and sanitation, and better management of water resources, can boost countries’ economic growth and can contribute greatly to poverty reduction.
In 2010, the UN General Assembly explicitly recognized the human right to water and sanitation. Everyone has the right to sufficient, continuous, safe, acceptable, physically accessible and affordable water for personal and domestic use.
Water and health
Contaminated water and poor sanitation are linked to transmission of diseases such as cholera, diarrhea, dysentery, hepatitis A, typhoid, and polio. Absent, inadequate, or inappropriately managed water and sanitation services expose individuals to preventable health risks...
Inadequate management of urban, industrial, and agricultural wastewater means the drinking-water of hundreds of millions of people is dangerously contaminated or chemically polluted...
Some 1 million people are estimated to die each year from diarrhoea as a result of unsafe drinking-water, sanitation and hand hygiene. Yet diarrhoea is largely preventable, and the deaths of 395 000 children aged under 5 years could be avoided each year if these risk factors were addressed. Where water is not readily available, people may decide handwashing is not a priority, thereby adding to the likelihood of diarrhoea and other diseases.
Diarrhoea is the most widely known disease linked to contaminated food and water but there are other hazards. In 2021, over 251.4 million people required preventative treatment for schistosomiasis – an acute and chronic disease caused by parasitic worms contracted through exposure to infested water.
In many parts of the world, insects that live or breed in water carry and transmit diseases such as dengue fever. Some of these insects, known as vectors, breed in clean, rather than dirty water, and household drinking water containers can serve as breeding grounds. The simple intervention of covering water storage containers can reduce vector breeding and may also reduce faecal contamination of water at the household level.
Economic and social effects
When water comes from improved and more accessible sources, people spend less time and effort physically collecting it, meaning they can be productive in other ways. This can also result in greater personal safety and reducing musculoskeletal disorders by reducing the need to make long or risky journeys to collect and carry water. Better water sources also mean less expenditure on health, as people are less likely to fall ill and incur medical costs and are better able to remain economically productive.
With children particularly at risk from water-related diseases, access to improved sources of water can result in better health, and therefore better school attendance, with positive longer-term consequences for their lives.
Challenges
Historical rates of progress would need to double for the world to achieve universal coverage with basic drinking water services by 2030. To achieve universal safely managed services will require a 6-fold increase. Climate change, increasing water scarcity, population growth, demographic changes and urbanization already pose challenges for water supply systems...
The World Economic Forum (WEF) [81] is a non-profit headquartered in Switzerland whose members are a who's who of the global economically elite corporations. The WEF is best-known for its annual meeting in Davos, Switzerland, which is frequently attended by world leaders, including the U.S. president. The WEF is often critiqued for not doing enough about income inequality and other issues facing the world's impoverished, but they do provide a lot of information that reflects the perspective of many of the world's economic leaders. This includes their annual Global Risks Report, which ranks what it sees as the top global risks in the next 10 years. Water figured prominently in the 2016 Global Risks Report. (The 2023 report [82] focused more on a variety of environmental problems, including cllimate change, biodiversity loss and ecosystem collapse, and lumps water into "natural resource crises.")
You are welcome to read the entire press release [83], but here is the content most relevant to this lesson:
An increased likelihood for all risks, from the environmental to society, the economy, geopolitics and technology, looks set to shape the global agenda in the coming year, the World Economic Forum’s Global Risks Report 2016 has found.
...The risk with the greatest potential impact in 2016 was found to be a failure of climate change mitigation and adaptation. This is the first time since the report was published in 2006 that an environmental risk has topped the ranking. This year, it was considered to have greater potential damage than weapons of mass destruction (2nd),& water crises (3rd), large-scale involuntary migration (4th) and severe energy price shock (5th).
The number one risk in 2016 in terms of likelihood, meanwhile, is large-scale involuntary migration, followed by extreme weather events (2nd), failure of climate change mitigation and adaptation(3rd), interstate conflict with regional consequences (4th) and major natural catastrophes(5th).
Such a broad risk landscape is unprecedented in the 11 years the report has been measuring global risks. For the first time, four out of five categories – environmental, geopolitical, societal and economic – feature among the top five most impactful risks. The only category not to feature is technological risk, where the highest ranking risk is cyberattack, in 11th position in both likelihood and impact.
The following is some of the more important (and startling) information from the readings above:
- Globally, at least 1.7 billion people use a drinking water source contaminated with feces
- Contaminated water and poor sanitation are linked to transmission of diseases such as cholera, diarrhea, dysentery, hepatitis A, typhoid, and polio.
- Some 1 million people are estimated to die each year from diarrhea as a result of unsafe drinking-water, sanitation, and hand hygiene. Yet diarrhea is largely preventable, and the deaths of 395,000 children aged under 5 years could be avoided each year if these risk factors were addressed.
- Where water is not readily available, people may decide handwashing is not a priority, thereby adding to the likelihood of diarrhea and other diseases.
- Climate change, increasing water scarcity, population growth, demographic changes and urbanization already pose challenges for water supply systems. Over 2 billion people live in water-stressed countries.
While this paints a bleak picture, some progress has been made in the global fight for access to clean water, as evidenced by the fact that the UN's Millennium Development Goal (MDG) on drinking water has been met. The MDG was to "halve the proportion of the world's population without sustainable access to safe water." This goal was met in 2010. However, the article indicates that while the broad goal was met (global percentage), none of the 48 "least developed" countries met the goal.
As usual, there is a deficiency in terms of equity with regards to access to clean water, with "low-income, informal or illegal" populations "usually having less access to improved sources of drinking-water than other residents." The consequences are dire, as around 1 million people are estimated to die each year from diarrhea alone, including nearly 400,000 children under the age of 5. And over a quarter of a billion people had to be treated for schistosomiasis, which is a painful chronic disease also caused by water contamination. The worst part is that this is mostly preventable!
These and other factors combine to make access to water an essential part of quality of life. The United Nations has declared access to water and sanitation a human right and thus should be provided to all people equitably. The UN realizes that access is a fundamental component of the ability to live one's life and further that "clean drinking water and sanitation are essential to the realization of all human rights" (Source: United Nations [84]).
All of this is reflected in the World Economic Forum's (WEF) Global Risk Report 2016, which ranked water as the third highest global risk in terms of "impact." (The 2019 report lists it as number 4 in terms of impact.) Note that the WEF did not rank water crisis on a large scale as highly likely relative to other things, including extreme weather, but that if it does occur, it will be very impactful. This speaks to the importance of access to water.
Good to Know - Sustainable Development Goals
The United Nations declared its Millennium Development Goals in 2000. They focused on 8 themes, each with many practical steps listed as ways to achieve the goals:
- Eradicate extreme poverty and hunger
- Achieve universal primary education
- Promote gender equality and empower women
- Reduce child mortality
- Improve maternal health
- Combat HIV/AIDS, Malaria, and other diseases
- Ensure environmental sustainability
- Develop a global partnership for development
Actions were to be taken for a period of 15 years and assessed every year along the way. This period concluded in 2014, and in 2015 the UN published the final report assessing the progress toward the goals. You can view The Millennium Development Goals Report [85]. This is optional reading but will give you a very good feel for a lot of the development activities undertaken by the UN.
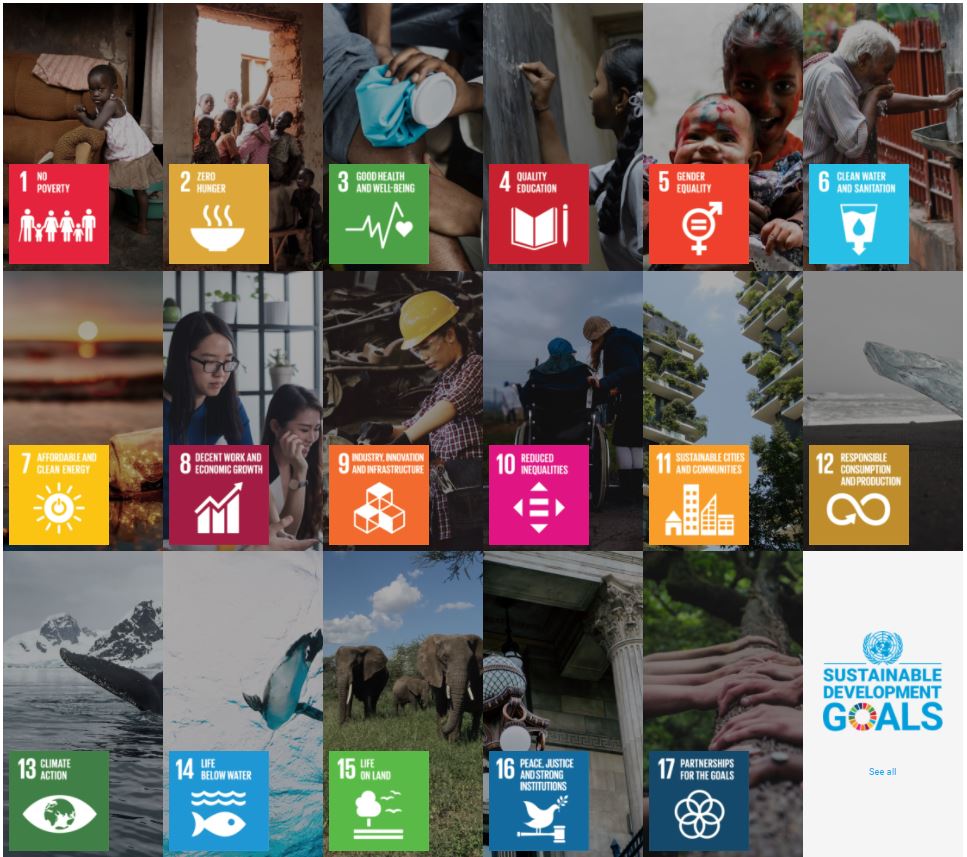
These have been replaced by the Sustainable Development Goals [86]. These were adopted by the UN in 2015 as part of the 2030 Agenda for Sustainable Development [87]. According to the UN, this agenda "provides a shared blueprint for peace and prosperity for people and the planet, now and into the future. At its heart are the 17 Sustainable Development Goals (SDGs), which are an urgent call for action by all countries - developed and developing - in a global partnership. They recognize that ending poverty and other deprivations must go hand-in-hand with strategies that improve health and education, reduce inequality, and spur economic growth – all while tackling climate change and working to preserve our oceans and forests."
The SDGs are quite well known, and many public and private entities (and educational institutions) are using them to provide a framework for applying sustainability. The 17 Sustainable Development Goals are as follows. You will probably note that almost all of these are addressed to some extent in this course!
- No Poverty
- Zero Hunger
- Good Health and Well-Being
- Quality Education
- Gender Equality
- Clean Water and Sanitation
- Affordable and Clean Energy
- Decent Work and Economic Strength
- Industry, Innovation, and Infrastructure
- Reduced Inequalities
- Sustainable Cities and Communities
- Responsible Consumption and Production
- Climate Action
- Life Below Water
- Life on Land
- Peace, Justice, and Strong Institutions
- Partnerships for the Goals
 [86]
[86]
Water Scarcity and Sectoral Use
The Food and Agriculture Organization of the United Nations (FAO) [88] indicates that its goal is to "achieve food security for all and make sure that people have regular access to enough high-quality food to lead active, healthy lives" (Source: FAO [89]). They are widely regarded as a leading international organization in the movement to alleviate malnutrition and food poverty across the world, particularly in impoverished areas of the world. In the video below (viewing is optional), they provide an introduction to the concepts of physical water scarcity and economic water scarcity and provide some data about these two phenomena.
- Physical water scarcity "occurs when the demand for water...is higher than the available resource." This is pretty straightforward: this occurs when an area needs more water than it has. This usually occurs in dry areas of the world, including wealthier ones like the southwestern U.S.
- Economic water scarcity "occurs when human, institutional and financial capital limit access to water even though water in nature is available for human needs." In other words, the water is there and is accessible, but the people are not capable of getting to it. This tends to happen in lower income countries of the world, and areas with social and/or political instability.
Source: FAO [90]
Suggested Viewing
The following video from FAO has no audio narration, so there is nothing wrong with your speakers/headphones! Note that the data provided are a few years old, but have not changed much. It is important to point out that despite what is indicated in the video below, reducing domestic water use is not the most effective way to reduce total water use. As you will see in the video below, much more water is used as a result of farming and industrial uses worldwide.
Watch Water Scarcity by FAO Water (3:26 minutes).
It says: Water scarcity occurs when the demand for water from all sectors (agriculture, cities, environment, etc.) is higher than the available resource. Because water has been relatively abundant throughout our existence on earth, we have come to take it for granted. However, we now find our water supplies severely reduced as water scarcity is fast becoming one of the most serious resource issues we face today. The amount of water on our planet is fixed, but very little of it is available for us to use with about 2.5 percent of all water on earth being fresh water and 68.9 percent of the fresh water is locked in glaciers, 30.8 percent in groundwater, and 0.3 percent in lakes and rivers.
Currently, one third of the world population lives in countries where there isn't enough water or its quality has been compromised. By 2025 this number is expected to rise to two-thirds.
There are two types of water scarcity. One is known as Physical Water Scarcity. This occurs when there is not enough water to meet our needs. Arid regions are generally associated with physical water scarcity. Physical water scarcity occurs in: the western United States, Northern Africa, Saudi Arabia, Eastern Australia, and areas of India and northern China. More areas are rapidly approaching physical water scarcity. Africa, Asia and the Pacific, and the Near East use over 75 percent of their water for agriculture. The other type of water scarcity is known as Economic Water Scarcity. This occurs when human, institutional and financial capital limit access to water even though water in nature is available for human needs. Economic water scarcity occurs in central and northern South America, Middle Africa, and in and around India. Poor households in developing countries spend higher portions of their income on water than families in industrialized nations.
You may think water issues are somebody else's problem. But in a few years, it will be yours too. Follow a few easy steps to do your part in maintaining this precious resource. Don't throw your cooking oil down the drain. Close the tap when brushing your teeth. Don't buy unnecessary goods, as everything produced uses water.
Suggested Reading
You are welcome to read from the beginning through the "Water stress versus water scarcity" section on the United Nation's "International Decade for Action 'WATER FOR LIFE' 2005 - 2015 [93]," but that is not necessary. The key passages are summarized below. The full document provides a snapshot of water scarcity worldwide. This was the final report published by the UN after their decade-long focus [94] on international water issues. I have highlighted some key elements in bold.
Water scarcity already affects every continent. Around 1.2 billion people, or almost one-fifth of the world's population, live in areas of physical scarcity, and 500 million people are approaching this situation. Another 1.6 billion people, or almost one quarter of the world's population, face economic water shortage (where countries lack the necessary infrastructure to take water from rivers and aquifers).
Water scarcity is among the main problems to be faced by many societies and the World in the XXIst century. Water use has been growing at more than twice the rate of population increase in the last century, and, although there is no global water scarcity as such, an increasing number of regions are chronically short of water.
Water scarcity is both a natural and a human-made phenomenon. There is enough freshwater on the planet for seven billion people but it is distributed unevenly and too much of it is wasted, polluted and unsustainably managed...
- Around 700 million people in 43 countries suffer today from water scarcity.
- By 2025, 1.8 billion people will be living in countries or regions with absolute water scarcity, and two-thirds of the world's population could be living under water stressed conditions.
- With the existing climate change scenario, almost half the world's population will be living in areas of high water stress by 2030, including between 75 million and 250 million people in Africa. In addition, water scarcity in some arid and semi-arid places will displace between 24 million and 700 million people.
- Sub-Saharan Africa has the largest number of water-stressed countries of any region
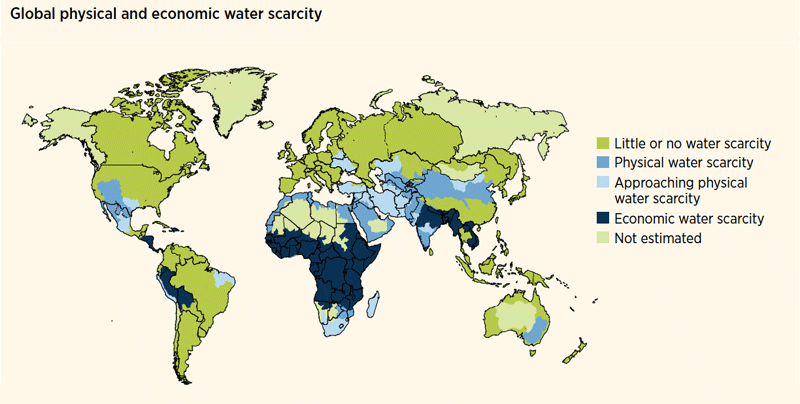
- Economic water scarcity: Sub-Saharan Africa, parts of Northwestern South America, Northern India an some of Southeast Asia
- Physical water scarcity: Northern China, parts of the Middle East, Southeastern Australia, Southwest U.S.
- Approaching physical water scarcity: Central Mexico and parts of Texas, South Africa, most of the Middle East, Some in Northern China.
- Little or no water scarcity: Most of the rest of the world, except for Alaska, Greenland, Siberian Russia, and Central Australia, which had no data.
The main takeaways from this video and article are:
- Economic water scarcity is when there is enough water in an area, but people don't have access to an adequate amount due to economic, political, or technological reasons
- Physical water scarcity is when there is not physically enough water to satisfy the needs of the people
- Arid areas being most prone to physical scarcity and those with social and/or political unrest most subject to economic scarcity;
- On a global scale, water scarcity is more of a distribution problem than a physical problem, according to the UN ("There is enough freshwater on the planet for seven billion people [93] but it is distributed unevenly and too much of it is wasted, polluted and unsustainably managed.");
- Water scarcity impacts areas all over the world, including in some relatively wealthy countries.
- It is important to note that despite recent progress, the total number of people subject to scarcity or stress is likely to increase as population and water demand increase, and as the climate continues to change.
Quick Quiz
Suggested Viewing
The TED Talk below provides some great insight into the causes and effects of, and some solutions for, water scarcity. It also dispels some common misconceptions about the best ways to address this issue.
Watch Fresh water scarcity: An introduction to the problem (3:39 minutes)
You might have heard that we're running out of fresh water. This might sound strange to you because, if you live in a place where water flows freely from the tap or shower at any time, it sure doesn't seem like a big deal.
It's just there, right?
Wrong!
The only obvious thing about fresh water is how much we need it. Because it's essential to life, we need to think about it carefully. Right now, at this very moment, some people, women and girls in particular, walk hours and miles per day to get fresh water, and even then, it may not be clean. Every 15 seconds, a child dies due to water-born diseases.
This is tragic!
The most compelling reasons to think about fresh water, therefore, have to do with what we might call the global common good. This is not something we normally think about, but it means recognizing how much fresh water matters for the flourishing of human and non-human life on Earth now and in the future.
How do we think about something as local as our faucets and as global as fresh water? Is there a connection between them?
Many people assume that fresh water shortages are due to individual wastefulness: running the water while you brush your teeth, for example, or taking really long showers. Most of us assume, therefore, that water shortages can be fixed by improving our personal habits: taking shorter showers or turning off the water while we brush our teeth. But, global fresh water scarcity neither starts nor ends in your shower. Globally, domestic use of fresh water accounts for only 8% of consumption, 8%!! Compare that to the 70% that goes to agriculture and the 22% that goes to industrial uses.
Now, hold up - you're not off the hook!
Individual habits are still part of the puzzle. You should still cultivate water virtue in your daily life, turn off the tap when you brush your teeth. But still, it's true. Taking shorter showers won't solve global problems, which is too bad. It would be much more straightforward and easier if virtuous, individual actions could do the trick. You'd just stand there for 30 seconds less, and you'd be done with that irksome, planet-saving task for the day.
Well, that's not so much the case.
Agricultural and industrial patterns of water use need serious attention. How do our societies value water? Distribute it? Subsidize its use in agriculture? Incentivize its consumption or pollution?
These are all questions that stem from how we think about fresh water's value. Is it an economic commodity? A human right? A public good? Nobel prize winners, global water justice activists, transnational institutions like the United Nations, and even the Catholic Church are at work on the issue. But, it's tricky, too, because the business of water became very profitable in the 20th century. And profit is not the same thing as the common good. We need to figure out how to value fresh water as a public good, something that's vital for human and non-human life, now and in the future.
Now that's a virtuous, collective task that goes far beyond your shower.
Though this TED-Ed talk was produced in 2013, the same issues exist today. As the narrator indicates, only about 8% of global fresh water consumption is from domestic uses (showering, teeth brushing, cooking, etc.) Most - about 70% (!) - is used for agriculture, and over 20% is used for industrial purposes (e.g. manufacturing, energy generation). This is very similar to the U.S. water use profile, as you will see in a second.
The United States Geological Survey (USGS) [97] is charged with compiling the U.S.'s water use data. The most recent report is from 2015, which was released in June of 2018. Feel free to tool around with the data here [98], and go here for an interesting visualization of water use by category and state [99].
The chart below shows the percent of consumption different sectors of use are responsible for. As noted above, very little is used domestically and in the public supply (around 13% combined). (Note that irrigating lawns and watering gardens at home counts as domestic use, not irrigation.) You may be surprised by some of this, in particular that thermoelectric cooling is the single biggest user of total water in the U.S. (Keep in mind that about 50 billion gallons of salt water are used for thermoelectric power, so irrigation is the biggest single freshwater user in the U.S.). Thermoelectric cooling just refers to cooling towers. Have you ever noticed that power plants are always located near a body of water? That is because the electricity generation process generates a LOT of waste heat. (Recall that power plants are generally 30% - 40% efficient, and so waste a lot of heat). Without constant cooling by a local water source, the plants would overheat.

| Category | 2015 WithdrawAls in Million Gallons per Day |
|---|---|
| Public Supply | 39,000 |
| Self-Supplied Domestic | 3,260 |
| Irrigation | 118,000 |
| Livestock | 2,000 |
| Aquaculture | 7,550 |
| Self-supplied Industrial | 14,800 |
| Mining | 4,000 |
| Thermoelectric Power | 133,000 |
Note: Values do not sum to 322,000 Mgal/d because of independent rounding.
- Total withdrawals were 322,000 million gallons per day (355 billion gallons per day).
- Thermoelectric power, irrigation, and public supply account for 90 percent of total withdrawals.
- Withdrawals declined since 2010 in all categories except irrigation.
- Freshwater withdrawals were about 88% of the total.
- Surface water supplied 78 % of all withdrawals
Suggested Reading
- "Summary of Estimated Water Use in the United States in 2015 [100]." USGS.
It is important to keep in mind that it's not as easy as knowing how much water is being used. Unlike coal, natural gas, or other non-renewable resources, once water is "used," it does not disappear. (Recall that we have the same amount of water on earth now as we have had for thousands of years.) Rather, water is just moved into a different part of the water cycle. For example, with thermoelectric cooling, liquid water is converted to water vapor. It is then in a different part of the cycle, but is eventually converted back to liquid water (and perhaps solid) in the form of precipitation. If that precipitation falls over the ocean, it may stay there for a few days, or thousands of years. (The amount of time it stays in storage is called the residence time). If water is used to grow a food crop, it may evapotranspire in a matter of days, or it may stay in the plant, only to be consumed by an animal, and then perhaps by us, where it will eventually end up somewhere else. The UCAR Center for Science Education [101] (who operates the National Center for Atmospheric Research) provides the following [102] average residence times in the water cycle. It is important to point out that these are average residence times, and they are careful to note that there are exceptions to this:
A drop of water may spend over 3,000 years in the ocean before evaporating into the air, while a drop of water spends an average of just nine days in the atmosphere before falling back to Earth.
Water spends thousands to hundreds of thousands of years in the large ice sheets that cover Antarctica and Greenland
...snow that falls in the winter may only stick around for a few days in mid-latitudes locations, where temperatures often rise above freezing causing the snow to melt, or up to six months closer to the Arctic
..Water stays in soil for around one to two months although this varies greatly.
Like many sustainability-related issues, freshwater availability is complex. When we use water, we may eventually get it back in a usable form. But keep in mind that when we use freshwater (e.g., to irrigate crops, cool power plants, etc.), much of it ends up as water vapor, and on average (according to UCAR) 80% of precipitation falls over the ocean, where the residence time is an average of 3,000 years. It is difficult to convert it back to freshwater when this happens. As you will see below, the overall trend is toward less freshwater being available. The take-home message here is that it is in our best interests to make sure we maintain an adequate level of freshwater as possible by minimizing& use.
Okay, now you have an idea of what water scarcity is, and know different ways that human activity moves a lot of water in and out of different parts of the water cycle. You've also seen some indication of global water contamination issues. If you want to learn about some evidence of water scarcity, read through the suggested reading below.
Suggested Reading
Two important questions remain: Are we at risk of running out of fresh water? If so, how do we know? The article below will help us answer these questions.
- "One quarter of the world's population live in countries with a high level of water stress [103]," World Economic Forum
- "Is the world running out of fresh water? [104]" Tim Smedley, BBC.
Water Footprint
Given that most water is used for things other than direct household use, it stands to reason that there are "hidden" water costs to many of the things we do, use, and consume. Take a look around you, and think about what you ate today and yesterday. Have you ever thought about how much water was used for all of that "stuff?" Have you ever seen a water use label on a pack of hamburgers in the store? How about a loaf of bread? The label on your jeans? Neither have I and just like me, you would probably be shocked to find out how much water is used to produce most things. The Water Footprint Network [105] defines water footprint as "the amount of water used to produce each of the goods and services we use" (source: Water Footprint Network [106]).
A water footprint - like an ecological footprint - can be calculated for individual products, individual people, or groups of people (communities, cities, countries, etc.). The folks at the Water Footprint Network provide a lot of information about water footprints [107]. What is particularly nice about this organization is that they use peer-reviewed research as their information sources. The video below indicates some of the footprints of "everyday" products. The specific numbers are not meant to be gospel, but give you a good idea of water footprints. Note that the following 1 minute video has no audio narration.
This is how much water you use every day without even knowing. Enjoy a morning cup of coffee? That's 140 liters of water...just to grow the beans for a single cup. Staying clean is water intensive too...between 90 and 180 liters. Water is also used to make every item of clothing you wear. Your new T-shirt takes 2,720 liters and your favorite pair of jeans adds another 10,000 liters. Work in an office? Water use doesn't stop there. The office printer uses more than you think, as it takes 6,000 liters to produce one ream of paper. A single hamburger at lunch uses up 2,400 liters of water, mostly to grow the cattle feed. And the oranges in a single glass of juice take another 200 liters. Your drive home at the end of the day relies on water, with 177,000 liters used in the manufacture of a midsize car. An evening glass of wine uses as much water as your morning coffee. Leaving just enough for a glass of water before bed.
Take a look at the Water Footprint Network's product gallery [109]to see the (often surprising) water footprint of many common items.
Water and Equity
As with other sustainability issues, problems associated with access to fresh water is most acute in disadvantaged areas of the world. This includes low-income countries - particularly those in arid or semi-arid regions like sub-Saharan Africa - but also in impoverished communities in otherwise wealthy countries.
To Read Now
Browse through "Access to drinking water around the world - in five infographics [110]" by the Guardian, for a snapshot of international water issues.
UNICEF [111] is an organization that fights for the rights of every child worldwide through advocacy and action. It is part of the United Nations and is the best known and most powerful child advocacy organization in the world. They perform research, publish reports, collect donations, and administer aid throughout the world.
- (OPTIONAL) "Drinking Water: Equity, safety, and sustainability [112]." UNICEF. Browse through the section entitled "Social Disparities" (pp. 26 - 31). You do not have to read all of the content, but at least take a look at the charts provided. You are welcome to read the rest of the report as well.
What About Desalination?
Since about 97% of the water in the world is salt water, why can't we just desalinate (remove the salt from) this abundant source so we can use it for freshwater? Well, actually we can! This is done all over the world. According to the International Desalination Association [113], an industry organization, there are over 20,000 desalination plants in 150 countries that supply some 300 million people with at least part of their needs. Aha - problem solved! Wait, what's that you say? It is very energy intensive? It has negative environmental impacts? It is expensive? (You didn't think it would be that easy, did you?)
Desalination is a very promising technology, but it is not without its problems. You are welcome to read through the articles below, but the bottom line is that desalination plants, while a proven technology, require an immense amount of energy [114], can impact local environments in a variety of ways [115], and is quite expensive [114]. Desalination is probably necessary to satisfy the world's energy needs (and likely increasingly so), particularly in arid areas of the world. But as succinctly stated by Scientific American [115]: "Due to its high cost, energy intensiveness and overall ecological footprint, most environmental advocates view desalinization...as a last resort for providing fresh water to needy populations."
OPTIONAL Desalination Readings
The articles below provide a snapshot of domestic and international issues related to desalination. These are optional.
- "Lowering Desalination's Energy Footprint: Lessons from Israel [116]." Environmental Defense Fund.
- "UNICEF seawater desalination plant helps head off Gaza water crisis [117]." UNICEF.
- "The Impacts of Relying on Desalination for Water [115]." Scientific American.
- "Desalination is an expensive energy hog, but improvements are on the way [114]." PRI.
If you are interested in digging a little more deeply into the specific pros and cons of desalination, you can read through this article from Water Deeply [118]. The author provides links to a lot of quality information sources.
Check Your Understanding
Optional Reading
Finally, Sandra Postel summarizes many of the issues outlined above, and provides additional insight into water sustainability issues in her book chapter in Is Sustainability Still Possible? This is optional but may be helpful.
- Chapter 5 of Is Sustainability Still Possible? pp. 51 - 59.
Optional (But Strongly Suggested)
Now that you have completed the content, I suggest going through the Learning Objectives Self-Check list at the top of the page.
Biodiversity
Learning Objectives Self-Check
Read through the following statements/questions. You should be able to answer all of these after reading through the content on this page. I suggest writing or typing out your answers, but if nothing else, say them out loud to yourself.
The American Museum of Natural History in New York defines biodiversity thus:
The term biodiversity (from 'biological diversity') refers to the variety of life on Earth at all its levels, from genes to ecosystems, and can encompass the evolutionary, ecological, and cultural processes that sustain life. Biodiversity includes not only species we consider rare, threatened, or endangered, but also every living thing — from humans to organisms we know little about, such as microbes, fungi, and invertebrates.
Source: U.S. Museum of Natural History [119]
Biodiversity is the variety of life on earth, encompassing everything from the largest ecosystem to strands of DNA. It is in every living thing around us, and everything around us is part of it. I know, this all seems very poetic, and nature can be appreciated merely by virtue of its own beauty and diversity. But there are some practical, and even selfish reasons to care about biodiversity, as you will see in the readings below.
To Read Now
- "How does biodiversity loss affect me and everyone else?" [120] World Wildlife Foundation (Note the description of ecosystem services at the bottom.)
- E.O. Wilson Biodiversity Foundation - Introduction [121]
- (Optional) E.O. Wilson Biodiversity Foundation - The Diversity of Life [122]
As you can see, there are many reasons to care about biodiversity. Aside from the huge economic benefits of ecosystem services, we depend on the biosphere - and by extension, biodiversity - to sustain human life. We depend on ecosystem services for food, shelter, clothing, water, and even our oxygen. So yeah, basically everything we need to physically survive!
Life on earth is connected in innumerable ways (systems thinking, y'all!), and compromising one part of an ecosystem - including a single organism - has impacts in other areas. Unfortunately, human activity is playing a major role in ecosystem damage, including species extinction. Wilson points out [122] that:
"Species are disappearing at an accelerating rate through human action, primarily habitat destruction but also pollution and the introduction of exotic species into residual natural environments."
Humans are the main cause of the observed increase in extinction rates. Often, the impacts of this biodiversity loss are hard to predict. Donella Meadows, a well-regarded ecologist, pointed out a few of these in her essay "What is Biodiversity and Why Should We Care? [123]".
- Reforestation of the African Sahel was found to be impossible because the degraded soil was deprived of a bacteria that Acacia trees require to grow.
- North American songbirds are in decline because the areas they live in over the winter in Central America are in decline.
- European forests are more vulnerable to disruption than American forests because they are less biodiverse.
Biodiversity is a key aspect of ecosystem services, and ecosystem services are essential for human survival. (If you need a review of ecosystem services, refer to the first part of this lesson [124].) One thing that makes biodiversity difficult to manage is that we don't know how many species exist, and by extension do not know exactly how many are going extinct each year.
Many would also argue that nature has value in and of itself, irrespective of how it helps humans. This is often referred to as ecocentrism or deep ecology, which we will not discuss in more detail (but is worth looking into if you are so inclined). Humans also enjoy nature in many noneconomic ways. The "beauty of nature" is a common phrase, and being in and around nature can be both enjoyable and therapeutic. Indeed, nature is known to be therapeutic [125], as people in the emerging field of eco-psychology are documenting. I imagine most of you have enjoyed the soothing calm of a forest, desert, ocean, or even backyard. It is difficult to put a monetary value on this, but it is valuable all the same. Biodiversity makes all of this possible, and destroying biodiversity puts all of it at risk.
The 6th Mass Extinction
So how much danger are we in, and how do we know? As it turns out, it is possible to measure - or at least scientifically estimate - the rate at which biodiversity is dropping. As Carl Foulke pointed out in Chapter 2 of Is Sustainability Still Possible?, the rate of biodiversity loss as one of "The Nine Planetary Boundaries." The metric used to quantify this loss is the background extinction rate, which is defined as the number of species going extinct every year. So, how are we doing on this front? Some recently published studies can shed some light on this issue.
To Read Now
- "Sixth mass extinction: The era of 'biological annihilation' [126]." John D. Sutter, CNN.
- (OPTIONAL) "Stanford researcher declares that the 6th mass extinction is here [127]." Rob Jordan, Stanford News, or read the full, peer-reviewed article [128].
It's not every day that you read a serious article that quotes a knowledgeable person as stating that: "What is at stake is really the state of humanity." Alas, that is where we find ourselves on this issue. There is unequivocal evidence that populations of many species have dropped considerably since humans became the dominant species, and as the article states, the background extinction rate is probably at least "100 times what would be considered normal" (see the optional reading above for some insight on this), which may be a conservative estimate. As indicated in the article, there is some controversy regarding this issue - the Atlantic article [129] that Sutter links to provides a good, even-keeled assessment of some of them - but this primarily has to do with difficulty in determining the rate of extinction, and whether or not it should be considered a "mass extinction" or just a dangerous level of it. Any way you slice it, humans are causing species to go extinct at an accelerated rate for a variety of reasons, including land use change (especially food production), poaching, climate change, ocean acidification, and more.
It is important to point out that it is very unlikely that we have crossed an extinction threshold from which we cannot recover, but many signs point to us risking catastrophe. There is hope, but we will likely have to take action very quickly to prevent the worst outcome(s). Before this happens, it will have to be recognized as a problem, which unfortunately is only happening very slowly.
Check Your Understanding
Optional (But Strongly Suggested)
Now that you have completed the content, I suggest going through the Learning Objectives Self-Check list at the top of the page.
Summary and Final Tasks
Summary
That's it for this week! Please make sure you complete the two required assignments listed at the beginning of this lesson. This week, we applied a lot of the concepts in Lessons 1 and 2 to key sustainability issues. You should be able to do the following after completing the Lesson 3 activities:
- utilize characteristics of critical thinking;
- analyze the credibility of information sources;
- identify characteristics of the Anthropocene;
- explain how the greenhouse effect increases the average surface temperature of the earth;
- identify evidence for anthropogenic climate change;
- analyze equity impacts of sustainability considerations, such as climate change and water scarcity;
- identify characteristics of the 6th Mass Extinction;
- critique the credibility of information sources;
- explain the benefits of biodiversity;
- analyze sustainability impacts of freshwater availability;
- identify equity implications of access to fresh water;
- analyze the sustainability implications of coal, oil, natural gas, nuclear, and renewable energy; and
- apply the precautionary principle to sustainability considerations.
The Language of Sustainability
We went over a lot of fairly heavy concepts this week. Hopefully, this list will help spark some memories of the content, both now and as we move forward:
- defining characteristics of critical thinking (I suggest referring back to this "Critical Thinking" page frequently)
- evaluating information sources
- ecosystem services, Anthropocene, biosphere
- greenhouse effect, enhanced greenhouse effect, greenhouse gas, anthropogenic, anthropogenic climate change, methane vs. carbon dioxide as greenhouse gas, the precautionary principle
- biodiversity, 6th Mass Extinction, background extinction rate
- freshwater, economic water scarcity, physical water scarcity, major users of water, water footprint, desalination
Reminder - Complete all of the lesson tasks!
You have finished Lesson 3. Check the list of requirements on the first page of this lesson and the syllabus to make sure you have completed all of the activities listed before the due date. Once you've ensured that you've completed everything, you can begin reviewing Lesson 4 (or take a break!).
Complete all activities in Lesson 3. The quiz may include a variety of question types, such as multiple choice, multiple select, ordering, matching, true/false and "essay" (in some cases these require independent research and may be quantitative). Be sure to read each question carefully.
Unless specifically instructed otherwise, the answers to all questions come from the material presented in the course lesson. Do NOT go "Googling around" to find an answer. To complete the Activity successfully, you will need to read the lesson, and all required readings, fully and carefully.
Each week, a few questions may involve research beyond the material presented in the course lesson. This "research" requirement will be made clear in the question instructions. Be sure to allow yourself time for this! You will be graded on the correctness and quality of your answers. Make your answers as orderly and clear as possible. Help me understand what you are thinking and include data where relevant.
For any other assignments (e.g., journal or discussion board), it will be helpful to look at the rubric before answering. You will see a button that allows you to view it below the assignment.
These activities are to be done individually and are to represent YOUR OWN WORK. (See Academic Integrity and Research Ethics [130] for a full description of the College's policy related to Academic Integrity and penalties for violation.)
The activities are not timed but do close at 11:59 pm EST on the due date as shown on the Course Calendar.
If you have questions about the assignment, please post them to the "HAVE A QUESTION?" Discussion Forum. I am happy to provide clarification and guidance to help you understand the material and questions. Of course, it is best to ask early.