Development and Quality of Life
Learning Objectives Self-Check
Read through the following statements/questions. You should be able to answer all of these after reading through the content on this page. I suggest writing or typing out your answers, but if nothing else, say them out loud to yourself.
Clearly, there are a lot of ways to think about and measure whether or not we are living sustainably, and we've only scratched the surface in this course. So far, we've primarily examined how to be environmentally sustainable. But what about the other two "E's" of sustainability that were discussed in Lesson 1? If you can't remember what they are, I suggest clicking back to Lesson 1 [1] to refresh your memory.
Remember that one of the overarching goals of this course is to address issues from a humanistic perspective, which, among other things, means that we are concerned about the plight of all human life. And the discussion of equity made it clear that access to resources is an essential component of sustainability. Achieving environmental sustainability is a precondition for establishing this - humans live on the earth and need its resources to survive - but if we fail to address the quality of life of the people living on the planet, we've only won a partial victory. What good is a nice planet if all of the people on it are miserable?
Please Fill This Out
If someone gave you a choice between a high or low quality of life, chances are about 100% that you'd say "high." But what actually constitutes a high quality of life?
- Please indicate what you think is required to have a high quality of life [2].
- Once you submit, you can view recent real-time results. [3]
- If you are so inclined, view some past responses here. [4]
The Inadequacy of GDP
GDP is the most oft-used metric to indicate how a country's economy is doing. But it is also widely used as a general indicator of how a country's people are doing. There is some usefulness to this, as you will see below. But GDP obscures a lot of possible problems (economic, social, environmental, etc.), and does not indicate all of the good things about a society. In short, there are some things that are good for GDP that are bad for people, and there are some things that are good for people that are not necessarily good for GDP. This problem was eloquently described by Robert F. Kennedy in 1968. It is as relevant today as it was 45 years ago. Hopefully, this will give you some pause when you hear the latest GDP numbers as an indicator of how well a country is doing. Watch his speech below (2:11 minutes)
[Text on screen: It's been 40 years since Robert F. Kennedy gave a speech warning us about how poorly we measure the success of our nation. His words are as important today as they were then.]
Too much and for too long, we seemed to have surrendered personal excellence and community values in the mere accumulation of material things. Our Gross National Product, now, is over $800 billion dollars a year, but that Gross National Product - if we judge the United States of America by that - that Gross National Product counts air pollution and cigarette advertising, and ambulances to clear our highways of carnage.
It counts special locks for our doors and the jails for the people who break them. It counts the destruction of the redwood and the loss of our natural wonder in chaotic sprawl. It counts napalm and counts nuclear warheads and armored cars for the police to fight the riots in our cities. It counts Whitman's rifle and Speck's knife, and the television programs which glorify violence in order to sell toys to our children.
Yet the gross national product does not allow for the health of our children, the quality of their education or the joy of their play. It does not include the beauty of our poetry or the strength of our marriages, the intelligence of our public debate or the integrity of our public officials. It measures neither our wit nor our courage, neither our wisdom nor our learning, neither our compassion nor our devotion to our country, it measures everything in short, except that which makes life worthwhile. And it can tell us everything about America except why we are proud that we are Americans.
[Text on screen: Senator Kennedy's warning to the nation in 1968 is even more urgent today. A new debate is beginning, including hearings in the U.S. Congress. Get involved. To learn more, go to: http://www.glaserprogress.org/ [5]Good to Know: The Invisibility of Household Labor
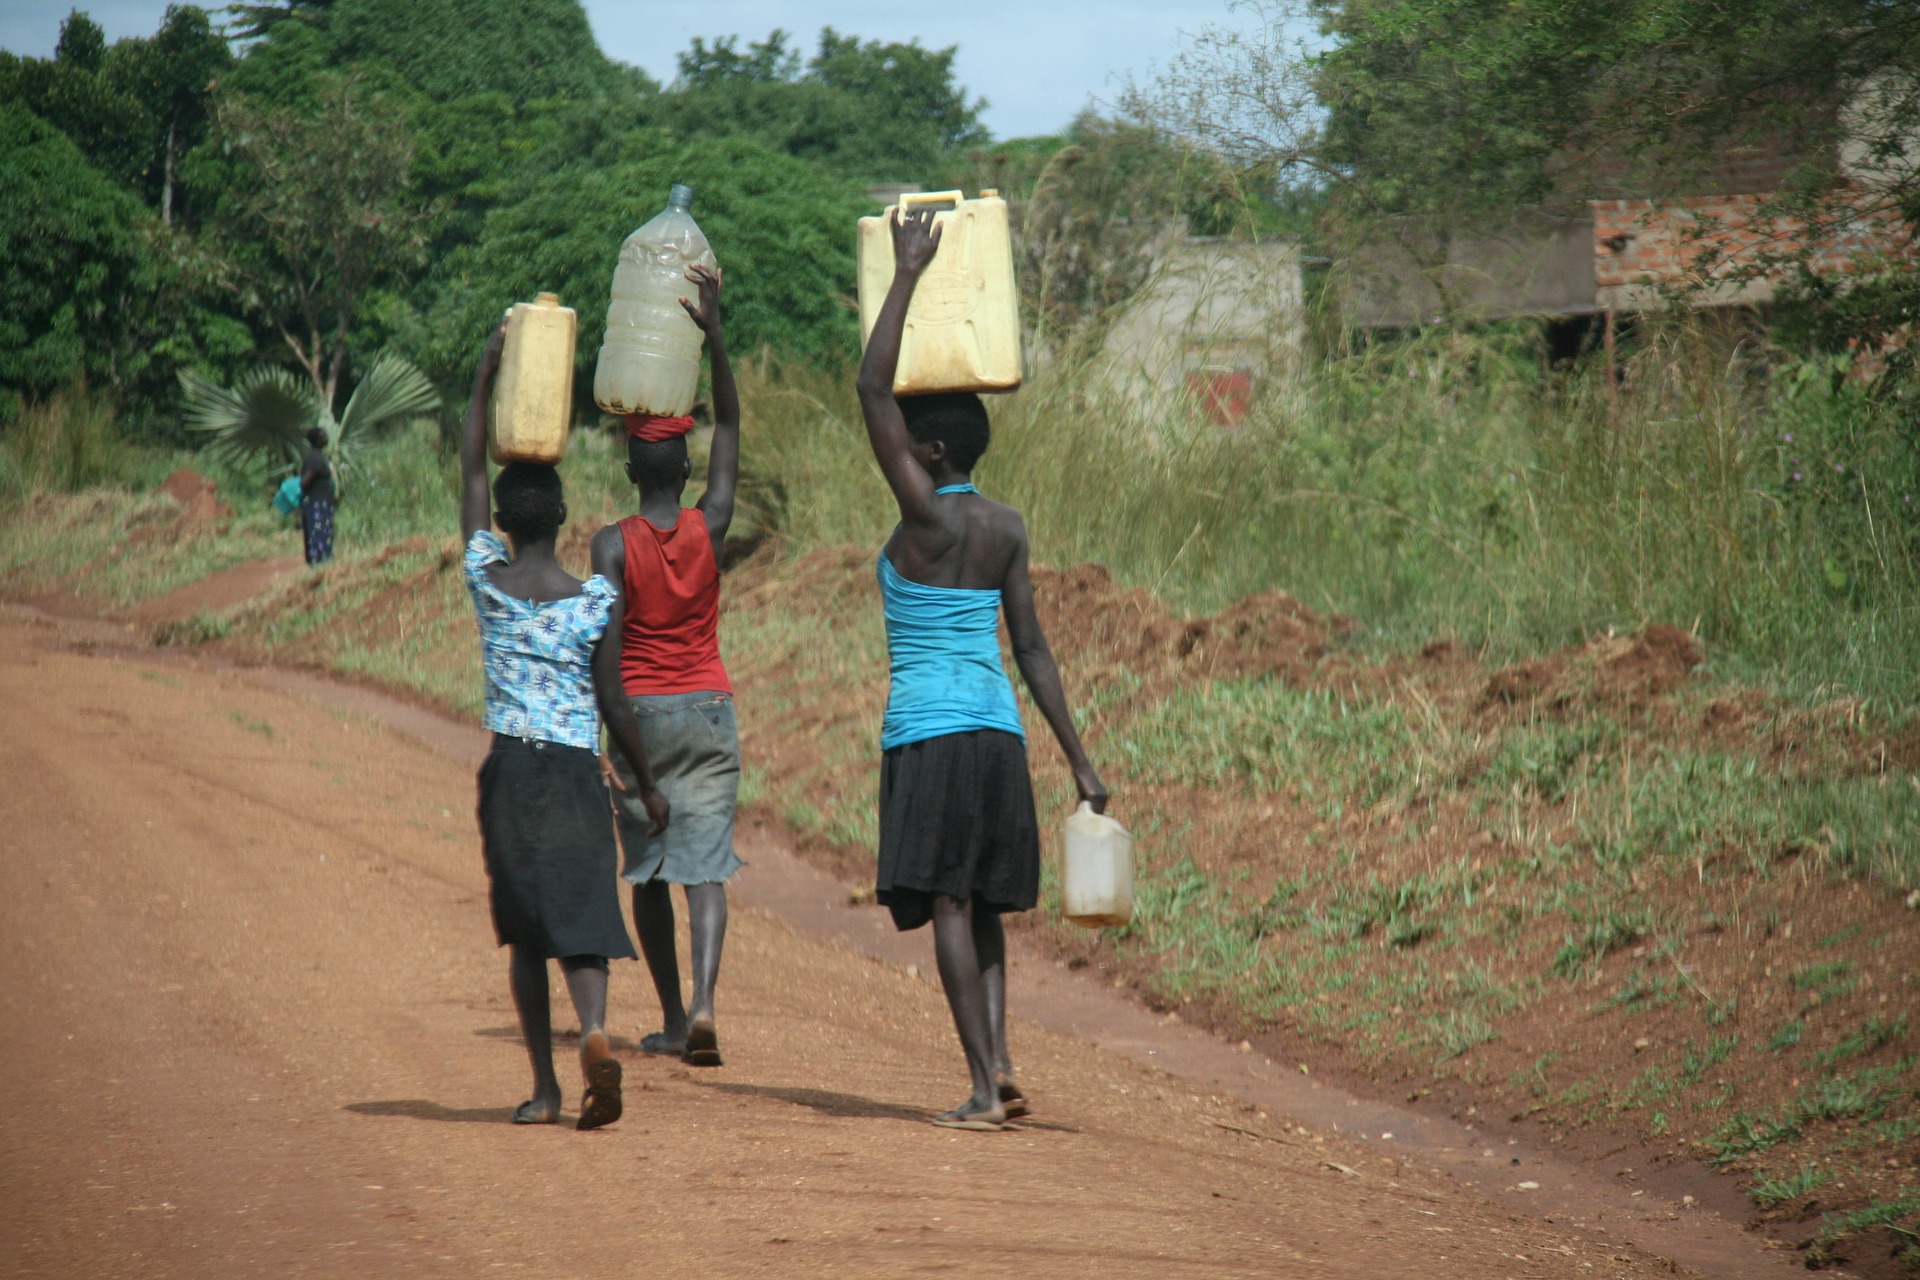
One of the major inadequacies of GDP as an indicator of how society is doing is the invisibility of household labor, which is primarily done by women. According to the OECD [8], men in the U.S. spend an average of 17.5 hours per week doing unpaid household labor, while women spend (wait for it) 28.4 hours per week! None of this is counted towards GDP. (Related note: If any parent or spouse is a "stay-at-home" mom or dad, please never say that they "don't work." They just don't get paid to work.)
This article [9] from the New York Times provides some interesting visualizations of the gender-based household labor gap across the world, and found that even at minimum wage women across the world would have made 10.9 trillion (!) dollars in 2019 alone. To provide some context, the total global GDP in 2020 was a little under 85 trillion, according to [10] the World Bank. A few other problems with GDP include:
- GDP/cap says nothing about the distribution of income in country.
- GDP/cap ignores the informal economy. (Even Craig's List doesn't count!)
Quality of Life
Quality of life is another one of those terms that is thrown around liberally but has no specific definition. We all want a high quality of life, but what does that mean exactly? I am not here to settle the debate, but I do like the definition from this website [14]: Quality of life is "the extent to which people's 'happiness requirements' are met." I'd add the term "satisfaction" in there as well, as in "are people's 'satisfaction' requirements met?" The same site also notes that "[Quality of life] may be defined as subjective well-being." Nothing is universally regarded as necessary for happiness, life satisfaction, or well-being. For example, I have friends who LOVE to hunt for deer and will sit for hours in a tree stand in the freezing cold, silently waiting for one to walk by. I can think of 1,000 things that I'd rather do than that (all numbers approximate). But to them, that is an important part of their quality of life. Nothing wrong at all with that, by the way - it's just not for me.
Hunting is something that is obviously not universally required for a high quality of life. But I'm sure there are thousands, if not millions, of people who count it as important. But if you think about it, there is nothing that everybody loves to do, so it wouldn't matter which activity I used as an example. So, if we want to measure the quality of life, how do we do it?
Let's go through a quick thought experiment.
- If you could ask everyone in the world up to 3 questions and were guaranteed a response for each one, what would you ask them? All that you want to know is whether or not they have a high quality of life.
- Now, assume you can get up to 5 pieces of data for everyone in the world (e.g., income, how many meals a day they eat, what living conditions they have, etc.). What 5 data points would you obtain?
Fill This Out
Please click on this link to fill out a short questionnaire. The answers are anonymous.
- Survey Link [15]
- See real-time results [16]
- (Optional) see some past results [17]
Development
We have used the word "development" solely with respect to "sustainable development" so far, though Herman Daly addressed development to some degree. The word development is used a LOT in economics, politics, and particularly in international studies. "Development Studies" is considered its own discipline and many schools offer Development Studies degrees [18].
But how do we know if a society or country is "developed?" Or better yet, how can we compare how well "developed" one country is relative to another? You probably have heard the term "undeveloped countries" or "underdeveloped countries" used in political or economic discourse. But have you ever stopped to think what that actually means? Clearly being "undeveloped" is a bad thing, so by using that term judgment is being passed. Most commonly, it is indicative of the relative income of a country and whether or not they've embraced the modern economic system. But as RFK pointed out (and as I'm sure your surveys will attest) income is not the only thing required to make life worth living.
To Read Now
The World Bank [19] is an international organization whose stated goals [20] are to 1) "End extreme poverty" and 2) "Promote shared prosperity." Historically, they have done this primarily by offering loans to governments and organizations.
The World Bank figures very prominently in global economics, but their reputation is mixed, especially among sustainable development advocates. They have a tendency to provide loans with conditions that push economies in the direction they want them to go, sometimes at the expense of the people in that country. That said, they have a lot of expertise, and are a good place for economic and other data. The document below provides a good explanation of what development is and is not. Frankly, it is surprising to see such a document from the World Bank, given their historical focus on economic growth alone. But they bring up some very good points. (Note that I summarize the key points below.)
- What is Development? [21] - The World Bank
A few important points from this reading:
- They state from the outset that "indicators of wealth...provide no information about the allocation of...resources" and that "countries with similar average incomes can differ substantially when comes to people's quality of life." They are clearly indicating that GDP is not the best way to measure development, which is particularly striking coming from an organization that so strongly advocates for economic growth.
- That stated, the World Bank understands that money is usually an important factor in achieving quality of life ("economic growth, by increasing a nation's total wealth, also enhances its potential for reducing poverty and solving other social problems"), but that there are many other factors as well. They mention income distribution, access to education and healthcare, environmental quality, employment opportunities, lack of crime, literacy rate, political freedom, and more.
- They quote the United Nations as saying that "human development is the end - economic growth a means." It is important to note that they say "a" means, not "the" means. Again, having at least a reasonably high income is an important factor in achieving some quality of life, but human development is the true goal.
- They note that not only can economic growth be good for development, but that development is good for economic growth. It is notable that they state that economic growth is "sustainable," if it comes with human development. Unlike Daly, they believe that sustainable growth is possible.
- They also mention the notion of social justice, which they define as "equality of opportunities for well-being, both within and among generations of people." This is not the only definition but is an important way to think about it. We'll delve more deeply into social justice in a minute. As noted previously, the term intergenerational equity is often used to describe the equity impacts between generations. This is a key consideration with regards to climate change and many other issues that will impact future generations.
- They advocate for systems thinking when they state that part of social justice is to consider how "the economic activities of some groups of people continue to jeopardize the well-being of people belonging to other groups or living in other parts of the world." Remember that systems thinking involves thinking about connections between one action and others.
Quality of Life Metrics
It should be clear by now that there are many possible factors that contribute to quality of life, or lack thereof. Back to our original question: How do we measure quality of life? For that, we need a quality of life metric. These are often referred to as development indices. Recall from Lesson 1 that it is important to be able to measure aspects of sustainability? Development indices are one aspect of this.
There are two approaches to this:
- on the one hand, we could try to directly measure quality of life itself;
- conversely, we could try to quantify the conditions that lead to a high quality of life.
There have been many attempts to do the latter and a few that have tried to do the former. It would be impossible to research all of these, but some of the most-used and/or most useful ones are listed below. The first two (HDI and Inequality-Adjusted HDI) measure things that lead to a high quality of life, the third one (Happiness Index) attempts to measure it directly, and the fourth (Multidimensional Poverty Index) measures things that indicate a lack of quality of life. The last one(Happy Planet Index) - which is optional - is a mixture of the two plus ecological footprint.
Please note that even the best metric cannot create a full picture of development, however it is measured. Even the most "developed" country - regardless of how you define development - will have people who are living in poor conditions. Also keep in mind that this is not a comprehensive list of development indices.
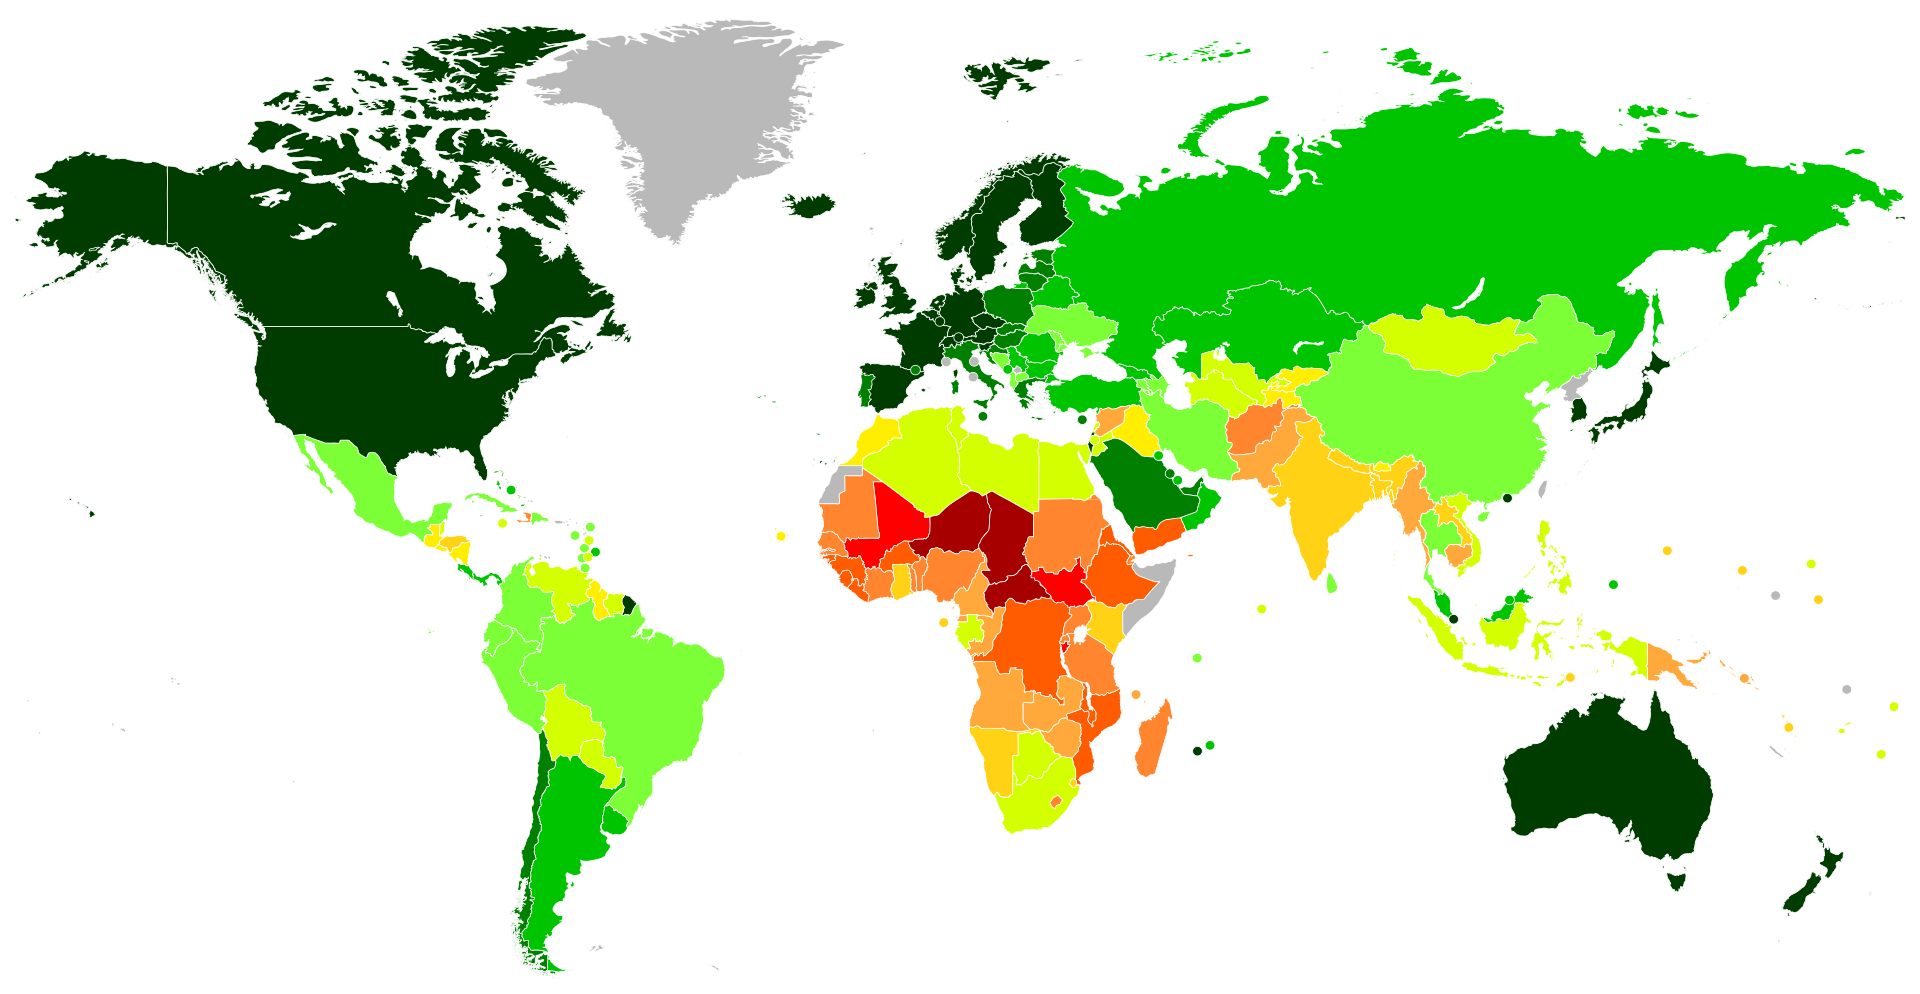
Human Development Index (HDI)
The Human Development Index is the most well-known quality of life metric. It was created by the United Nations (UN), who assesses it every year. It measures three things to determine quality of life, as you will see below: living a "long and healthy life, being knowledgeable, and hav(ing) a decent standard of living." The HDI scale goes from 0 (the worst possible) to 1 (the best possible).
Suggested Reading
I suggest reading the following short description and browsing the most recent HDI rankings by country.
- Human Development Index [22], United Nations Development Programme
HDI combines three indicators to evaluate the level of development in a country:
- Life expectancy
- Education (mean years of schooling, expected years of schooling)
- Income per capita
This is intended to provide a fuller picture of human development. They do recognize some inadequacies of HDI, though, as they state: "The HDI simplifies and captures only part of what human development entails. It does not reflect on inequalities, poverty, human security, empowerment, etc." Some of this is addressed in the Inequality-Adjusted HDI, which is addressed below.
Inequality Adjusted HDI
The UN also publishes Inequality-Adjusted HDI (IHDI), which takes HDI and discounts it according to how equally the individual development metrics are spread across the population. If the Inequality-Adjusted HDI is lower than a country's HDI, then there is some inequality. For example, let's say two countries both have an average life expectancy of 74 years, which means life expectancy would be the same in the HDI rankings. But if in country A the wealthy people are living much longer than the low-income folks, and in country B pretty much everyone has the same average lifespan regardless of wealth, country B would be higher on the Inequality-Adjusted HDI rankings.
The Inequality-Adjusted HDI also uses a scale of 0 to 1, with 1 being the highest. Note that all countries have some inequality, so all IHDI scores are at least a little bit lower than the HDI score for that country.
As noted by the UN, the IHDI represents "the loss to human development due to inequality." The more inequality, the more the HDI score drops when adjusted for inequality. Note that the pattern in the map below is similar to the HDI map above, but the raw values are a little bit lower.
Suggested Reading
The short reading below from the UN provides a description of IHDI.
- Inequality-Adjusted HDI [25], United Nations Development Programme
 [26]
[26]
World Happiness Index/Report
The Sustainable Development Solutions Network [28], an organization with esteemed members from throughout the world, has published the World Happiness Report since 2012 (the 2023 version of the World Happiness Report is available [29]). This reporting effort is led in part by renowned International Development expert Jeffrey Sachs of Columbia University.
The World Happiness Report asks people to indicate on a scale of 0 - 10 their quality of life now and their expected quality of life in the future (see World Happiness Report details here [30], if you'd like). The basic premise behind this is that if you would like to determine how happy or satisfied someone is with their life, just ask them. This is a type of self-reported quality of life and results in a score of 0 - 10. This is sometimes referred to as the Happiness Index.
Pretty simple, right? Though it does beg some important questions. For example, if someone lives a short life with little education, but they are happy, does it matter? What about someone that has very little freedom, but is happy? What if they have almost no money, but are happy? What if others in their country lead much "better" lives, but they do not know it? I do not have the answers, but they are important questions to think about.
Suggested Readings
- It’s a Three-Peat, Finland Keeps Top Spot as Happiest Country in World [31], World Happiness Report (You can stop at "The World Happiness Report 2020 includes the following chapters:")
You may want to read the following as well.
- These are the happiest countries in the world [32], World Economic Forum.
- Browse Figure 2.1 on pp. 17-19 of the 2022 World Happiness Report [33].
A few things worth noting from the first reading:
- Since the first World Happiness Report in 2012, four countries have earned the top spot: Denmark, Norway, Finland, and Switzerland.
- The top end of the list is dominated by Nordic and Central European countries (all of whom are characterized by progressive political ideology, not coincidentally). The top 10 countries, in order, are: Finland, Denmark, Switzerland, Iceland, Norway, the Netherlands, Sweden, New Zealand, Luxemborg, Austria. The U.S. is currently #18.
- Social factors are very important. From the article: "Time and again we see the reasons for wellbeing include good social support networks, social trust, honest governments, safe environments, and healthy lives.'"
- They provide some explanation for the previous point: "A happy social environment, whether urban or rural, is one where people feel a sense of belonging, where they trust and enjoy each other and their shared institutions,” said John Helliwell. “There is also more resilience, because shared trust reduces the burden of hardships, and thereby lessens the inequality of well-being.'"
- Inequality plays a role as well: "Happiness inequality significantly reduces average life evaluations,” said Richard Layard, “This means that people are happier to live in societies without extreme disparity in the quality of life.'"
Multidimensional Poverty Index
The Multidimensional Poverty Index (MPI) is another UN metric. The premise of the MPI based on the recognition that (lack of) income is not the only way to measure poverty. For example, if a family is above the income-based poverty level but does not have access to adequate health care or education, they are stilll "poor" in quality of life terms.
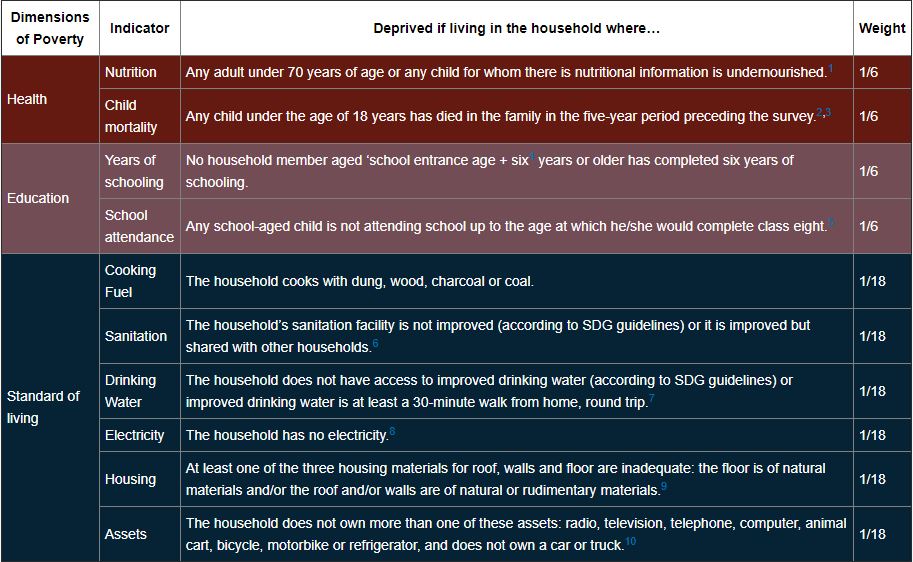
The United Nations Development Programme(UNDP) summarizes the MPI [34]thusly: "The MPI looks beyond income to understand how people experience poverty in multiple and simultaneous ways. It identifies how people are being left behind across three key dimensions: health, education and standard of living, comprising 10 indicators. People who experience deprivation in at least one third of these weighted indicators fall into the category of multidimensionally poor."
As you can see below, the MPI provides a weighted list of measurable indicators. If someone experiences at least one third (1/3) of these factors, they are considered "multidimensionally poor." For example, if a family has a child that died in the last five years(1/6 weight) and one child does not attend school up to class eight (1/6 weight), they would be multidimensionally poor (1/6 + 1/6 = 1/3). But if someone was undernourished (1/6) and they don't have electricity (1/18) and cook with wood (1/18) they would not be considered multidimensionally poor (1/6 + 1/18 + 1/18 = less than 1/3). You may be thinking that it is pretty callous to consider undernourishment alone as not enough to be poor. To be fair to the UN, they spend a lot of time helping undernourished people. (As you may remember, "zero hunger [35]" is one of the UN's Sustainable Development Goals.) Just because they are not "multidimensionally" poor does not mean that they are not considered worthy of assistance! It is merely an imperfect but helpful attempt to identify the most underserved populations in the world.
 [34]
[34]
Optional Reading
The reading below from the UNDP outlines findings from a recent report on MPI.
- The 2020 Global Multidimensional Poverty Index (MPI) [34], United Nations Development Programme
OPTIONAL - Happy Planet Index
The Happy Planet index takes into account both well-being (they use the same metric as the Happiness Index), life expectancy (like the HDI), and inequality of outcomes. The higher your well-being and life expectancy, the higher your score. Inequality is expressed as a percentage, with a higher percentage meaning more equal outcomes. But what is unique about the Happy Planet Index is that it divides by the ecological footprint, so a higher ecological footprint will result in a lower score, and vice-versa. Nic Marks created this index. He describes it in the short (1:54) video below.
To View Now
Everybody wants to live a good life and I presume we want people in the future to live good lives. We created that the happy planet index really to highlight the tension between creating good lives now and good lives in the future.
Because we think people should be happy and the planet should be happy, why don't we create a measure of progress that shows that? And what we do is we say that the ultimate outcome of a nation is how successful is it at creating happy and healthy lives for its citizens? Economic activity tends to be taken as a sign of the sort of strength and power of a nation and yet all it is, is just economic turnover.
What the happy planet index does is, it takes two things, really: it's looking at the well-being of citizens in countries and then is looking at how many resources they use.
It creates what we'll call an efficiency measure: it says how much well-being do you get for your resources? It's like a miles per gallon, bang per buck indicator.
Running horizontally on the graph, ecological footprint is how much pressure we put on the planet. More is bad. Running vertically upwards is a measure called happy life years. It’s like a happiness adjusted life expectancy, and the yellow dot there you see is the global average.
The challenge really is to pull the global average up here. That's what we need to do. And if we're going to do that, we need to pull countries from the bottom, and we need to pull countries from the right of the graph, and then we're starting to create a Happy Planet.
You can download the report, you can check out your own personal HPI score. That’s the first global index of sustainable well-being.
To Read Now
Read about the Happy Planet Index [38] here, including how it is calculated and its limitations. You may want to browse the data here [39]. You are welcome, but not required, to watch the TED talk.
Optional (But Strongly Suggested)
Now that you have completed the content, I suggest going through the Learning Objectives Self-Check list at the top of the page.