Natural Gas
Learning Objectives Self-Check
Read through the following statements/questions. You should be able to answer all of these after reading through the content on this page. I suggest writing or typing out your answers, but if nothing else, say them out loud to yourself.
Natural Gas
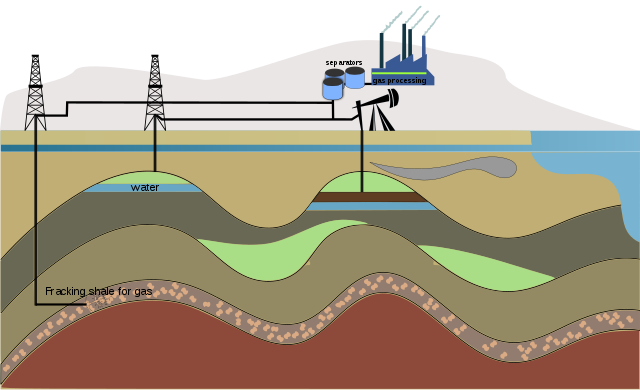
Unless you've been hiding under a rock for the past 20 years or so, you have heard about natural gas in the news. If you have heard about it, it was most likely in relation to hydraulic fracturing, or simply "fracking." This is a VERY controversial topic at the moment, and with good reason (as we'll see below). Because of this, you have to be careful where you get your information (good thing you are taking this course!). Our old friend Hank provides a pretty clear and unbiased description of fracking in the video below (4:32 minutes).
In case you hadn't heard, we humans use a lot of oil and gas these days. Just a couple of sorts of hydrocarbons, organic compounds made out of hydrogen carbon atoms. They are a magnificent source of stored energy running a car engine or a fighter jet or a weed whacker or a power plant. Hydrocarbons are pretty useful. A lot of the world's precious petroleum comes from the Middle East, but that puts a few of the world's countries in the position of having all of the useful oil and gas. So, of course, the rest of us are interested in hunting down some domestic sources. Actually, turns out the Middle East doesn't have the hydrocarbon market cornered, they just have a lot more liquid petroleum in most places. But a lot of the rest of the world has reserves of natural gas. Gaseous hydrocarbons like methane, propane, and butane.
Usually found deep underground in giant beds of shale, rock that was formed from the floors of ancient oceans, natural gas is likely how your water gets heated and maybe even your air. Burning it for electricity is cleaner and more efficient than coal, and unlike oil when it spills, it just vents into the atmosphere instead of spreading out in huge slicks over the ocean. The problem with natural gas has always been, how do we get at it? We know it's there, but we can't get it!
Since the forties, oil companies have known that breaking up the rocks in deep underground formations can increase the productivity of wells. See it's not just one big pocket of black gold down there. Oil and gas can occur in thousands of little pockets, and by fracturing the rocks around these pockets, the gas is released and can be collected. Usually, this fracturing involves pumping millions of gallons of chemically treated water into deep shale formations. We're talking a mile or more underground at extremely high pressures. This fluid cracks the shale or widens existing cracks, freeing the hydrocarbons and making a path for them to flow toward the well. So that's how it's done basically, and some people are so unbelievably pumped about this technology they're building little graven images to it, and going to natural gas wells on Sunday mornings.
But then, some scientists are like - not so fast you guys, cuz fracking isn't all butterflies and cupcakes. For starters, it uses a whole lot of water. It takes up to seven million gallons to frack a single well and at least 30 percent of that water is trapped in the shale thousands of feet below the groundwater aquifer, so it's gone for good. Fracking fluid isn't just water; it's sand which helps keep the cracks open once they're formed, but also chemical additives which can vary from well to well and are often confidential. These additives do things like thicken the water to help suspend the sand or prevent mineral buildup in the pipe, and some are things you might find under your kitchen sink. Others, like benzene and methanol, are pretty toxic.
Some concerns about the contents of these fracking fluids, not to mention radium, corrosive salts, and other stuff that comes back up from a mile underground, have led places like Pennsylvania to prohibit fracking outfits from sending their wastewater to local treatment plants and although fracking, when done correctly, shouldn't contaminate drinking water aquifers, that doesn't mean it hasn't happened.
Subterranean systems are mysterious, and it's impossible to tell how interconnected the shale deposits might be with groundwater. If the fracturing is too effective, groundwater aquifers and shale deposits containing newly injected fracking fluid can mix. Although it's hard to say how many cases of contamination have been caused by improperly installed or maintained fracking wells, improperly bored or sealed wells have contaminated drinking water in several sites in the US, resulting in energy companies being fined for polluting water supplies. While natural gas is a far cleaner fuel than coal, the fact that it doesn't spill and instead vents to the atmosphere is also problematic for climate change. Methane is a potent greenhouse gas and if it isn't burned as it vents from fracking wells, it can contribute even more to global warming.
And finally, earthquakes. It's crazy, but some US states like Oklahoma, Texas, and Colorado have been experiencing a significant rise in seismic activity, which seems to be corresponding to the fracking boom. Some studies are suggesting that the disposal of wastewater back into used wells is causing the pressurized water to seep through cracks onto old fault lines causing many more earthquakes than normal even in places where seismic activity is rare.
So, fracking - creating a new oil and gas boom in the US, sure, but it might not be all it's fracked up to be. Sorry, we didn't make any Battlestar Galactica jokes. So, if you want you could put those down in the comments. If you have any questions or comments or just want to argue about it, the comments are there for that as well. There are also sources, if you'd like to check those out, that would be good. And if you want to keep getting smarter with us here at SciShow, you can go to youtube.com/scishow and subscribe.
One popular misconception is that fracking has only been around since the early 2000's or so. As Hank explains, this is simply not the case. Hydraulic fracturing has been known to increase the output of gas (and oil!) wells since the mid-1900s. The main innovation that has caused the recent fracking boom is directional drilling (sometimes called horizontal drilling). Until relatively recently, oil and gas wells were generally drilled in a straight line. But directional drilling allows operators to change the direction of the drill bits so that they can trace the path of underground rock layers (which are rarely straight up and down). This allows for significantly more gas output per well and is what mainly facilitated the fracking boom.
Supply
Like coal, it is impossible to determine the amount of natural gas reserves available in the U.S. or worldwide. First of all, it's underground, so we cannot directly measure it, though reasonable estimates can be made. But more importantly, as technology changes, the proved natural gas reserves change as well. Most of the data you will see are based on "proved reserves," which the EIA defines as "estimated volumes of hydrocarbon resources that analysis of geologic and engineering data demonstrates with reasonable certainty are recoverable under existing economic and operating conditions." (Source: US EIA [4]). Basically, proved reserves are a reasonable estimate of the amount of natural gas that can be recovered given current technology, and for a profit.
The upshot to this is that 1) technology is changing rapidly, as evidenced by the boom in natural gas in the past 10 years or so, which is due entirely to fracking, and 2) as more test (exploratory) wells are drilled, more natural gas is discovered. See the chart below for the result of this moving target in the U.S.
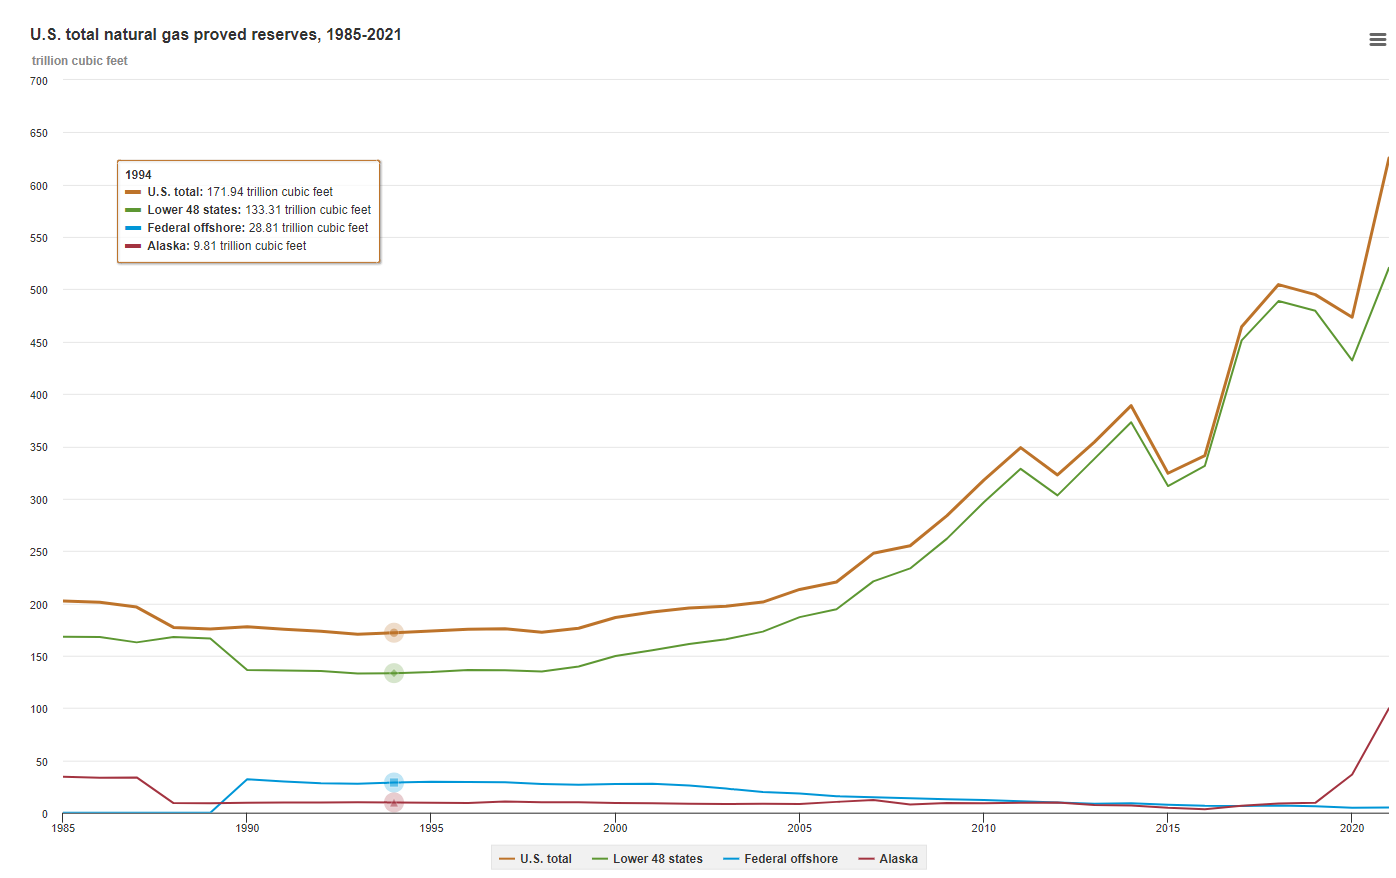
What is particularly interesting about this chart is that the proved reserves have mostly increased even as we have continued to produce and use more natural gas. This can seem counterintuitive because it seems logical that as we take more of the gas out of the ground, less would be left. This is technically correct, but at the moment, the industry is less concerned with how much is left than how much is available. For the reasons indicated above - primarily technological advance - more is available even though less is left. The increase in production in the U.S., as well as the projected increase, can be seen in the chart below.
I'm sure you noticed the dramatic drop in proved reserves from 2011 to 2012 and 2014 to 2015. 2015 has a somewhat simple explanation: "Declines in natural gas prices in 2012 and 2015 contributed to reductions in proved reserves estimates in those years", according to the EIA [6]. Again, this is a quirk of how we define proved reserves. Since proved reserves refer to the natural gas that is "economically recoverable," if prices are down and/or projected to continue, the proved reserves go down with them because it is more difficult to make a profit. (For a more in-depth discussion of these drops, see the optional reading below.)
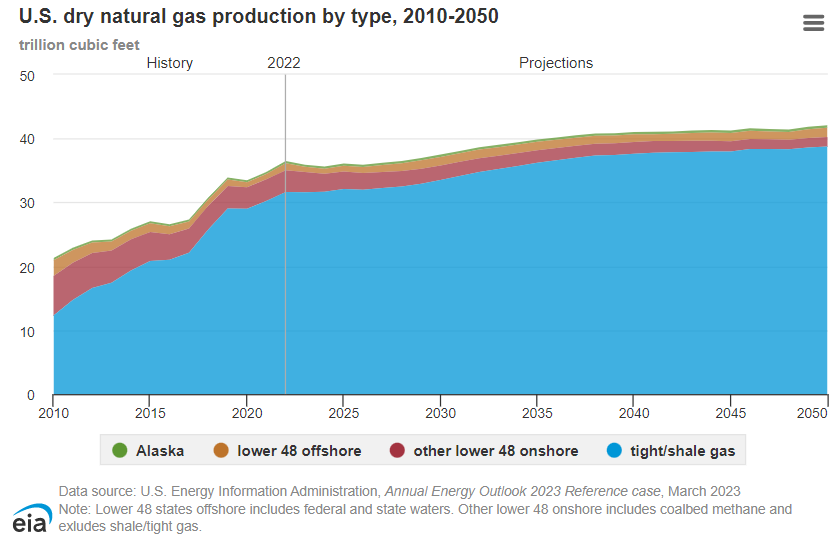
In the chart above, shale gas refers to gas that is locked up in the pores of shale in underground layers, as described in the fracking video above. It is clear that this is the biggest source of natural gas in the U.S. and is only projected to grow. (Seriously - look at that giant blue blob in the figure above! That's mostly shale gas.) Tight gas refers to gas that is locked up in other formations like low-permeability sandstone. For a full explanation of the terms, see the EIA website: Natural Gas Explained [8]. One important thing to point out is that unlike oil wells, fracked gas wells rapidly lose production over a very short period of time. The table below shows the reduction in the production of wells in various parts of the U.S.

So, if the well output declines, how do companies keep up production? Drill more wells! In order to maintain supply, wells must be drilled at a very high rate.
Optional
What the heck happened to natural gas reserves in 2012 and 2015?
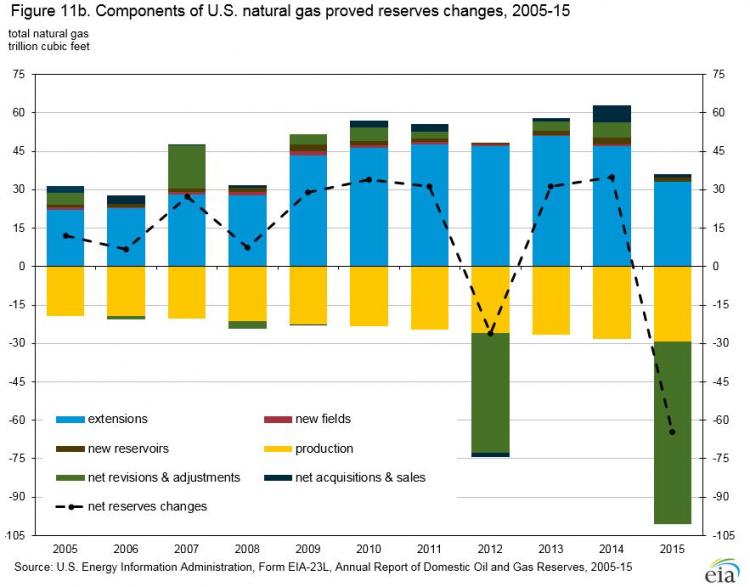
You probably noticed a sharp drop in proved reserves from 2011 to 2012 and 2014 to 2015 in the chart above. It should jump off the page at you. So what happened that year? Did the technology all of a sudden decline? Did we pull out a record amount of natural gas? Actually, this was an adjustment known as a "revision." As explained by the EIA: "Revisions primarily occur when operators change their estimates of what they will be able to produce from the properties they operate in response to changing prices or improvements in technology." Recall that proved reserves depend upon financial feasibility and the state of the technology. This is an inexact science, and the natural gas industry is constantly adjusting expectations based on those changing factors. The energy industry is nothing if not dynamic!
At any rate, you can see in the chart below that the proved reserves had MAJOR downward "revisions" in 2012 and 2015. As noted above, this was primarily the result of the price of natural gas dropping, causing companies to revise the estimate of economically recoverable natural gas downward.
You might also notice that the most consistent negative impact on proved reserves is production, i.e., what is being extracted (represented as yellow columns). But in most years, operators make up for production with increased "extensions" which are "additions to reserves that result from additional drilling and exploration in previously discovered reservoirs." So basically, drillers are usually able to find ways to get more gas out of the same wells faster than they actually extract gas (at least according to their estimates).
As you can see, when it comes to determining how much natural gas is left, well, it's complicated. (Sorry if you are tired of reading this phrase by now!) But hopefully, at this point, you have a better understanding of how the remaining amount is quantified.
While knowing the (approximate) amount of accessible natural gas is helpful, it is perhaps more useful to know how long these supplies will last. I would now like you to think about how, using proved reserves as a starting point, you could calculate the number of years of supplies remaining. (Hint: You also need to know the rate at which supplies are used.) The EIA provides the following analysis and explanation on their "How much natural gas is left and how long will it last [12]" webpage:
The U.S. Energy Information Administration estimates in the Annual Energy Outlook 2021 that as of January 1, 2019, there were about 2,867 trillion cubic feet (Tcf) of technically recoverable resources (TRR) of dry natural gas in the United States. Assuming the same annual rate of U.S. dry natural gas production in 2019 of nearly 34 Tcf, the United States has enough dry natural gas to last about 84 years. The actual number of years the TRR will last depends on the actual amount of dry natural gas produced and on changes in natural gas TRR in future years.
Technically recoverable reserves include proved reserves and unproved resources. Proved reserves of crude oil and natural gas are the estimated volumes expected to be produced, with reasonable certainty, under existing economic and operating conditions. Unproved resources of crude oil and natural gas are additional volumes estimated to be technically recoverable without consideration of economics or operating conditions, based on the application of current technology. EIA estimates that as of January 1, 2019, the United States had about 475 Tcf of proved reserves and 2,392 Tcf of unproved reserves of dry natural gas.
As with coal, to determine the approximate number of years left, you just divide the estimated reserves by the annual use. (Interestingly, the EIA calculated that we would only have about 80 years left two years ago and 400 trillion fewer cubic feet.) It is notable that the EIA's number includes unproved reserves, and thus should be seen as a high-end estimate.
Optional Readings
- "How Much Natural Gas is Left? [5] US EIA.
- "Just How Long Will U.S. Gas Supplies Last? [13]" Peter Kelly-Detwiler, Forbes Magazine.
Feasibility and Sustainability Issues
Like coal, the natural gas infrastructure is well-established, including wells, pipelines, and power plants. As you saw in the figure on the previous page, natural gas is relatively cheap. The recent boom in natural gas production has provided a lot of high-paying relatively low-skilled jobs and has generated millions of dollars in royalties for landowners. Increased use and cheaper (upfront) cost of natural gas has allowed the widespread replacement of coal-fired power plants, which has resulted in natural gas increasing its share of U.S. electricity production from 24% in 2010 to about 33% in 2015 (when it was about even with coal), to nearly 40% as of 2021. During the same period, coal's share has dropped from 45% to about 22%. This is a major change in just over a decade!
Good to Know: Electricity Fuel Mix
As budding energy and environmental experts, you should be familiar with industry terminology. The percent of electricity that a country (or other area) gets from various sources is referred to as "electricity fuel mix." Figure 4.12 is thus a chart that details electricity fuel mix in the U.S. The total energy by source (e.g. the Sankey chart we looked at in lesson 1) is the "energy fuel mix."
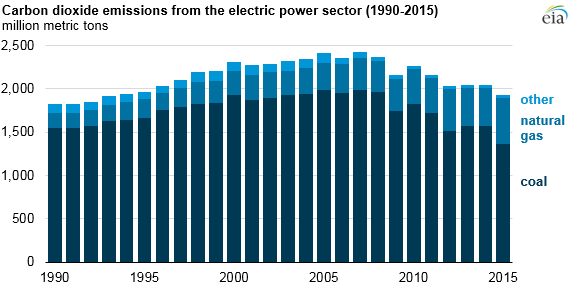
One major benefit of this is that it has contributed to reduced CO2 emissions that come from electricity generation in the U.S. These emissions are at their lowest level since 1993. The EIA explains that: "A shift in the electricity generation mix, with generation from natural gas and renewables displacing coal-fired power, drove the reductions in (CO2) emissions." This is a major benefit of natural gas (and renewable energy of course!). As indicated previously, burning natural gas results in approximately half of the emissions from an equal amount of coal energy.
But this is not the whole story regarding emissions. Remember that while natural gas emits about half of the CO2 as an equivalent amount of coal when burned, natural gas itself is about 30 times as powerful as carbon dioxide in terms of greenhouse effect impact over a 100 year period and about 80 times as powerful over a 20 year period. One result of this is that methane leaks throughout the natural gas supply chain (from the well to the end-user) counteract some of the positive impacts of natural gas being a relatively clean-burning fuel. How much of an impact is open to debate. Though some research [18] has indicated that the emissions from leaks are vastly underestimated and may be worse for climate change than coal, a recent report by the International Energy Agency [19] found that the best scientific estimates indicate that "on average, gas generates far fewer greenhouse-gas emissions than coal when generating heat or electricity, regardless of the timeframe considered." In other words, from a climate change perspective, the IEA believes that it is better to use natural gas than coal. But that is up for debate.
So that solves the debate, right? Not so fast! The IEA makes it clear in the same report that: "The environmental case for gas does not depend on beating the emissions performance of the most carbon-intensive fuel, but in ensuring that its emission intensity is as low as practicable" (my emphasis added). In other words, based on what we know about the GHG-climate change connection, we should not just use the "lesser of two evils" (those are my words, not theirs), but seek to reduce emissions as much as possible, regardless of the source. They also point out that about half of global leakage-based emissions could be stopped with no additional cost, and in many instances, it would actually save money to reduce emissions. And even where it would cost money to prevent the leaks, in all regions it is at least as cheap or cheaper to stop methane leaks than to reduce emissions in other ways.
Optional/Suggested Reading
As noted above, natural gas is a very controversial issue, specifically with regard to fracking. Some of the issues involved are outlined in the articles below. To say that this only scratches the surface of information on this topic is a massive understatement! I encourage you to research this issue further.
- (Strongly suggested) "Pros and cons of fracking: Research updates [20]." John Wihbey, Yale Climate Connections.
- (Optional) "Natural Gas and the Environment [21]. [22]" U.S. EIA.
- (Optional) "Fracking Has Not Had Big Effect on Water Supply, E.P.A. Says While Noting Risks [23]." New York Times.
- (Optional) "Commentary: The environmental case for natural gas [24]. [22]" The International Energy Agency.
- (Optional) "A dirty little secret [25]." The Economist.
- (Optional) "Methane Leaks May Greatly Exceed Estimates, Report Says [26]." New York Times.
- (Optional) "A Tale of 3 Countries: Water Risks to Global Shale Development [27]." Andrew Maddocks, World Resources Institute.
Some key points from these articles include:
- One of the researchers interviewed in the New York Times article states that: "Absolutely the biggest trend is the decline in coal use...Coal use dropped a further 20 percent from 2014 to 2016, to be overtaken by natural gas in 2016. Natural gas is now the number one fuel for electricity generation in the U.S." So one undeniable impact of the fracking boom (as indicated above) is that natural gas has increasingly taken the place of coal in the energy landscape (systems thinking alert!).
- Regarding fracking and contamination of water: "The overall peer-reviewed, final verdict was: 'These activities can impact drinking water resources under some circumstances. Impacts can range in frequency and severity, depending on the combination of hydraulic fracturing water cycle activities and local- or regional-scale factors.'" Widespread water contamination was not found, but there are verified cases of water supplies being tainted. On the flip side, we may not know the full impacts of fracking on water supplies for years or decades due to complex geology, especially on the U.S. East Coast.
- Further: "In Pennsylvania, there continue to be complaints and documented small incidents, researchers say, but concerns over surface activities and well integrity remain more common than those involving deep fracking; problems arise, for example, when companies leave thousands of feet of uncemented wells. Adhering to industry best practices’ and guidelines appears to eliminate most issues with deep fracking itself." The article goes on to point out that shallow wells (within 2,000 feet or so of the surface is, believe it or not, considered shallow!) pose the greatest risk in general. However, any well that is not properly sealed and cemented poses risks.
- Regarding earthquakes: "There is no longer serious doubt that activities associated with energy extraction can trigger earthquakes. Leading researchers have stated in a 2015 policy article published in Science that, to a large extent, the increasing rate of earthquakes in the mid-continent is due to fluid-injection activities used in modern energy production. Evidence on that point involving the mechanics of these impacts has become clearer and more specific: Wastewater disposal, rather than the hydraulic fracturing itself per se, clearly causes most of the earthquakes." They go on to say that fracking itself may cause earthquakes, but that appears to very much be the exception. So to recap: the disposal of fracking wastewater by injecting into the underground formations, including oil wells, is causing earthquakes. Usually, this is not serious, but some fracking operations have been shut down due to earthquake risk.
- Regarding methane leaks: "Methane is a highly potent greenhouse gas that, if leaked in sufficient quantities, undermines at least some and potentially much of the purported emissions benefits of natural gas...Authors of another new study, published in the Proceedings of the National Academy of Sciences, PNAS, find that a 'small proportion of high-emitting wells, most of them no longer in active use, can account for most of the problem. Monitoring old wells, then, is a crucial aspect of the solution to stopping leaks, but it’s no easy task. As the PNAS study notes, the 'number of abandoned wells may be as high as 750,000 in Pennsylvania alone.'...authors of a 2017 study found that methane leaks were incredibly high across fracking operations in northwestern Canada." Overall, there is no clear verdict on this one. It is certain that there are fugitive emissions coming from oil and gas operations, but how much is up for debate. It does appear that most of the total leakage is from a few major emitters, but overall it can be difficult to monitor all leaks because of the huge number of wells in the U.S.
There are many other sustainability concerns regarding fracking, including:
- up to 5-7 million gallons of water are used per well, much of which is unrecoverable - this is a particular problem in dry areas of the world (e.g., Colorado) where water is scarce;
- the water that is recovered is often contaminated with hazardous chemicals and substances;
- heavy truck traffic and noise are often associated with fracking, which is particularly burdensome in rural areas of the country;
- nearby landowners who receive little of the economic benefit from fracking share burdens of those who receive royalties;
- and more.
All that said, the recent fracking boom has revived the U.S. oil and natural gas industry and created or supported millions of jobs. Also, natural gas-fired power plants can also be energy to supplement renewable energy like wind [28]. Natural gas-fired power plants can increase and decrease output quickly, much more so than coal or nuclear. So, if energy generation from solar or wind drops suddenly, natural gas can make up the difference through increased output. However, these "peaker" plants are very inefficient, and so are not good from an emissions perspective. Until widespread storage is available through batteries or other means, natural gas is under most circumstances the most reliable way to "balance the grid."
Summary
Natural gas is really a mixed bag of sustainability implications, especially with regards to hydraulic fracturing:
- The primary benefit from a sustainability perspective is that it has reduced CO2 emissions relative to using coal.
- However, to what extent natural gas leaks have counteracted that is in question. It is possible that natural gas leaks have completely erased all emissions benefits of replacing coal.
- Fracking has created an economic boom, at least in the short term. Again, the overall benefit of this boom is dependent upon whether or not externalities are considered.
- There are many downsides, particularly with regards to environmental damage (water, air, land), but also with regards to the quality of life for some people near wells.
- Please keep in mind that (as indicated on the first page of this lesson) any energy source that emits GHGs is not sustainable. Also, consider that natural gas is non-renewable.
There has been some recent movement toward more regulation of the fracking industry, but that has lessened under the Trump Administration. Regardless, natural gas use is only predicted to increase, so the more we know about all of its impacts - good and bad - the better off we will be. Stay tuned!
Check Your Understanding
Optional (But Strongly Suggested)
Now that you have completed the content, I suggest going through the Learning Objectives Self-Check list at the top of the page.